Monthly economic brief: August 2020
Provides a summary of latest key economic statistics, forecasts and analysis on the Scottish economy.
Output
Footnote [1]
Scotland's GDP data for May showed that output recovered slightly from April, however remained significantly below pre-COVID levels with lockdown restrictions still largely in place.
- Scotland's GDP grew 1.5% in May after falling by 18.9% in April and by 5.5% in March.
- The increase in output in May reflected a slight recovery in business activity over the month from April's low point, as firms and consumers adapted to lockdown restrictions and some business activity resumed.
- Despite the increase in output in May, Scotland's GDP was 22.1% below its level in February, prior to the lockdown restrictions which were introduced in March.
- At a sector level, growth in May was strongest in Construction (8.2%) and Production (5.7%). Services growth was more marginal (0.3%) and was supported by a pick-up in retail sales. However, lockdown restrictions continued to impact across other parts of the services sector.
- Overall, the industries with the largest falls in output during the lockdown have been those more consumer facing sectors or where working from home is not possible. This includes Accommodation & Food Services (-89.8% since February) and Arts, Culture & Recreation Services (-54.3% since February).
- More recent UK data show that UK GDP fell 20.4% over quarter 2 as a whole, following a 2.2% fall in quarter 1. The fall over the quarter was mainly driven by the 20% fall in output in April following the introduction of lockdown restrictions, with positive growth in May (2.4%) and June (8.7%) as lockdown measures eased. However, UK GDP remains 17.2% below its level in February.
- The scale and duration of lockdown restrictions has varied across countries and regions during the first half of the year and has had different impacts on output. Initial estimates show that US GDP fell 9.5% in Q2 (following a 1.3% fall in Q1) and Eurozone GDP fell 12.1% in Q2 (following a 3.6% fall in Q1).
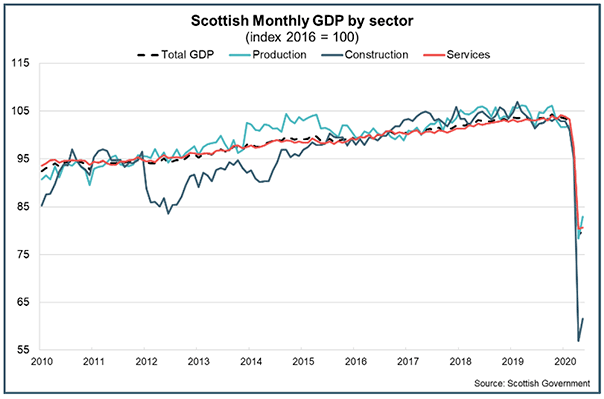
Figure Description
This chart shows a time series of Scottish Monthly GDP by sector from January 2010 to May 2020.
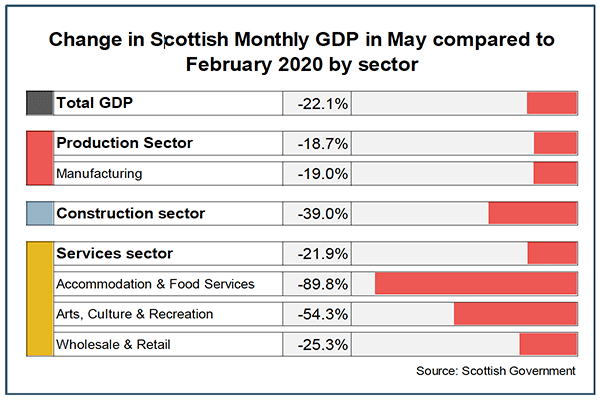
Figure Description
This table shows the changes in Scottish monthly GDP in May compared to February 2020 by sector. Total output in May was 22.1% below its level in February and across sectors Production sector output was 18.7% lower, Construction sector output was 39% lower and Services sector output was 21.9% lower.
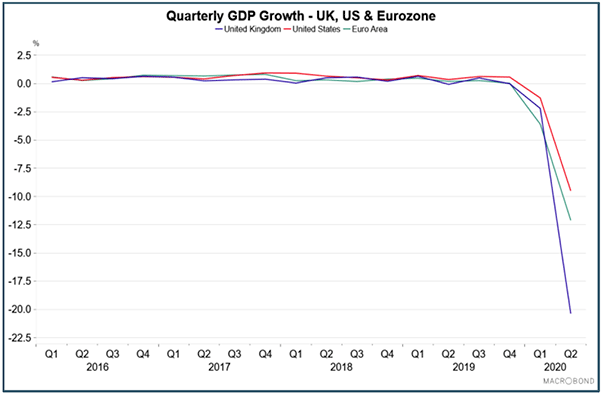
Figure Description
This chart shows a time series of Quarterly GDP growth rates for the UK, US and Eurozone for the period Q1 2015 and Q2 2020.
Contact
Email: OCEABusiness@gov.scot