Long-term Monitoring of Health Inequalities - Headline Indicators - October 2010
This publication is an update of headline indicators from the long term monitoring of health inequalities report, last published in September 2009.
Results
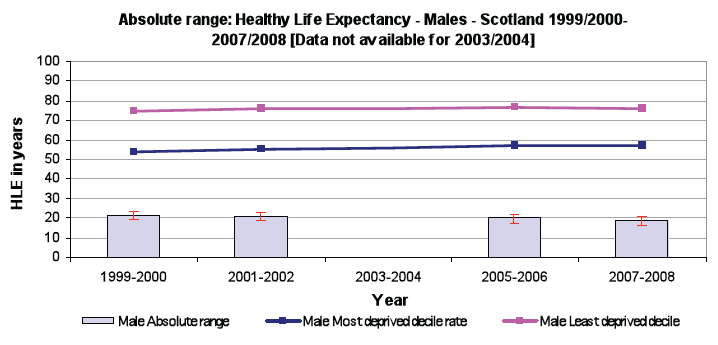
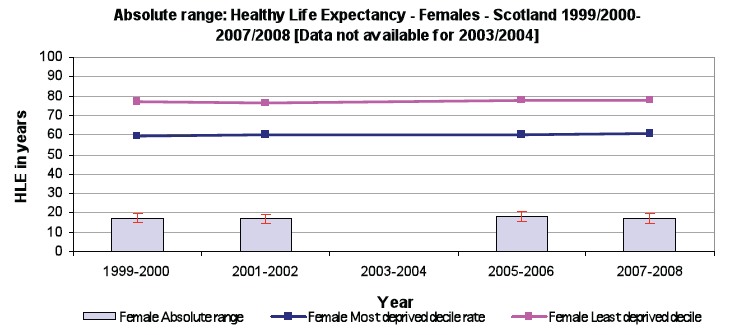
Healthy Life Expectancy ( HLE) - at birth
Summary
- Inequalities are stable in both absolute and relative terms
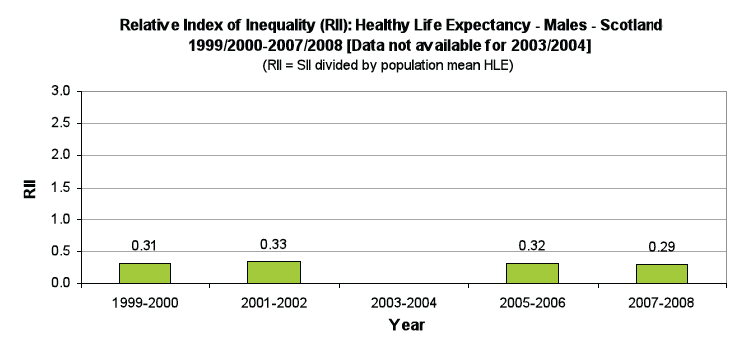
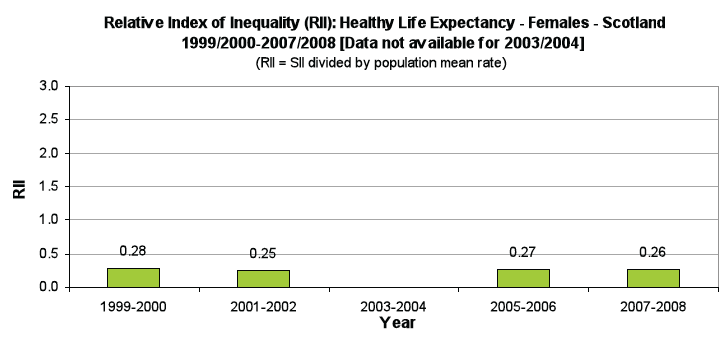
The HLE indicator is based on two years of data to ensure large enough sample sizes. Between 1999/2000 and 2007/2008, HLE has increased by 3 years (4.5%) for males and 2.3 years (3.5%) for females. Over the same period, the difference between HLE and total life expectancy (that is, the number of years that could be expected to be spent in poor health) has fallen by 0.6 years (7%) for males and 0.8 years (8%) for females. In 2007/2008, HLE at Scotland level for males was 68.0 years (7.2 years less than total life expectancy) and HLE for females was 70.5 years (9.4 years less than total life expectancy). HLE in deprived areas is lower for both males and females than HLE in areas of low deprivation. In 2007/2008, HLE of those living in the most deprived decile was 18.8 years lower for males and 17.1 years lower for females than HLE of those living in the least deprived decile. The difference between HLE and total life expectancy (expected years spent in poor health) is also notably greater in more deprived areas: for males - 10.3 years in poor health in the most deprived decile compared with 5.5 years in the least deprived decile; and for females - 14.4 years in poor health in the most deprived decile compared with 6.0 years in the least deprived decile. Between 1999/2000 and 2007/2008, increases in HLE have been observed across the population, with no discernible difference between deprivation groups. Inequalities have been stable in both absolute and relative terms (as demonstrated by the absolute range and RII respectively).
Inequalities gradient in the most recent year available
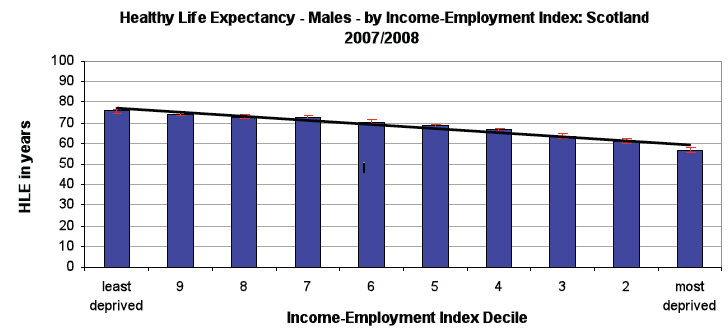
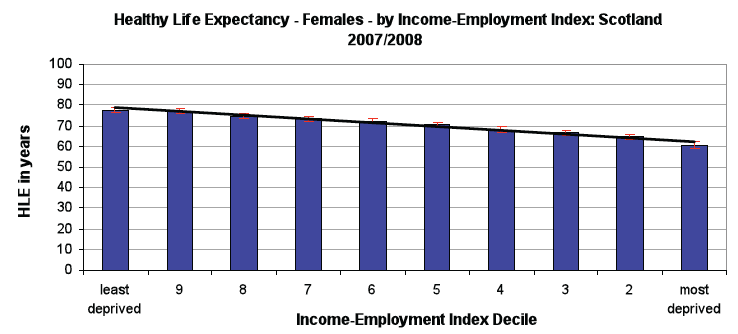
(Note: the red bars for each column indicate the uncertainties in each estimate of HLE).
Relative Index of Inequality ( RII) over time
Absolute range over time
(Note: the red bars for each column indicate the uncertainties in each estimate of absolute difference in HLE).
Scale / context
Male HLE in years |
95% LL |
95% UL |
Male LE in years |
95% LL |
95% UL |
Estimated years spent in poor health |
|
|---|---|---|---|---|---|---|---|
1999/2000 |
|||||||
Scotland |
65.0 |
64.7 |
65.4 |
73.0 |
72.8 |
73.1 |
7.8 |
Most deprived decile |
53.7 |
52.5 |
54.9 |
65.8 |
65.4 |
66.3 |
11.7 |
Least deprived decile |
75.0 |
73.9 |
76.0 |
78.6 |
78.3 |
79.0 |
3.3 |
2001/2002 |
|||||||
Scotland |
65.9 |
65.6 |
66.2 |
73.4 |
73.3 |
73.5 |
7.4 |
Most deprived decile |
55.0 |
53.8 |
56.2 |
65.8 |
65.4 |
66.3 |
10.4 |
Least deprived decile |
75.7 |
74.7 |
76.6 |
79.5 |
79.1 |
79.9 |
3.4 |
2003/2004 |
|||||||
Scotland |
74.0 |
73.9 |
74.1 |
- |
|||
Most deprived decile |
66.3 |
65.9 |
66.8 |
- |
|||
Least deprived decile |
79.7 |
79.3 |
80.0 |
- |
|||
2005/2006 |
|||||||
Scotland |
67.4 |
67.1 |
67.7 |
74.8 |
74.7 |
74.9 |
7.3 |
Most deprived decile |
57.0 |
55.9 |
58.1 |
67.5 |
67.1 |
67.9 |
10.1 |
Least deprived decile |
76.8 |
75.8 |
77.8 |
80.7 |
80.4 |
81.1 |
3.6 |
2007/2008 |
|||||||
Scotland |
68.0 |
67.6 |
68.3 |
75.1 |
75.2 |
75.0 |
7.2 |
Most deprived decile |
56.9 |
55.7 |
58.1 |
67.6 |
67.2 |
68.0 |
10.3 |
Least deprived decile |
75.7 |
74.6 |
76.8 |
80.9 |
81.2 |
80.5 |
5.5 |
Female HLE in years |
95% LL |
95% UL |
Female LE in years |
95% LL |
95% UL |
Estimated years spent in poor health |
|
|---|---|---|---|---|---|---|---|
1999/2000 |
|||||||
Scotland |
68.2 |
67.8 |
68.5 |
78.4 |
78.3 |
78.5 |
10.2 |
Most deprived decile |
59.8 |
58.6 |
61.0 |
74.2 |
73.9 |
74.6 |
14.1 |
Least deprived decile |
77.1 |
76.2 |
78.0 |
81.8 |
81.5 |
82.1 |
4.4 |
2001/2002 |
|||||||
Scotland |
69.2 |
68.9 |
69.6 |
78.9 |
78.8 |
79.0 |
9.5 |
Most deprived decile |
60.0 |
58.8 |
61.2 |
74.6 |
74.2 |
74.9 |
14.2 |
Least deprived decile |
76.8 |
75.7 |
77.9 |
82.4 |
82.1 |
82.8 |
5.3 |
2003/2004 |
|||||||
Scotland |
79.1 |
79.0 |
79.2 |
- |
|||
Most deprived decile |
74.8 |
74.4 |
75.2 |
- |
|||
Least deprived decile |
83.0 |
82.6 |
83.3 |
- |
|||
2005/2006 |
|||||||
Scotland |
69.6 |
69.3 |
70.0 |
79.7 |
79.6 |
79.8 |
10.0 |
Most deprived decile |
59.9 |
58.7 |
61.1 |
75.1 |
74.7 |
75.5 |
14.9 |
Least deprived decile |
78.1 |
76.9 |
79.2 |
84.2 |
83.9 |
84.6 |
5.8 |
2007/2008 |
|||||||
Scotland |
70.5 |
70.1 |
70.9 |
80.0 |
79.8 |
80.1 |
9.4 |
Most deprived decile |
60.8 |
59.5 |
62.1 |
75.6 |
75.2 |
75.9 |
14.4 |
Least deprived decile |
77.9 |
76.7 |
79.1 |
84.2 |
83.9 |
84.5 |
6.0 |
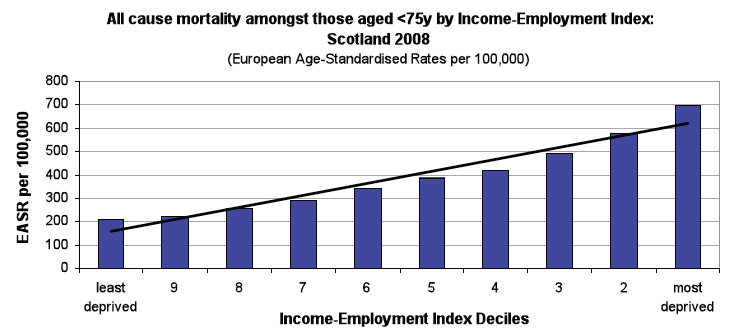
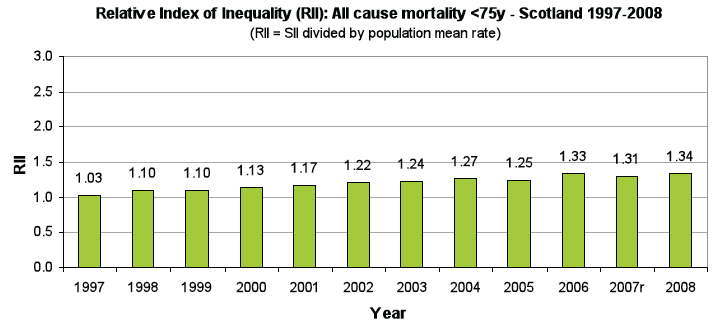
Premature Mortality - from all causes, aged under 75 years
Summary
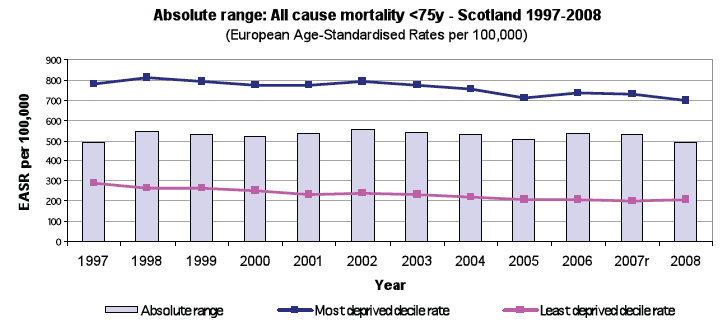
- Inequalities are stable in absolute terms but are widening in relative terms
Between 1997 and 2008, deaths amongst those aged under 75 years have decreased by 21.2%. Despite these decreases, around 22,000 people aged under 75 still die each year. Deaths in this age group are more common in deprived areas than in areas of low deprivation. In 2008, the rate in the most deprived decile was 698 compared to a rate of 205 in the least deprived decile - a difference of 493 premature deaths per 100,000 population. Recent reductions in premature mortality have been observed across the population. Whilst inequalities have been stable in absolute terms (as demonstrated by the absolute range), improvements observed in deprived areas have not been as great as those observed elsewhere in Scotland resulting in a widening of inequalities in relative terms (as demonstrated by RII).
Inequalities gradient in the most recent year available
Relative Index of Inequality ( RII) over time
Absolute range over time
Scale / context
Number of deaths |
Target population size |
Rate per 100,000 ( EASR) |
|
|---|---|---|---|
1997 |
26,081 |
4,740,269 |
485.5 |
1998 |
25,857 |
4,729,975 |
479.8 |
1999 |
25,491 |
4,721,298 |
471.6 |
2000 |
24,593 |
4,708,667 |
454.1 |
2001 |
24,168 |
4,703,661 |
446.2 |
2002 |
24,219 |
4,690,508 |
443.8 |
2003 |
23,789 |
4,690,603 |
431.4 |
2004 |
22,896 |
4,706,922 |
411.6 |
2005 |
22,441 |
4,718,403 |
401.0 |
2006 |
22,237 |
4,734,676 |
395.8 |
2007r |
22,359 |
4,755,963 |
393.4 |
2008 |
22,005 |
4,775,321 |
382.8 |
Mental Wellbeing ( WEMWBS) - adults aged 16 years and over
Summary
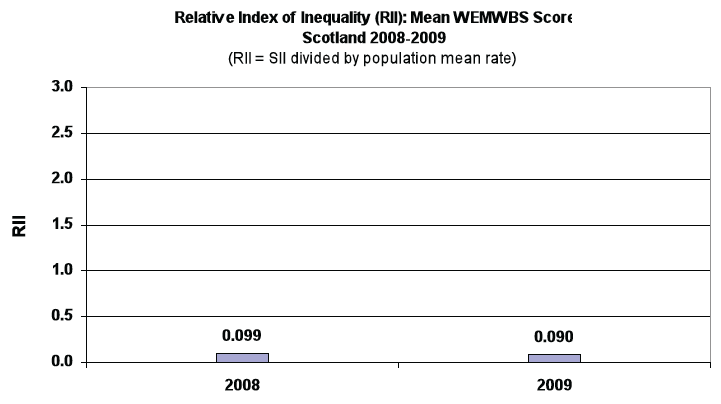
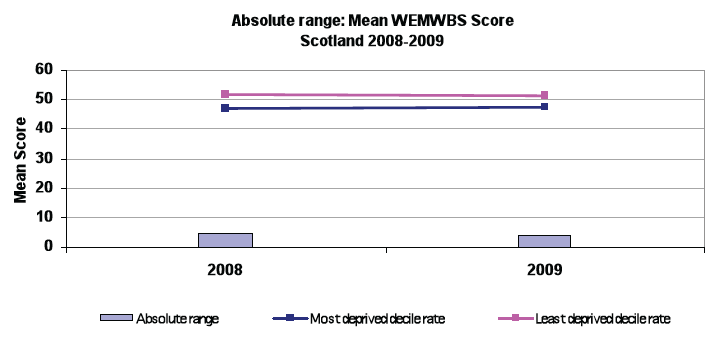
- Inequalities are stable in both absolute and relative terms but more data required to identify a trend
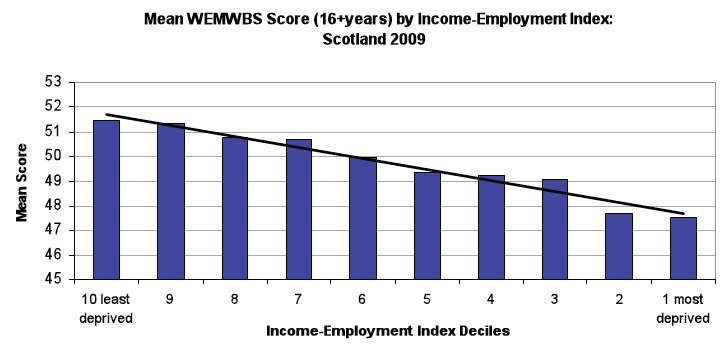
There is a clear difference in mean WEMWBS scores in terms of deprivation. Those in the most deprived decile reported a lower mean score (indicating lower mental wellbeing) than those in the highest decile (a difference of 3.9 between the lowest and highest deciles). Both absolute and relative inequalities have remained stable although with only two data points available more information is required over time to identify a trend.
Inequalities Gradient in the most recent year available
Relative Index of Inequality ( RII) over time
Absolute range over time
Scale / context
SIMD decile |
Mean WEMWBS score 2008 |
Mean WEMWBS score 2009 |
|---|---|---|
most deprived |
47.4 |
47.5 |
2 |
47.8 |
47.7 |
3 |
48.9 |
49.1 |
4 |
49.6 |
49.2 |
5 |
49.8 |
49.4 |
6 |
50.5 |
49.9 |
7 |
50.7 |
50.7 |
8 |
51.3 |
50.8 |
9 |
51.6 |
51.3 |
least deprived |
51.7 |
51.4 |
Total |
50.0 |
49.8 |
Low Birthweight
Summary
- Inequalities are narrowing in both absolute and relative terms
Between 1998 and 2008, the number and percentage of low birthweight babies has been relatively stable. Around 3,000 low birthweight babies are born each year (around 6% of total live, singleton births in Scotland). As found previously, low birthweight babies are more common in deprived areas than in areas of low deprivation. In 2008, the percentage in the most deprived decile was 7.6 compared to 3.9 in the least deprived decile - a difference of 3.7 percentage points. However, inequalities have narrowed in both absolute (as demonstrated by the absolute range) and relative terms (as demonstrated by the RII). This is mainly due to a reduction in the most deprived deciles as the percentage of low birthweight babies in the least deprived decile has remained fairly stable in recent years.
Inequalities gradient in the most recent year available
Relative Index of Inequality ( RII) over time
Absolute range over time
Scale / context
Number of low BW babies |
Target population size (live singleton births) |
Percentage |
|
|---|---|---|---|
1998 |
3108 |
55,152 |
5.6 |
1999 |
3098 |
52,726 |
5.9 |
2000 |
2906 |
51,082 |
5.7 |
2001 |
2848 |
49,752 |
5.7 |
2002 |
2910 |
48,952 |
5.9 |
2003 |
3026 |
50,071 |
6.0 |
2004 |
3030 |
51,852 |
5.8 |
2005 |
3056 |
51,372 |
5.9 |
2006 |
2928 |
52,286 |
5.6 |
2007r |
3083 |
54,863 |
5.6 |
2008 |
3104 |
56,305 |
5.5 |
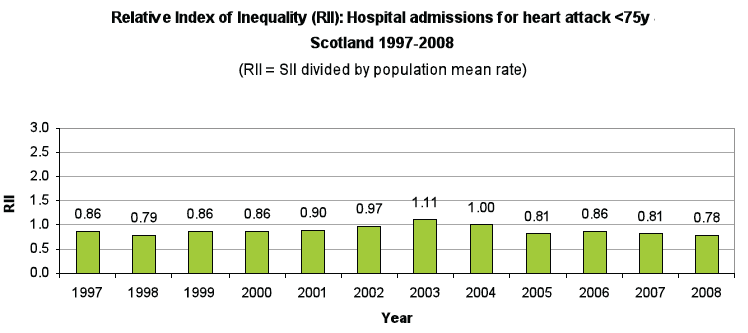
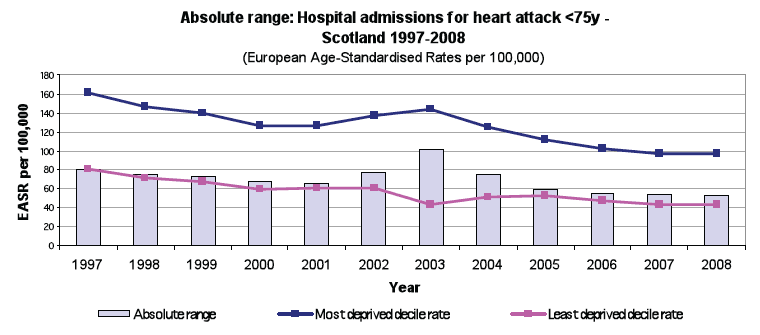
Coronary Heart Disease - first ever hospital admission for heart attack aged under 75 years
Summary
- Inequalities have decreased in both absolute and relative terms in recent years
Around 3,800 new cases (aged under 75 years) were admitted to hospital for heart attack in 2008. However between 1997 and 2008, there has been a considerable decrease (40%) in the annual rates. Despite this downward trend, in 2008 the rate of admission for people living in the most deprived decile was 96.1 per 100,000 population compared to a rate of 43.1 in the least deprived decile - a difference of 53.0. Although both absolute and relative measures reflect higher rate of hospital admissions in deprived areas, the extent of these inequalities has been decreasing since 2003, mainly due to a reduction in the most deprived areas.
Inequalities gradient in the most recent year available
Relative Index of Inequality ( RII) over time
Absolute range over time
Scale / context
Number of new cases* |
Target population size* |
Rate per 100,000 ( EASR)* |
|
|---|---|---|---|
1997 |
5,814 |
4,740,269 |
111.8 |
1998 |
5,735 |
4,729,975 |
109.3 |
1999 |
5,155 |
4,721,298 |
97.9 |
2000 |
4,886 |
4,708,667 |
92.0 |
2001 |
4,852 |
4,703,661 |
90.9 |
2002 |
4,877 |
4,690,508 |
90.4 |
2003 |
4,634 |
4,690,603 |
85.1 |
2004 |
4,468 |
4,706,922 |
81.4 |
2005 |
4,117 |
4,718,403 |
74.3 |
2006 |
3,883 |
4,734,676 |
69.8 |
2007 |
3,681 |
4,755,963 |
65.5 |
2008 |
3,802 |
4,775,321 |
66.9 |
*Please note that trend data for this indicator have been revised from last year's report.
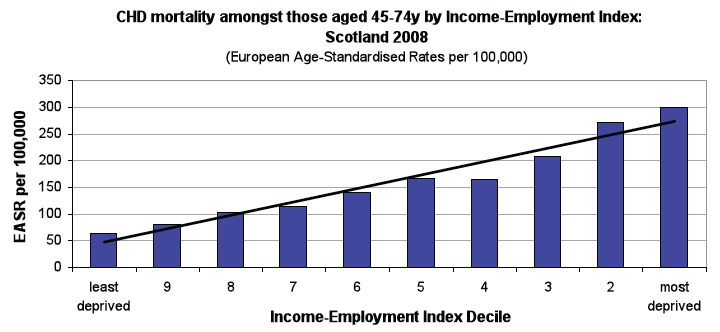
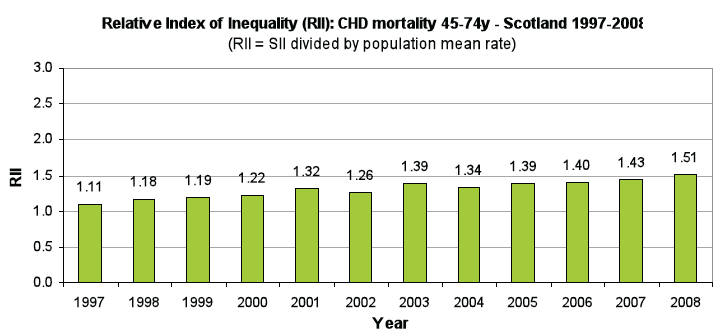
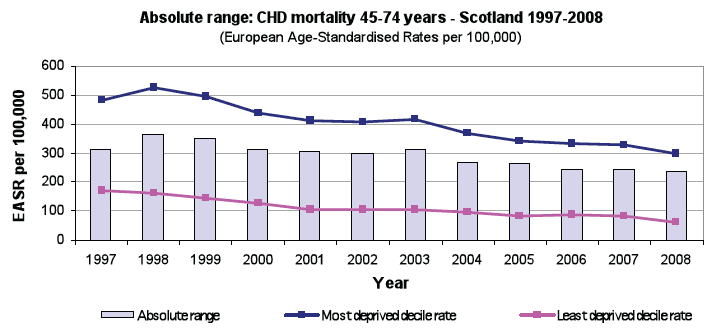
Coronary Heart Disease ( CHD) - deaths aged 45-74 years
Summary
- Inequalities have narrowed in absolute terms but are widening in relative terms
Between 1997 and 2008, there has been a considerable decrease in CHD mortality amongst the population aged 45-74 years as a whole - rates fell by 51%. However, CHD remains one of Scotland's biggest causes of premature mortality, with around 3,100 deaths occurring in the latest year. Premature mortality from CHD is more prevalent in deprived areas than in areas of low deprivation. In 2008, there were 299 deaths per 100,000 population in the most deprived decile compared to 63 deaths per 100,000 population in the least deprived decile. The absolute range indicates that inequalities have narrowed in absolute terms, however improvements observed in deprived areas have not been as great as those observed in Scotland overall, resulting in a widening of inequalities in relative terms (as demonstrated by the RII).
Inequalities gradient in the most recent year available
Relative Index of Inequality ( RII) over time
Absolute range over time
Scale / context
Number of deaths |
Target population size |
Rate per 100,000 ( EASR) |
|
|---|---|---|---|
1997 |
5,887 |
1,635,590 |
320.0 |
1998 |
5,676 |
1,646,711 |
306.1 |
1999 |
5,389 |
1,658,124 |
289.8 |
2000 |
4,858 |
1,670,660 |
261.1 |
2001 |
4,483 |
1,687,422 |
238.9 |
2002 |
4,309 |
1,703,819 |
227.9 |
2003 |
4,197 |
1,724,940 |
219.5 |
2004 |
3,840 |
1,750,293 |
198.8 |
2005 |
3,721 |
1,771,454 |
191.2 |
2006 |
3,394 |
1,793,423 |
174.5 |
2007 |
3,374 |
1,818,202 |
171.4 |
2008 |
3,153 |
1,843,609 |
157.8 |
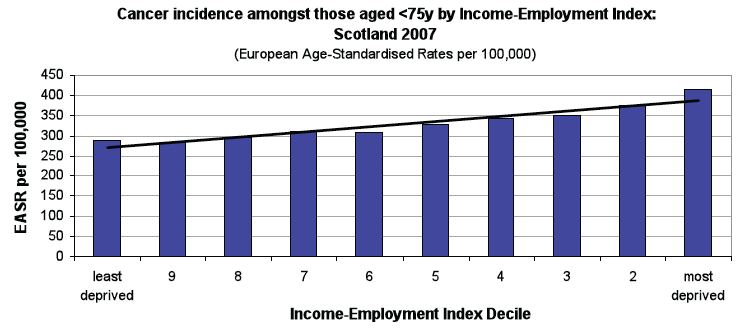
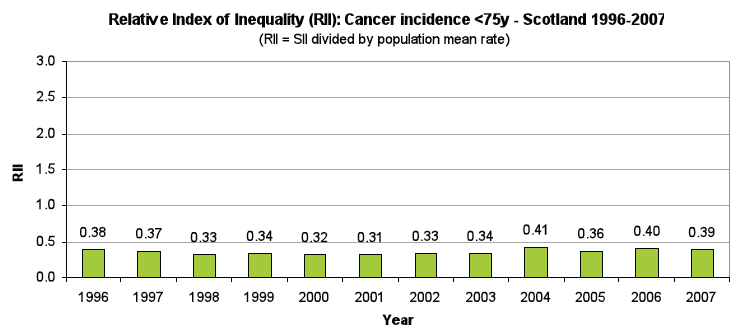
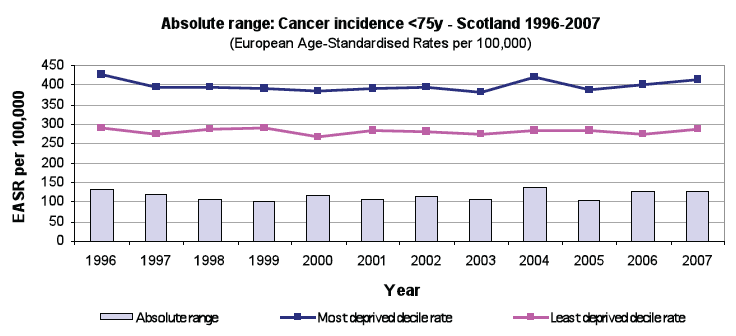
Cancer - incidence rate aged under 75 years
Summary
- Inequalities are stable in both absolute and relative terms
There were around 18,500 new cases of cancer diagnosed in 2007. Rates have decreased by 5% since 1996 but fluctuated year on year with not clear trend since 1997. In 2007, the rate in the most deprived decile was 414 per 100,000 population compared to a rate of 288 in the least deprived decile - a difference of 126. Inequality measures (both absolute range and RII) have remained stable, albeit with some fluctuations from one year to the next.
Inequalities gradient in the most recent year available
Relative Index of Inequality ( RII) over time
Absolute range over time
Scale / context
Number of new cases |
Target population size |
Rate per 100,000 ( EASR) |
|
|---|---|---|---|
1996 |
18,136 |
4,754,906 |
345.1 |
1997 |
17,160 |
4,740,269 |
326.7 |
1998 |
17,144 |
4,729,975 |
323.6 |
1999 |
16,915 |
4,721,298 |
318.4 |
2000 |
17,122 |
4,708,667 |
321.2 |
2001 |
17,097 |
4,703,661 |
318.8 |
2002 |
17,465 |
4,690,508 |
323.3 |
2003 |
17,453 |
4,690,603 |
319.2 |
2004 |
18,002 |
4,706,922 |
326.5 |
2005 |
17,800 |
4,718,403 |
319.3 |
2006 |
17,873 |
4,734,676 |
318.5 |
2007 |
18,577 |
4,755,963 |
328.1 |
Cancer - deaths aged 45-74 years
Summary
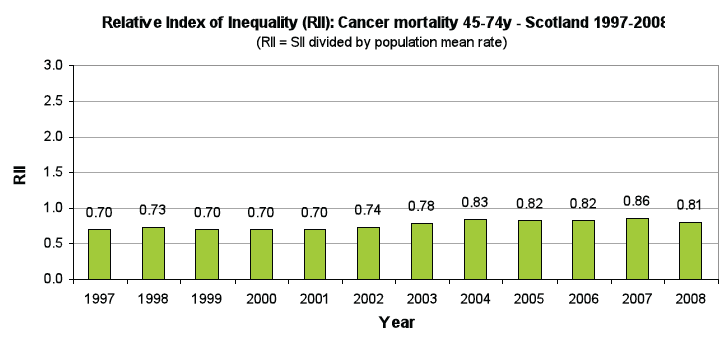
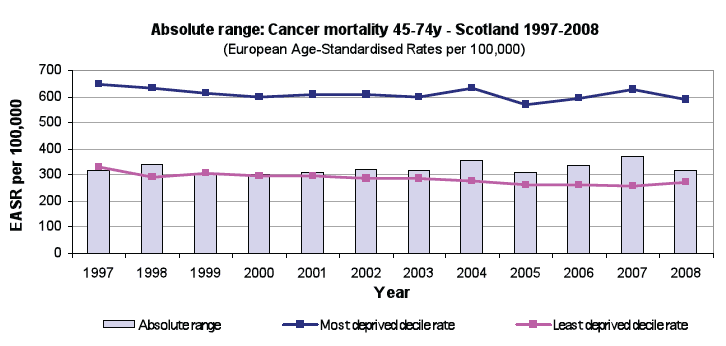
- Inequalities have generally increased in absolute and relative terms over time but there has been a slight reduction in the latest year.
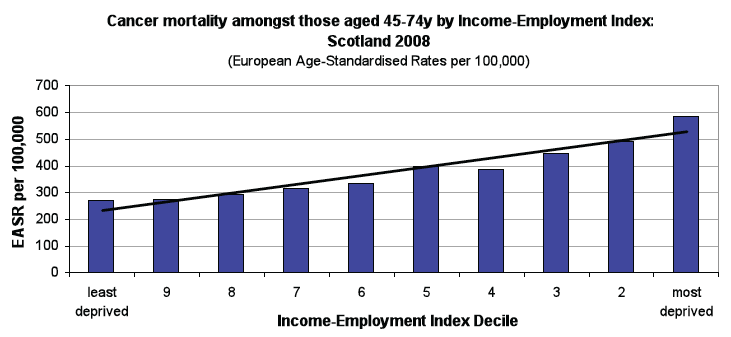
Between 1997 and 2008, there has been a 15.4% decrease in rates of death from cancer amongst those aged 45-74 years as a whole. In 2008, around 7,500 people aged 45-74 died from cancer. Cancer deaths in this age group are more common in deprived areas (588 per 100,000 population) than in areas of low deprivation (273 per 100,000 population) - a difference of 315. Previous data up to 2007 suggested an increase in inequalities in both absolute and relative terms. However, data for 2008 shows a slight decrease in both measures.
Inequalities gradient in the most recent year available
Relative Index of Inequality ( RII) over time
Absolute range over time
Scale / context
Number of deaths |
Target population size |
Rate per 100,000 ( EASR) |
|
|---|---|---|---|
1997 |
8,068 |
1,635,590 |
446.9 |
1998 |
7,995 |
1,646,711 |
440.0 |
1999 |
7,904 |
1,658,124 |
433.8 |
2000 |
7,776 |
1,670,660 |
422.8 |
2001 |
7,903 |
1,687,422 |
430.1 |
2002 |
7,850 |
1,703,819 |
422.4 |
2003 |
7,706 |
1,724,940 |
409.3 |
2004 |
7,678 |
1,750,293 |
402.0 |
2005 |
7,606 |
1,771,454 |
396.7 |
2006 |
7,486 |
1,793,423 |
386.6 |
2007 |
7,569 |
1,818,202 |
385.4 |
2008 |
7,503 |
1,843,609 |
377.9 |
Alcohol - first ever hospital admission aged under 75 years
Summary
- Inequalities have fluctuated with no clear trend in absolute and relative terms
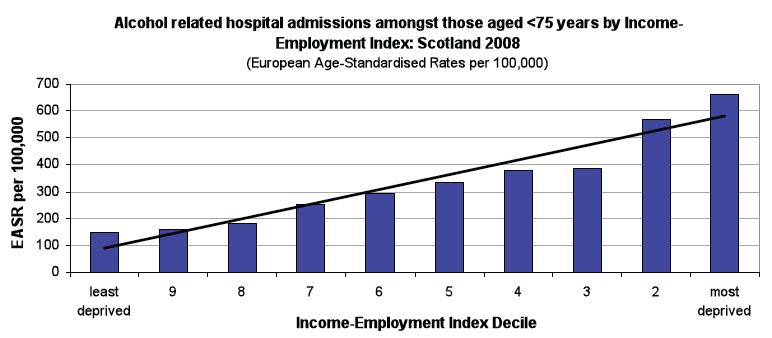
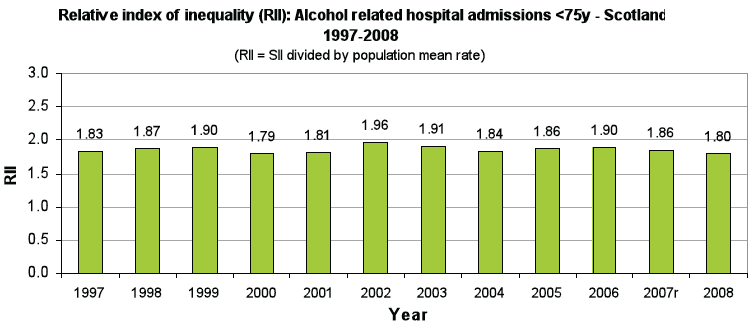
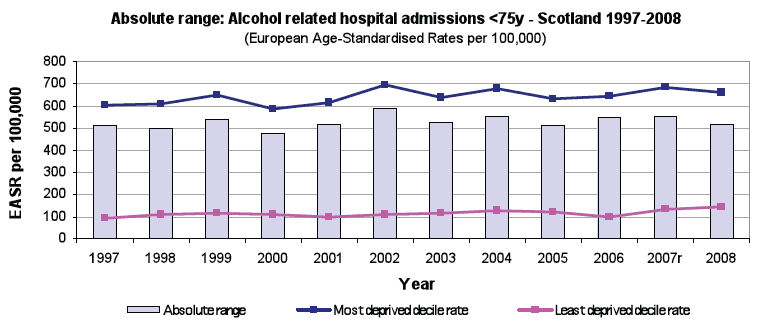
There has been a 19% increase in rates of new hospital admissions for alcohol related conditions amongst those aged under 75 years between 1997 and 2008. In 2008 there were around 15,000 new cases. These types of admissions are more common in deprived areas - 661 per 100,000 population compared to 145 per 100,000 population in areas of low deprivation, absolute range is 516. Both absolute and relative inequalities have remained stable, albeit with some fluctuation from one year to the next. There was a slight decrease in inequality in the latest year, mainly cause by an increase in the admission rate in the least deprived decile from 134 to 145 per 100,000 population.
Inequalities gradient in the most recent year available
Relative Index of Inequality ( RII) over time
Absolute range over time
Scale / context
Number of admissions |
Target pop |
EASR |
|
|---|---|---|---|
1997 |
12,310 |
4,740,269 |
254.1 |
1998 |
12,900 |
4,729,975 |
265.7 |
1999 |
12,871 |
4,721,298 |
265.8 |
2000 |
12,695 |
4,708,667 |
262.6 |
2001 |
13,474 |
4,703,661 |
276.9 |
2002 |
13,656 |
4,690,508 |
280.3 |
2003 |
13,249 |
4,690,603 |
269.6 |
2004 |
14,482 |
4,706,922 |
291.6 |
2005 |
13,911 |
4,718,403 |
278.8 |
2006 |
14,353 |
4,734,676 |
286.7 |
2007r |
15,344 |
4,755,963 |
307.0 |
2008 |
15,185 |
4,775,321 |
302.0 |
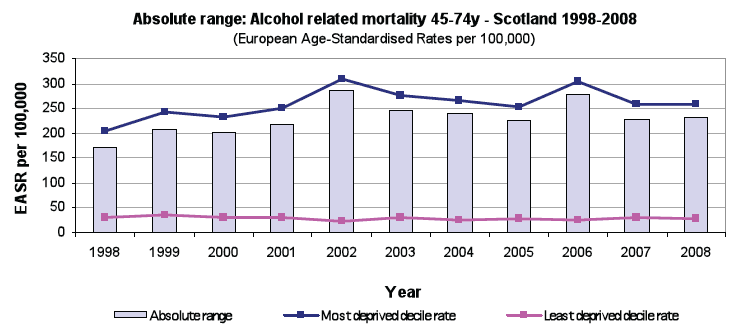
Alcohol - deaths aged 45-74 years
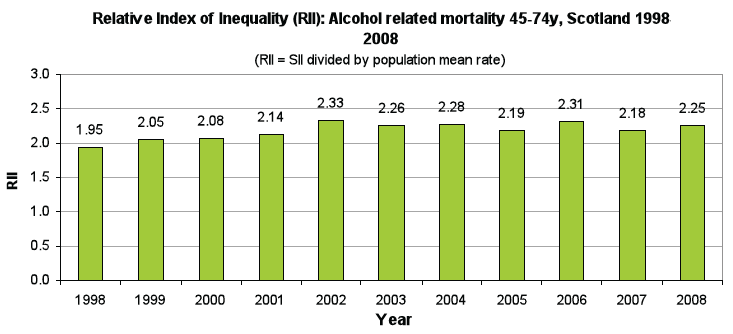
Summary
- Inequalities have fluctuated in absolute and relative terms over time but there has been a slight reduction in the latest year.
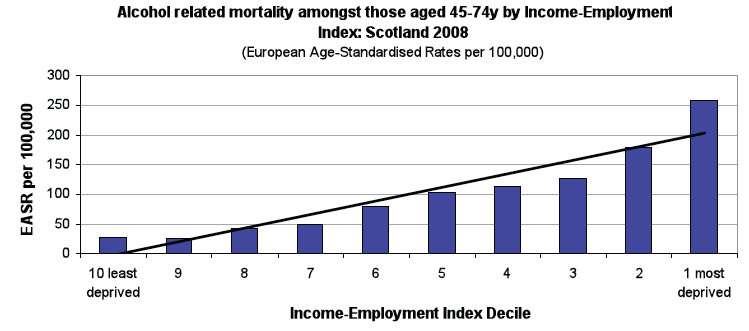
Between 1998 and 2008, there has been a 13% increase in the rates of alcohol related deaths amongst those aged under 45-74 years as a whole. Numbers have risen to around 1,800 deaths per year in this age group dying from alcohol related conditions. There are more alcohol related deaths amongst those aged 45-74 years in deprived areas than in areas of low deprivation. In 2008, the rate in the most deprived decile was 259 per 100,000 population compared to a rate of 28 per 100,000 population in the least deprived decile - a difference of 231 deaths. Increases in alcohol related deaths amongst those aged 45-74 years have been particularly observed in deprived areas. Both absolute and relative inequalities have shown some fluctuation from one year to the next. There was a slight decrease in inequality in the latest year, mainly cause by a decrease in the alcohol related death rate for the most deprived decile from 303 to 258 per 100,000 population.
Inequalities gradient in the most recent year available
Relative Index of Inequality ( RII) over time
Absolute range over time
Scale / context
Number of deaths |
Target population size |
Rate per 100,000 ( EASR)* |
|
|---|---|---|---|
1998 |
1,415 |
1,646,711 |
85.6 |
1999 |
1,508 |
1,658,124 |
91.0 |
2000 |
1,489 |
1,670,660 |
89.1 |
2001 |
1,565 |
1,687,422 |
92.8 |
2002 |
1,753 |
1,703,819 |
102.9 |
2003 |
1,749 |
1,724,940 |
101.4 |
2004 |
1,764 |
1,750,293 |
100.8 |
2005 |
1,790 |
1,771,454 |
101.1 |
2006 |
1,899 |
1,793,423 |
105.9 |
2007 |
1,801 |
1,818,202 |
99.1 |
2008 |
1,782 |
1,843,609 |
96.7 |
*Please note that all data have been revised due to an error in the standardisation calculations.
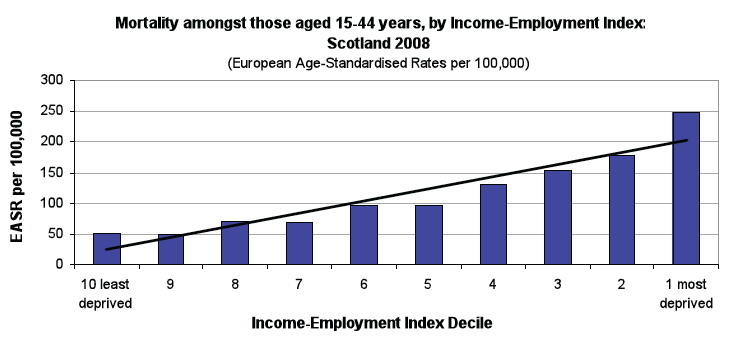
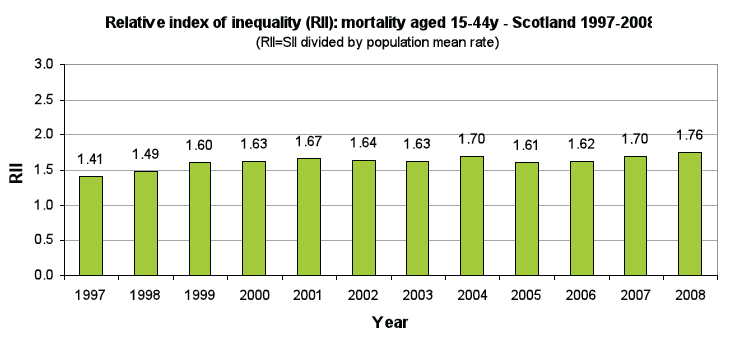
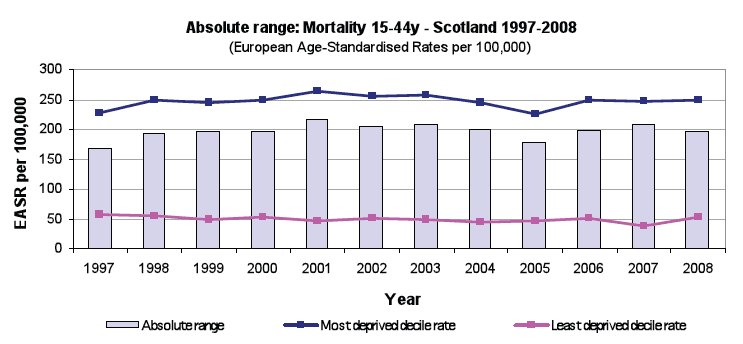
All-cause mortality aged 15-44 years
Summary
- Inequalities have remained stable in absolute terms but are widening in relative terms
Between 1997 and 2008, rates of death have been stable amongst those aged 15-44 years as a whole. Within this age group, rates of drug related deaths have more than doubled over the same period (to around 470 deaths per year), rates of death from assault have stayed the same (around 50 deaths per year) and rates of death from suicide have dropped by 3% (to around 480 deaths per year). However, note that the relatively small numbers involved mean that comparison of numbers for single years should be interpreted with caution as there will be natural fluctuation from one year to the next. Deaths amongst those aged 15-44 years are more common in deprived areas than in areas of low deprivation. In 2008, the all-cause mortality rate for adults aged 15-44 years in the most deprived decile was 248 compared to a rate of 52 in the least deprived decile - a difference of 196 deaths. Whilst inequalities has remained fairly stable in absolute term over this period, it has increased in relative terms (as demonstrated by the RII, albeit with some fluctuation from one year to the next).
Inequalities gradient in the most recent year available
Relative Index of Inequality ( RII) over time
Absolute range over time
Scale / context
Number of all-causes deaths |
Target population size |
Rate per 100,000 ( EASR)* |
|
|---|---|---|---|
1997 |
2,436 |
2,158,030 |
112.0 |
1998 |
2,498 |
2,142,787 |
115.1 |
1999 |
2,507 |
2,129,794 |
115.6 |
2000 |
2,501 |
2,118,568 |
114.8 |
2001 |
2,509 |
2,111,242 |
114.9 |
2002 |
2,566 |
2,096,447 |
118.5 |
2003 |
2,461 |
2,087,978 |
113.3 |
2004 |
2,409 |
2,084,722 |
110.9 |
2005 |
2,305 |
2,081,858 |
105.5 |
2006 |
2,482 |
2,085,170 |
114.5 |
2007 |
2,461 |
2,086,427 |
114.2 |
2008 |
2,443 |
2,081,506 |
114.5 |
*Please note that all data have been revised due to an error in the standardisation calculations.
Deaths from assault |
Drug related deaths |
Suicides |
||||
|---|---|---|---|---|---|---|
Number |
EASR per 100,000 |
Number |
EASR per 100,000 |
Number |
EASR per 100,000 |
|
1997 |
56 |
2.6 |
196 |
9.1 |
518 |
23.7 |
1998 |
65 |
3.1 |
227 |
10.8 |
526 |
24.2 |
1999 |
86 |
4.0 |
274 |
13.2 |
529 |
24.6 |
2000 |
60 |
2.9 |
268 |
12.8 |
541 |
25.5 |
2001 |
63 |
3.0 |
288 |
13.8 |
531 |
24.9 |
2002 |
76 |
3.6 |
345 |
17.0 |
539 |
25.6 |
2003 |
71 |
3.4 |
281 |
13.7 |
456 |
21.5 |
2004 |
78 |
3.8 |
311 |
15.4 |
475 |
22.1 |
2005 |
50 |
2.4 |
277 |
13.2 |
436 |
20.7 |
2006 |
83 |
4.0 |
351 |
17.0 |
435 |
20.6 |
2007 |
54 |
2.6 |
392 |
18.9 |
453 |
21.6 |
2008 |
53 |
2.6 |
477 |
23.1 |
480 |
23.1 |