Local Government 2021-22 Provisional Outturn and 2022-23 Budget Estimates
This publication summarises the 2021-22 provisional outturn and 2022-23 budget estimates for revenue and capital services provided by Scottish local authorities.
Revenue Expenditure
Revenue expenditure is the cost of delivering services each year and includes both service operating costs and overheads. These costs might include salaries, rent, building maintenance, supplies and services. The benefits from revenue expenditure are mainly received within the financial year.
Net revenue expenditure is the element of revenue expenditure funded by general funding or reserves. It is calculated as gross service expenditure minus gross service income. Gross service income is any income received directly relating to services, such as service-specific grants or fees / charges received for the provision of services. Net revenue expenditure is therefore directly influenced by the amount of service income received, i.e. an increase in service income will reduce net revenue expenditure, and a decrease in service income will increase net revenue expenditure. Where service income is greater than service expenditure, a service would have a negative net revenue expenditure, i.e. net income. Individual local authority level figures can also be affected by large, one-off payments in any year, for example Equal Pay back-pay settlement expenditure.
The Revenue POBE collects net revenue expenditure for all General Fund services only. Revenue figures exclude amounts relating to a local authority's direct provision of housing which is recorded in the Housing Revenue Account (HRA), however 2021-22 budget estimates for local authority's HRA were published in the Housing Revenue Accounts Statistics in October 2021. It should also be noted that for the purposes of the Revenue POBE return and this publication, Trading Services includes amounts relating to Harbour Accounts. These are separate accounts and reserve funds specifically for harbour undertakings held by Orkney Islands and Shetland Islands councils only.
Local authorities have reported provisional outturn net revenue expenditure of £12,715 million in 2021-22, and have budgeted net revenue expenditure of £12,954 million for 2022-23.
Figure 1 shows that net revenue expenditure has increased in each year between 2018-19 and 2022-23. The increase in 2020-21 was very small, reflecting the impacts of the COVID-19 pandemic. The increase to 2021-22 has been much larger, more in line with the pre-pandemic increase between 2018-19 and 2019-20. Local authorities have then budgeted for a further small increase in 2022-23.
Local authorities were asked to provide figures for additional gross expenditure directly incurred due to COVID-19 in order to give some indication of the impact of COVID-19 in each year. Compared to additional COVID-19 expenditure of £604 million in 2020-21, local authorities reported a provisional figure of £467 million in 2021-22 and budgeted for £158 million of additional COVID-19 expenditure in 2022-23. This reflects that whilst there is still continued additional expenditure relating to COVID-19 in both 2021-22 and 2022-23, local authorities expect this to reduce.
Figure 1: General Fund Net Revenue Expenditure for 2018-19 to 2022-23, £ millions
Source: POBE 2022 Return, LFR 00
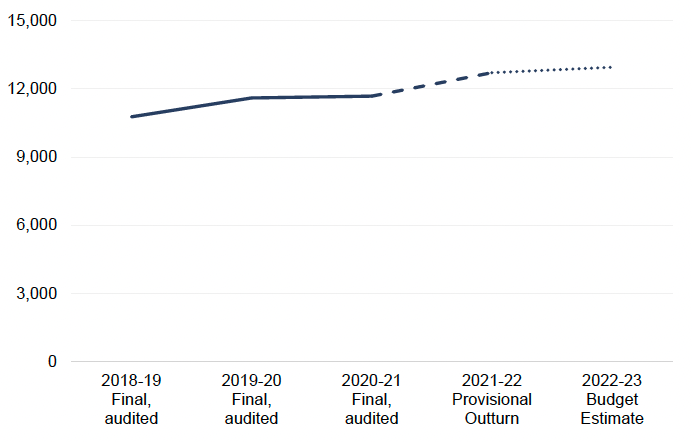
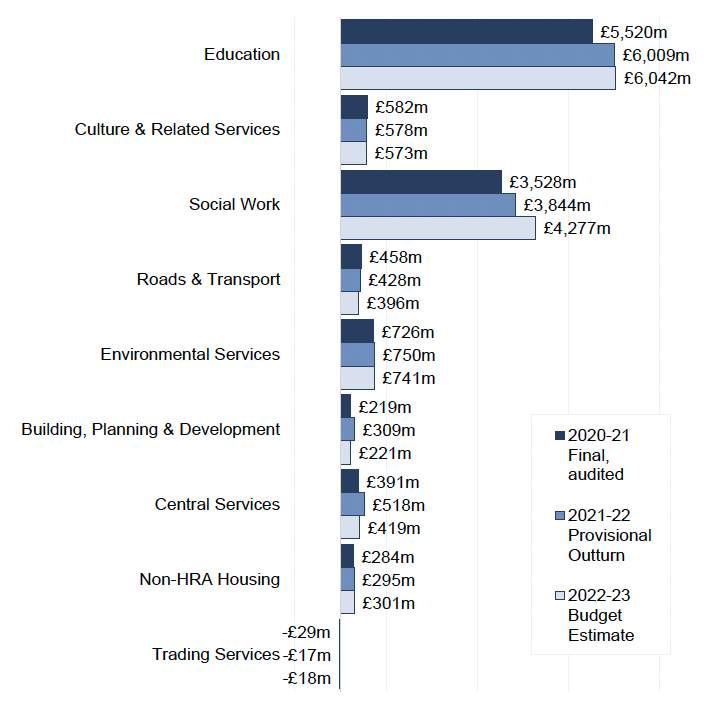
Figure 2 provides a summary of the 2021-22 provisional outturn and 2022-23 budget estimate for net revenue expenditure against the final, audited net revenue expenditure from 2020-21 by service. Education and Social Work continue to be the services with highest net revenue expenditure in both years'.
Education has the highest net revenue expenditure, with provisional outturn of £6,009 million in 2021-22, and a budget estimate for 2022-23 of £6,042 million. This is in line with the overall trend in net revenue expenditure as shown in Figure 1.
Social Work has the second highest net revenue expenditure, with local authorities reporting provisional outturn of £3,844 million in 2021-22 and have budgeted expenditure of £4,277 million for 2022-23. The scale of the increase between 2021-22 and 2022-23 is higher than the overall trend for total General Fund services. However, this was reflected across almost all local authorities and looks to be driven by an increase in SG funding in 2022-23 relating to a range of health & social care and mental health services.
Figure 2: Net Revenue Expenditure for 2020-21 to 2022-23 by Service, £ millions
Source: POBE 2022 Return, LFR 00
Local authorities also incur some revenue expenditure and income that is not attributable to specific services, such as interest paid or received, or statutory repayment of debts. As shown in Table 1, local authorities' provisional outturn and budget estimates for other expenditure and income is £1,113 million and £1,132 million respectively.
General funding principally consists of the General Revenue Grant (GRG) and local taxation, specifically Non-Domestic Rates (NDR) and Council Tax. Local authorities have reported provisional general funding of £13,726 million in 2021-22, and have budgeted for general funding of £13,809 million in 2022-23. Figure 3 shows how net revenue expenditure is financed from 2018-19 to 2022-23.
Figure 3: General Funding for 2018-19 to 2022-23, £ millions
Please note the following:
GRG figures for 2018-19 and 2019-20 differ from the Finance Circular allocation due to £10m for Teacher's Pay which was paid as part of the 2019-20 settlement but recorded by local authorities as income in 2018-19.
The 2020-21, 2021-22 and 2022-23 GRG figures differ to the Finance Circular allocation due to the exclusion of amounts for agency grants paid to local authorities via GRG.
'Other Funding' includes government grants paid to joint boards and income received through NDR Tax Incremental Financing (TIF) and Business Rates Incentivisation Scheme (BRIS). As this category amounts to less than 1% of the total shown in each year, this category is not visible in the chart, however figures are provided in the 'POBE 2022 – Tables' supporting Excel file.
Source: POBE 2022 Return, LFR A0
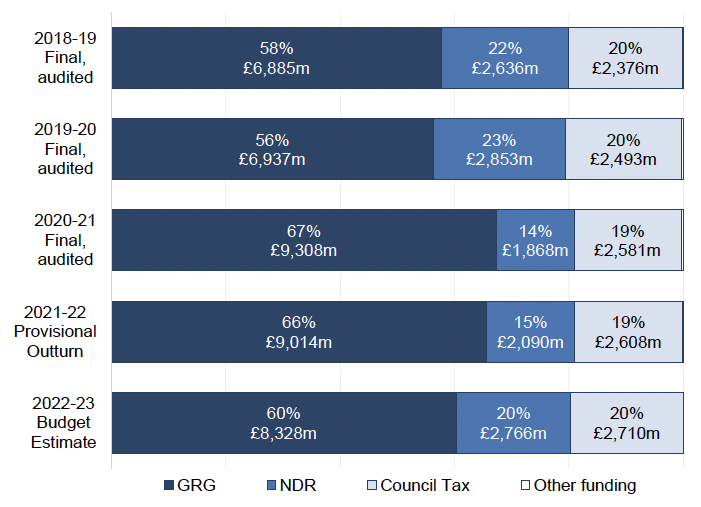
GRG is paid to local authorities by the SG and includes UK Government monies payable to a local authority. The SG guarantees the combined sum of GRG and NDR funding for local authorities in each financial year. There was a significant reduction in NDR in 2020-21 and 2021-22 due to rates relief to support various sectors during the COVID-19 pandemic. GRG figures for these years reflect an increase to match the decrease in NDR, as well as significant amounts of COVID-19 specific funding. Budget estimates for 2022-23 indicate a return to the pre-pandemic composition of General Funding, with GRG and NDR accounting for 60 and 20 per cent respectively, compared to 56 and 23 per cent in 2019-20.
More information on the process to determine local government funding from the SG is available in the Local Government Funding: Process Overview publication. Detailed funding figures per local authority are available in the latest Local Government Finance Circulars.
A surplus occurs when a local authority's revenue expenditure is less than the amount of general funding received. A surplus is added to a local authority's reserves and carried forward to the next year. A deficit occurs when a local authority's revenue expenditure is more than the amount of general funding received. Any deficit must be met from a local authority's reserves. Table 1 shows the surplus / deficit, in addition to the total movement in general fund reserves.
Table 1: Movement in General Fund Reserves from 2020-21 to 2022-23, £ millions
Please note that level of reserves held at 1 April and 31 March exclude amounts relating to unrealised gains that are included in revenue reserves in statutory Annual Accounts applying IFRS 9: Financial Instruments.
Source: POBE 2022 Return, LFR A0, LFR 23
| 2020-21 Final, audited |
2021-22 Provisional Outturn |
2022-23 Budget Estimates |
|
|---|---|---|---|
| Balance at 1 April | 1,598 | 2,716 | 2,681 |
| Net Revenue Expenditure | -11,679 | -12,715 | -12,954 |
| Other Income (+) and Expenditure (-) | -1,037 | -1,113 | -1,132 |
| General Funding | 13,814 | 13,726 | 13,809 |
| Surplus (+) or Deficit (-) on provision of services | 1,097 | -102 | -277 |
| Net movements in (+) or out (-) due to transfers between reserves | -1 | 7 | 27 |
| Increase (+) or decrease (-) in IFRS 9 unrealised gains to be excluded | -22 | -59 | 49 |
| Balance at 31 March | 2,716 | 2,681 | 2,382 |
Across all local authorities, the provisional outturn figures give a deficit of £102 million for 2021-22, a notable change from the significant surplus of £1,097 million seen in 2020-21. The 2020-21 surplus was largely attributed to unspent additional COVID-19 funding from the SG, confirmed to be paid via GRG on 18 March 2021, that was carried forward in local authorities' General Fund reserve for use in future years. Local authorities' have budgeted for a deficit of £277 million in 2022-23, a small increase on the deficit expected in 2021-22.
The General Fund balance across local authorities at 31 March 2022 was £2,681 million, a small decrease from the balance of £2,716 million at 31 March 2021. Local authorities' budgets give a further decrease in the General Fund balance to £2,382 million at 31 March 2023.
Contact
Email: lgfstats@gov.scot