International analysis of child poverty – ukmod/euromod modelling
Studying the drivers underlying differences between Scottish child poverty rates and those of European comparator countries. Focussing on demographics, the labour market and the tax-benefit system. This is linked to companion qualitative studies for these comparator countries.
3. Descriptive evidence
Background statistics for the countries of interest are displayed in this section.
The full population poverty rate (fig. 3.1) shows the role of the tax and benefits system in off-setting poverty rates. In all countries and time periods, measures of poverty are appreciably higher when evaluated on (pre-tax and benefit) original incomes as compared to disposable incomes, by around 20 percentage points.
The child poverty rates (fig 3.2) show that child poverty evaluated on original income falls across time in all countries, with poverty evaluated on disposable income also falling in Croatia and Slovenia. In contrast, the poverty rate evaluated on disposable incomes rose in the UK and Scotland, indicating that the effectiveness of tax and benefit policies in reducing child poverty in the UK and Scotland reduced over time. The decomposition analysis in section 4 further explores the respective roles played by the labour market and transfer policy on child poverty rates.
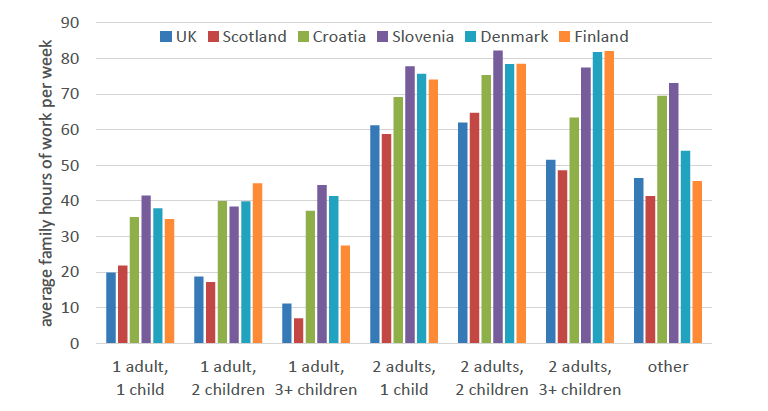
Statistics reported for labour hours in Table 3.1 indicate that comparator country families work more hours per week on average than families in Scotland or the UK. This holds true across both number of adults and number of children in the family. Given that employment rates are similar in Scotland and comparator countries this highlights the importance of differences in how much families work, rather than whether they work at all.
This section reports a series of background statistics underlying the study. Statistics for comparator countries are reported only for the respective years of interest (Finland and Denmark: 2024; Slovenia and Croatia: 2011 and 2024).
Figure 3.1 reports poverty rates for the full (survey) population of each country in each year considered for analysis (plus the UK). Poverty rates are reported based on three alternative measures of income: original income[11], disposable income before housing costs (BHC), and disposable income after housing costs (AHC). The first two of these income measures are explored in subsequent sections of this report, and disposable income AHC is of interest more generally. Poverty lines are evaluated separately for each income measure, and as noted previously poverty lines for Scotland are evaluated from Scottish data only.
A clear feature of Figure 3.1 is the role of tax and benefit systems in offsetting poverty rates. In all countries and time periods, measures of poverty are appreciably higher when evaluated on original (pre-tax and benefit) incomes than disposable (post-tax and benefit) incomes. The differences between these measures are around 20 percentage points across countries, with poverty rates falling from approximately 35% based on original incomes, to 15% based on disposable incomes.
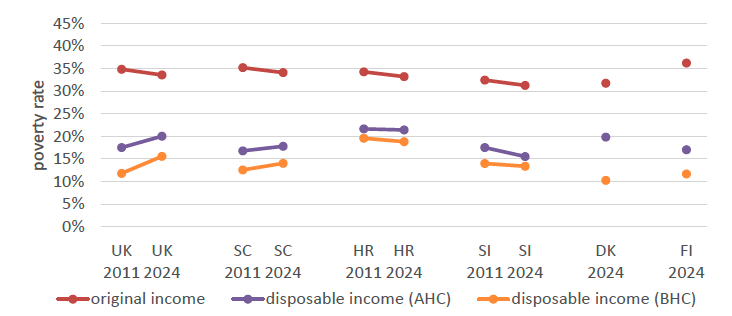
Source: Authors’ calculations on simulated data derived UKMOD (UK and SC) and EUROMOD (HR, SI, DK and FI).
Notes: UK: United Kingdom, SC: Scotland, HR: Croatia, SI: Slovenia, DK: Denmark, FI: Finland. BHC: Before Housing Costs, AHC: After Housing Costs. Poverty rates report portions of survey populations residing in households with equivalised household income below 60% of the median of the respective distribution (distinguished by country, year and income concept). All incomes equivalised using the modified OECD scales. Simulations projected using system years for 2011 and 2024 for all countries. Data for UK and Scotland projected from input data for 2012 and 2022 derived from the Family Resources Survey (FRS). Data for all other countries projected from input data for 2012 and 2019 derived from the European Union Survey of Income and Living Conditions (EU-SILC). See Appendix A.1 for further detail.
Furthermore, poverty rates tend to be slightly higher when evaluated on disposable income AHC than BHC. In Scotland, Croatia and Slovenia differences between poverty rates are approximately 2 to 3 percentage points higher when measured on an AHC basis. In the UK and Finland, they are approximately 6 percentage points higher, and in Denmark, they are approximately 10 percentage points higher. These international differences reflect variation in both the scale of housing costs and the way that such costs vary across the income distribution.
The cross-country variation in the influence of housing costs on poverty measures noted above, and recognition of the difficulties in obtaining internationally comparable measures of housing costs, motivates the current focus on BHC measures of disposable income. Nevertheless, a reassuring feature of the statistics reported in Figure 3.1 is that differences within countries between BHC and AHC measures of poverty vary little over time. This suggests that analyses of differences in BHC poverty rates are likely to be relevant to AHC poverty as well.
Interestingly, overall poverty rates evaluated on disposable incomes for the UK and Scotland are reported to increase between 2011 and 2024, despite the (slight) fall in poverty rates evaluated on original incomes. In contrast, overall poverty rates evaluated on disposable incomes fell for Croatia and Slovenia, approximately in line with the associated falls based on original incomes.
Figure 3.2 extends the analysis by focussing on rates of child poverty. This shares some important features with the statistics discussed above. In both Figure 3.1 and 3.2, poverty rates evaluated on original incomes exceed those evaluated on disposable incomes, highlighting the redistributive effects of tax and benefit payments. Furthermore, poverty rates are found to be exaggerated by housing costs, pointing to the fact that housing costs tend to be higher as a proportion of income among the poor. In all countries where time-series data are provided, poverty rates evaluated on original income fall with time. Furthermore, whereas child poverty rates evaluated on disposable incomes for Croatia and Slovenia are reported to fall in line with rates evaluated on original incomes, they rise for Scotland and the UK.
Nevertheless, there are pronounced differences between the child poverty rates reported in Figure 3.2 and the overall poverty rates reported in Figure 3.1. Perhaps most surprising is that poverty rates for all three measures of income vary relatively little in Croatia and Slovenia, and to a lesser degree Finland and Denmark. In the UK and Scotland, by contrast, the differences are much larger. This could reflect a range of labour market features, including employment rates, hours worked, and wage rates, in addition to welfare support provisions for lower income families. The analysis in subsequent sections of this report sheds more light on associated drivers.
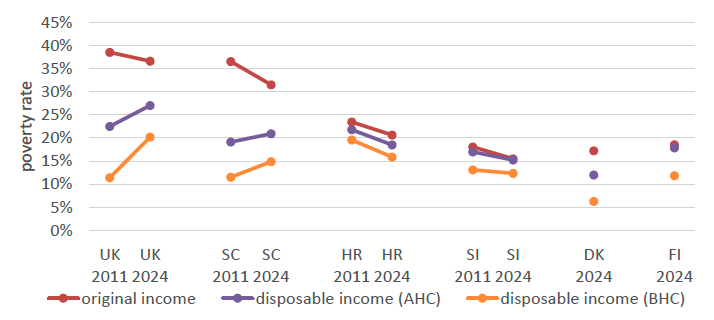
Notes: See Figure 3.1.
Another stark difference between Figures 3.1 and 3.2 is the relatively strong rise in child poverty rates reported for the UK between 2011 and 2024. Specifically, child poverty rates evaluated on disposable income BHC almost doubled from 11% to 21% over the reported period in the UK, whereas overall poverty rates increased from 11% to 16%. The associated variation reported for Scotland is more muted, with child poverty rates evaluated on disposable income BHC increasing from 12% to 17%. This muted increase in child poverty in Scotland, relative to the UK, could be attributed to both variation of respective labour incomes (poverty rates on original income fell by 2% over the sample period in the UK and by 5% in Scotland) and to coincident policy variation. The decomposition analysis reported in the remainder of this paper is designed to identify the respective roles played by labour market and transfer policy underlying the poverty statistics reported here.
On our key metric of disposable income BHC, Slovenia, Finland and Denmark all maintained a lower poverty rate than Scotland or the UK in 2024. Croatia by contrast displays an end-of-period child poverty rate similar to Scotland. But in the case of Croatia, child poverty is reported to have fallen from 22% in 2011 to 19% in 2024 whereas in Scotland it rose from 17% in 2011 to 20% in 2024.
Additional disaggregations of poverty rates distinguished by various population sub-groups including household types, priority family status, age of parents and children, educational levels, employment status, and housing tenure are reported in the Statistical Annex.
| Family type | UK 2011 | UK 2024 | SC 2011 | SC 2024 | HR 2011 | HR 2024 | SI 2011 | SI 2024 | DK 2024 | FI 2024 |
|---|---|---|---|---|---|---|---|---|---|---|
| 1 adult, 1 child | 16.8 | 19.8 | 17.7 | 21.8 | 26.0 | 35.4 | 34.8 | 41.5 | 37.9 | 34.8 |
| 1 adult, 2 children | 14.8 | 18.7 | 13.4 | 17.2 | 34.4 | 40.0 | 38.2 | 38.4 | 39.9 | 44.9 |
| 1 adult, 3+ children | 6.5 | 11.1 | 11.0 | 7.0 | 46.7 | 37.2 | 26.9 | 44.5 | 41.3 | 27.4 |
| 2 adults, 1 child | 57.3 | 61.2 | 60.0 | 58.8 | 59.5 | 69.1 | 71.3 | 77.7 | 75.7 | 74.1 |
| 2 adults, 2 children | 55.5 | 61.9 | 56.4 | 64.8 | 64.8 | 75.3 | 75.2 | 82.2 | 78.4 | 78.5 |
| 2 adults, 3+ children | 46.5 | 51.5 | 48.8 | 48.6 | 49.8 | 63.4 | 69.7 | 77.5 | 81.8 | 82.1 |
| other | 47.6 | 46.4 | 44.5 | 41.3 | 54.7 | 69.5 | 55.9 | 73.1 | 54.0 | 45.5 |
Source: Authors’ calculations on input data for UKMOD (UK and Scotland) and EUROMOD (Croatia, Slovenia, DK and FI).
Notes: UK: United Kingdom, SC: Scotland, HR: Croatia, SI: Slovenia, DK: Denmark, FI: Finland. All financial statistics uprated to 2024 prices as per UKMOD/EUROMOD modelling assumptions. Data for UK and Scotland derived from the Family Resources Survey (FRS) for 2012 and 2022. Data for all other countries use input data reported by the European Union Survey of Income and Living Conditions (EU-SILC) for 2012 and 2019. See Appendix A.1 for further detail. “other” demographic category reports statistics for families with no dependent children.
| Age of children | UK 2011 | UK 2024 | SC 2011 | SC 2024 | HR 2011 | HR 2024 | SI 2011 | SI 2024 | DK 2024 | FI 2024 |
|---|---|---|---|---|---|---|---|---|---|---|
| 0-2 years | 46.0 | 51.9 | 44.0 | 51.9 | 69.9 | 83.9 | 72.4 | 79.0 | 71.5 | 64.1 |
| 3-6 years | 45.7 | 51.6 | 43.5 | 50.2 | 64.8 | 77.6 | 74.0 | 76.4 | 69.1 | 67.3 |
| 7-13 years | 47.5 | 52.4 | 50.4 | 56.5 | 61.0 | 74.9 | 71.8 | 80.5 | 71.0 | 76.0 |
| 14-17 years | 55.0 | 54.5 | 57.6 | 58.7 | 65.0 | 78.7 | 75.0 | 95.9 | 87.1 | 89.8 |
Notes: See Table 3.1 for source and notes.
| Employment rate by age | UK 2011 | UK 2024 | SC 2011 | SC 2024 | HR 2011 | HR 2024 | SI 2011 | SI 2024 | DK 2024 | FI 2024 |
|---|---|---|---|---|---|---|---|---|---|---|
| 16-24 years | 41.5 | 42.4 | 43.5 | 46.4 | 19.3 | 28.3 | 13.5 | 19.7 | 24.4 | 24.8 |
| 25-34 years | 71.5 | 75.5 | 74.5 | 78.0 | 61.0 | 69.6 | 69.0 | 75.3 | 64.2 | 64.4 |
| 35-49 years | 70.0 | 71.9 | 72.7 | 70.9 | 58.0 | 70.0 | 75.6 | 79.9 | 76.2 | 72.6 |
| 50-64 years | 55.5 | 57.9 | 55.3 | 56.1 | 32.5 | 41.1 | 34.1 | 49.0 | 70.5 | 56.9 |
| 65+ years | 5.4 | 6.9 | 4.0 | 5.8 | 0.3 | 0.5 | 0.2 | 0.4 | 4.0 | 1.5 |
Notes: See Table 3.1 for source and notes.
| Wages at 50th percentile | UK 2011 | UK 2024 | SC 2011 | SC 2024 | HR 2011 | HR 2024 | SI 2011 | SI 2024 | DK 2024 | FI 2024 |
|---|---|---|---|---|---|---|---|---|---|---|
| 16-24 years | 975 | 1856 | 860 | 1493 | 267 | 622 | 160 | 238 | 646 | 570 |
| 25-34 years | 1771 | 2689 | 1595 | 2689 | 573 | 966 | 972 | 1567 | 3010 | 2370 |
| 35-49 years | 1869 | 2914 | 1822 | 2952 | 637 | 1117 | 1190 | 1958 | 4302 | 3078 |
| 50-64 years | 1685 | 2512 | 1732 | 2521 | 661 | 1032 | 955 | 1687 | 4025 | 2886 |
Notes: See Table 3.1 for source and notes.
| Wage dispersion | UK 2011 | UK 2024 | SC 2011 | SC 2024 | HR 2011 | HR 2024 | SI 2011 | SI 2024 | DK 2024 | FI 2024 |
|---|---|---|---|---|---|---|---|---|---|---|
| 25th percentile | 971 | 1665 | 945 | 1660 | 383 | 672 | 378 | 857 | 1265 | 1216 |
| 50th percentile | 1642 | 2569 | 1617 | 2583 | 590 | 1000 | 957 | 1638 | 3525 | 2578 |
| 75th percentile | 2570 | 3894 | 2519 | 3765 | 875 | 1485 | 1480 | 2407 | 4639 | 3575 |
| Ratio: 50th to 25th | 1.69 | 1.54 | 1.71 | 1.56 | 1.54 | 1.49 | 2.53 | 1.91 | 2.79 | 2.12 |
| Ratio: 75th to 25th | 2.65 | 2.34 | 2.67 | 2.27 | 2.28 | 2.21 | 3.92 | 2.81 | 3.67 | 2.94 |
Notes: See Table 3.1 for source and notes. Ratio: XXth to 25th reports the ratio of the XXth percentile for population earnings aged 16 to 64 to the 25th percentile.
Notes: Data for UK and Scotland derived from the Family Resources Survey (FRS) for 2012 and 2022. Data for all other countries use input data reported by the European Union Survey of Income and Living Conditions (EU-SILC) for 2012 and 2019. See Appendix A.1 for further detail. “other” demographic category reports statistics for families with no dependent children.
Table 3.1 reports selected labour market statistics underlying our decomposition analysis. The top panel of the table clearly indicates differences in employment behaviour between the UK and Scotland on the one hand, and the comparator countries on the other. These differences are displayed graphically in Figure 3.3. They indicate that hours of employment are generally lower for all family types in the UK and Scotland, relative to the comparator countries, with differences widening as the number of children increases. These differences are particularly pronounced among single parent households.
Statistics reported for labour hours by child age in Table 3.2 indicate that the differences discussed in the preceding paragraph are not limited to families with young children. Families in the UK and Scotland are reported to supply between 40 and 60 hours per week on average, whereas those in the comparator countries supply between 60 and 100 hours per week (peaking at 96 hours among families with 14 to 17 year old dependent children in 2024 for Slovenia). Higher average working hours in comparator countries among families with older children is however partly due to higher working hours among dependent children, as shown in the technical appendix.
The employment rates reported Table 3.3 indicate that the hours differences discussed above are not driven by differences in employment rate, but rather the hours worked among the employed. Employment rates for all countries reported in the table display a similar pattern, increasing from low levels among the 16 to 24 age group to peak during prime working years at around 70 to 80%, before falling away into retirement.
Differences by gender are nuanced (see Statistical Annex). In Croatia and Slovenia (apart from the 35-49 age class), men work more than women, while in Scotland and Denmark the figures are comparable. Women work more than men in Finland.
A steeper age gradient is reported for median earnings in the comparator countries than in Scotland and the UK, where earnings in the 16 to 24 year age group start relatively low in all comparator countries. Furthermore, Table 3.5 indicates similar monthly wage dispersion in the UK and Scotland. In contrast, monthly wage dispersion is slightly lower in Croatia, and higher in Slovenia, Denmark and Finland.
Additional labour market statistics (on inactivity, unemployment and work hours, and by gender) are reported in the Statistical Annex. As evidenced in the Statistical Annex, Scotland experienced a marked reduction in the gender wage gap between 2011 and 2024 (from 35.2% to 14.1% of men’s pay, at the median wage), bringing it below that of the comparator countries (Croatia: 21.4%; Slovenia: 16.3%; Denmark: 17.1%; Finland: 17.9% - all measured in 2019).[12]
Contact
Email: TCPU@gov.scot