Housing Statistics for Scotland Quarterly Update: New Housebuilding and Affordable Housing Supply (published 28 March 2023)
A summary of activity in new build housing, affordable housing and long term empty properties and second homes in Scotland.
5. Social sector new housebuilding
Social sector housing consists of local authority and housing association housing, and has accounted for around a third (29%) of all new build homes completed over the 12 months to the end of September 2022.
Chart 8a shows the number of local authority and housing association homes started and completed each year to end September. In 2009, the number of housing association completions was 5,700, and fell each year to 2,600 in 2014, after which completions remained relatively steady to 2017, before increasing to almost 4,000 in 2019. Housing association completions then dropped to around 3,300 in 2020, with completions in this year being affected by COVID-19 lockdown measures, before increasing to over 3,900 in the year to end September 2022.
Housing association new build approvals fell between 2009 and 2011 to around 2,300, before remaining relatively steady to 2015 and then trending up to over 5,500 in 2020. Approvals then fell to around 3,000 in 2021, and then again in the year to end September 2022, to just over 2,200.
The number of local authority homes built increased from around 400 homes in 2009 up to just over 1,200 in 2012 (years to end September). Completions then remained stable until 2016, then increased to almost 1,500 in 2019. Completions fell to almost 1,100 in 2020 before increasing to almost 2,000 in 2021 and then just over 2,800 in the year to end September 2022. Local authority new build starts have followed a generally similar pattern to that of completions, although the number of starts in the latest year is lower at around 1,900 in 2022.
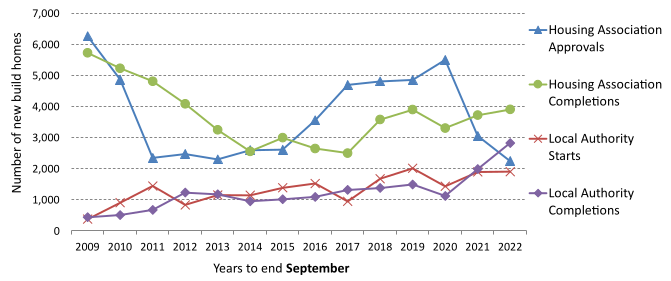
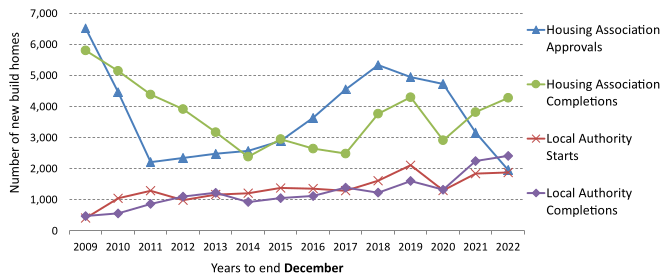
Chart 8b below shows the same figures but for years to end December.
| Social sector homes | Total Social starts | Total Social completions | Local authority starts | Local authority completions | Housing association approvals | Housing association completions |
|---|---|---|---|---|---|---|
| Jul - Sep 2019 | 1,299 | 1,300 | 553 | 392 | 746 | 908 |
| Jul - Sep 2020 | 730 | 1,011 | 246 | 464 | 484 | 547 |
| Jul - Sep 2021 | 1,088 | 1,649 | 220 | 487 | 868 | 1,162 |
| Jul - Sep 2022 | 803 | 2,119 | 439 | 810 | 364 | 1,309 |
| Change | -285 | 470 | 219 | 323 | -504 | 147 |
| Change (%) | -26% | 29% | 100% | 66% | -58% | 13% |
| Year to Sep-19 | 6,880 | 5,401 | 2,018 | 1,496 | 4,862 | 3,905 |
| Year to Sep-20 | 6,949 | 4,442 | 1,438 | 1,128 | 5,511 | 3,314 |
| Year to Sep-21 | 4,958 | 5,722 | 1,899 | 1,993 | 3,059 | 3,729 |
| Year to Sep-22 | 4,152 | 6,745 | 1,910 | 2,833 | 2,242 | 3,912 |
| Change | -806 | 1,023 | 11 | 840 | -817 | 183 |
| Change (%) | -16% | 18% | 1% | 42% | -27% | 5% |
A total of 2,119 social sector new build homes were completed between July to September 2022, an increase of 29% (470 homes) on the same quarter in 2021. This brings the total completions for the 12 months to end September 2022 to 6,745, an increase of 18% (1,023 homes) on the 5,722 social sector new build homes completed in the previous year.
Meanwhile, 803 social sector new build homes were started between July to September 2022. This is 26% (285 homes) lower than the same quarter the previous year. This brings the total for the 12 months to end September 2022 to 4,152 a decrease of 16% (806 homes) on the 4,958 social sector homes started in the same period in 2021.
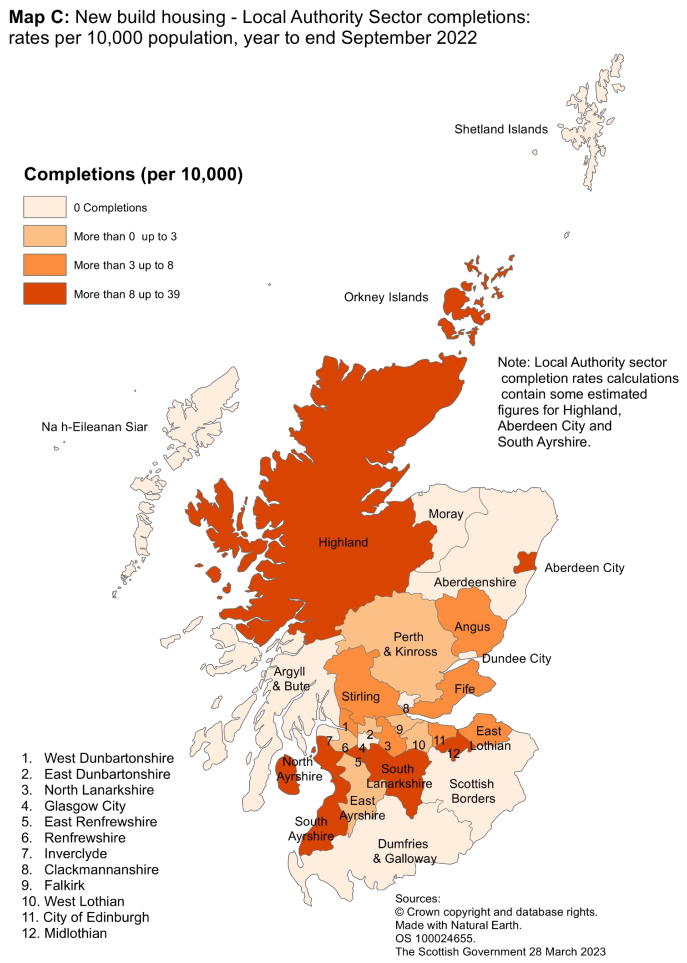
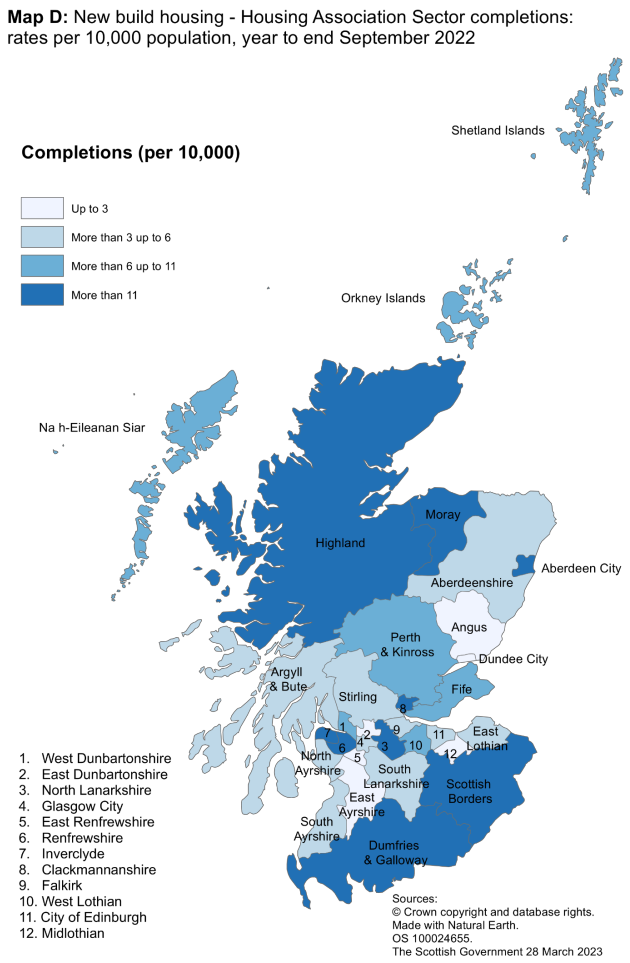
Maps C and D show the rates of housing association and local authority new build completions in each local authority area for the year to end September 2022 per 10,000 of the population. Note that the housing stock of 6 local authorities (Argyll & Bute, Dumfries & Galloway, Glasgow, Inverclyde, Na h-Eileanan Siar and Scottish Borders) has been transferred to housing associations and so these areas do not build new local authority houses.
In the year to end September 2022 local authority sector new build rates were highest in Aberdeen City, North Ayrshire, Orkney Islands, Midlothian, Highland, East Renfrewshire, South Lanarkshire, and South Ayrshire with all having rates of over 8 homes per 10,000 households.
As well as the 6 stock transfer authorities mentioned above, Aberdeenshire, Clackmannanshire, Dundee City, Moray, and Shetland Islands built no new local authority sector homes in the year ending September 2022. East Dunbartonshire, West Lothian, East Ayrshire, Renfrewshire, Perth & Kinross and Falkirk all had a rate of less than 3 homes built per 10,000 households.
Meanwhile rates of housing association new build completions were highest in Inverclyde, Moray, Dumfries & Galloway, Renfrewshire, North Lanarkshire, Aberdeen City,Scottish Borders, Highland, and Clackmannanshire with all having rates of over 11 homes per 10,000 households.
Dundee City, East Ayrshire, Midlothian, East Dunbartonshire, East Renfrewshire, and Angus all had a rate less than 3 homes per 10,000 households.
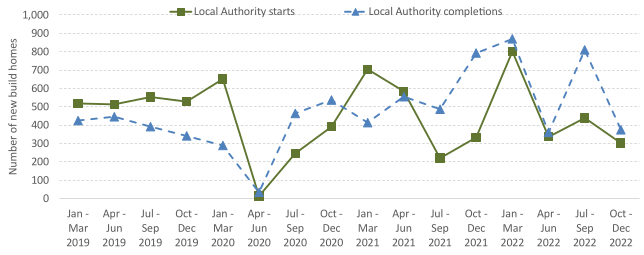
Charts 9 and 10 along with Table 5 show the latest quarterly figures for housing associations and local authorities to end December 2022.
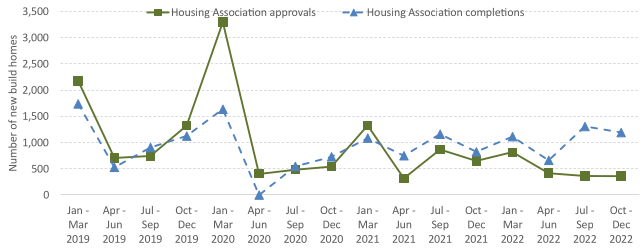
A total of 1,546 social sector new build homes were completed between October to December 2022, a decrease of 4% (72 homes) on the 1,618 completions in the same quarter in 2021. This brings the total completions for the 12 months to end December 2022 to 6,673, an increase of 10% (600 homes) on the 6,073 social sector new build homes completed in the previous year.
Meanwhile, 664 social sector new build homes were started between October to December 2022. This is a decrease of 33% (320 homes) compared to the same quarter in the previous year. This brings the total for the 12 months to end December 2022 to 3,832, a decrease of 23% (1,175 homes) on the 5,007 social sector homes started in the same period in 2021.
In the year to end December 2022, housing association new build completions are up by 11% (434 homes), local authority new build completions are up by 7% (166 homes) and local authority new build starts have increased slightly by 2% (38 homes), whilst housing association new build approvals are down by 38% (1,213 homes).
| Social sector homes | Total Social starts | Total Social completions | Local authority starts | Local authority completions | Housing association approvals | Housing association completions |
|---|---|---|---|---|---|---|
| Oct - Dec 2019 | 1,853 | 1,469 | 528 | 341 | 1,325 | 1,128 |
| Oct - Dec 2020 | 935 | 1,267 | 391 | 537 | 544 | 730 |
| Oct - Dec 2021 | 984 | 1,618 | 333 | 793 | 651 | 825 |
| Oct - Dec 2022 | 664 | 1,546 | 302 | 375 | 362 | 1171 |
| Change | -320 | -72 | -31 | -418 | -289 | 346 |
| Change (%) | -33% | -4% | -9% | -53% | -44% | 42% |
| Year to Dec-19 | 7,066 | 5,909 | 2,112 | 1,604 | 4,954 | 4,305 |
| Year to Dec-20 | 6,031 | 4,240 | 1,301 | 1,324 | 4,730 | 2,916 |
| Year to Dec-21 | 5,007 | 6,073 | 1,841 | 2,249 | 3,166 | 3,824 |
| Year to Dec-22 | 3,832 | 6,673 | 1,879 | 2,415 | 1,953 | 4,258 |
| Change | -1,175 | 600 | 38 | 166 | -1,213 | 434 |
| Change (%) | -23% | 10% | 2% | 7% | -38% | 11% |