Housing Revenue Account (HRA) statistics: local authority housing income and expenditure 1997-1998 to 2019-2020 (near actuals) and 2020-2021 (budgeted estimates)
This annual publication provides information on trends in the balance of HRA housing income and expenditure; the amount Scottish councils earned from housing and other council stock, how they spent this income and whether there was a surplus or deficit at year end.
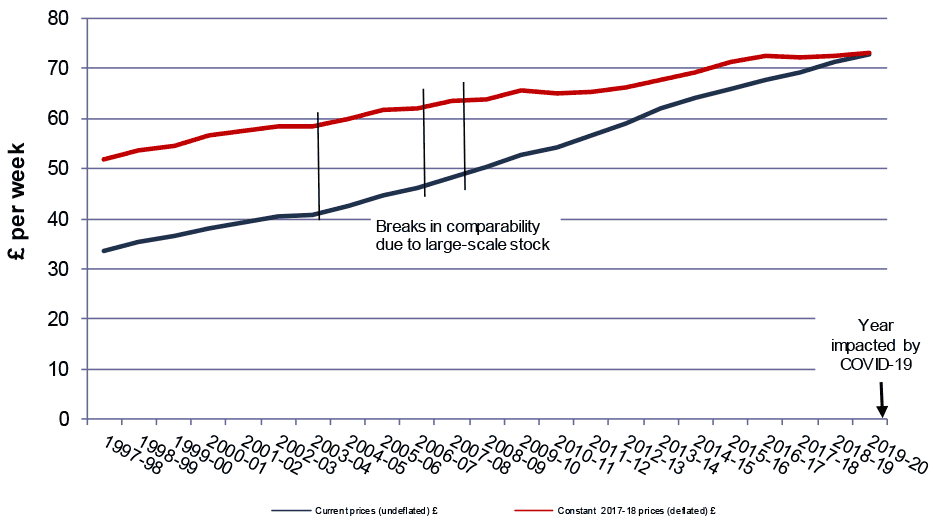
Rent levels and income from rents (charts 3 & 4) (tables 1a, 8 & 9)
19. In 2019-20 of the 26 Local Authorities with their own housing stock raised a total of £1.2bn in income (net of losses from empty properties) from standard rents on dwellings and a further £26m in rent from other HRA properties such as garages.
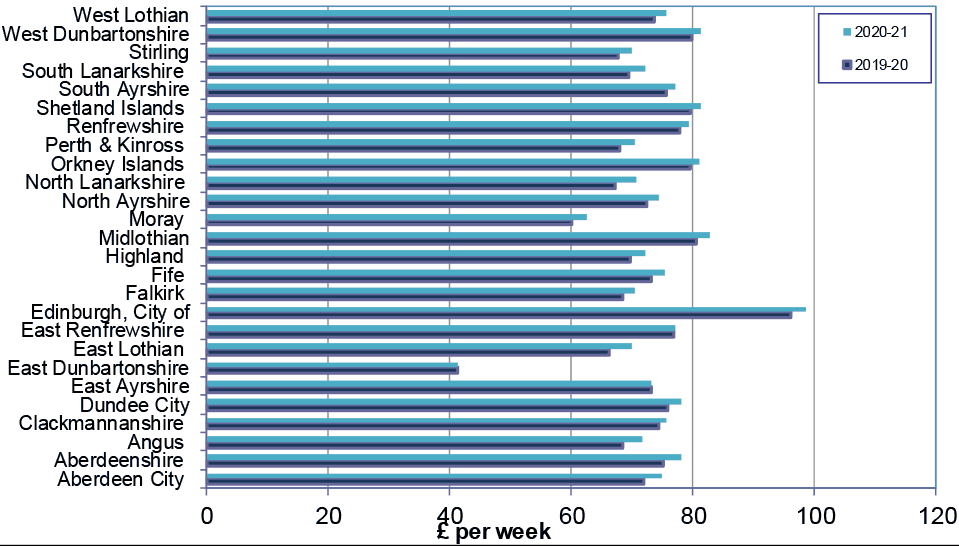
20. The average rent per dwelling (including both let and un-let properties) was £73.29 per week in 2019-20[3] an increase of £1.90 since 2018-19. In the decade since 20010-11 average rents have increased by just under £8 or 12% in real terms i.e. over and above general inflation. In 2019-20 there is variation between councils in average rents, from £60 per week in Moray to £96 per week in the City of Edinburgh.
21. These figures may be lower than rents reported in other publications[4] as, rather than taking a weighted average of set rents charged to tenants, they instead reflect the amount earned by the council in respect of each property owned (calculated by dividing the Council's Standard Rental Income on houses by the total letting stock). This method takes into account the proportion of housing which spends some time un-let and those for which rent is not successfully collected.
22. Housing Benefit accounted for a high proportion of council rental income. In 2019-20, rent rebate subsidy for council house tenants was £492m, representing 41% of total income from standard rents. In 2019-20, rent rebate subsidy as a proportion of standard rents varied from 27% in the Shetland Islands to 62% in South Ayrshire.
Source:
Current prices: Scottish Government, Communities Analytical Division - based on Housing Revenue Account return provided by Scottish Local Authorities. Constant prices: ONS Consumer Price All Items Index on which 2015 = 100.
Notes:
1. Six councils transferred their housing stock to the housing association sector, therefore HRA information is not available.
2. Vertical lines indicate breaks in comparability following transfer of housing stock as follows:
- from 2003-04 transfer of housing stock from Glasgow City, Dumfries and Galloway and Scottish Borders,
- from 2006-07 transfer of housing stock from Argyll and Bute and Na h-Eileanan Siar,
- from 2007-08 transfer of housing stock from Inverclyde.
3. Current (or nominal) prices are in the value of currency for that particular year. Current price are affected by inflation. Constant (or real) prices adjust for the effects of inflation and used to measure the true growth of a time series. Constant prices have been deflated using the Consumer Price Index (by ONS).
4. This calculation includes both let and un-let properties and therefore the amount of rent actually paid by is likely to be slightly higher.
5. Figures for 2019-20 may have been impacted on by the COVID-19 Pandemic restrictions. Consideration should be given to the impact of these restrictions when making any comparisons with other years.
Source: Scottish Government, Communities Analytical Services Division - based on Housing Revenue Account return provided by Local Authorities.
Notes:
1. Six councils transferred their housing stock to the housing association sector, therefore HRA information is not available for them.
2. Figures for 2019-2020 and 2020-2021 may have been impacted on by the COVID-19 Pandemic restrictions. Consideration should be given to the impact of these restrictions when making any comparisons with other years and between local authorities.
Contact
Email: chma@gov.scot