Scottish Budget 2023-24: high level carbon assessment
Estimate of the consumption-based carbon emissions associated with planned budget expenditure.
2. High-level Carbon Assessment of 2023-24 Budget
2.1. Portfolio Expenditure and Associated Emissions
17. Total estimated emissions attributable to the 2023-24 Budget are 8.8 Mt CO2-equivalent. Table 2 shows overall spend and emissions by the individual portfolios and how these emissions arise. Emissions remain broadly proportional to spend, except for Rural Affairs and Islands, where emissions per unit of spend are slightly higher. Social Justice, Housing and Local Government, as well as Health and Social Care are the largest Budget items, with the highest emissions.
18. Expenditure is shown net of income, in line with the Budget, and emissions are calculated on that basis.[4]
19. Direct emissions account for 33 per cent of the total; indirect emissions for a further 19 per cent. Around 48 per cent of emissions attributable to Budget expenditure are generated outside Scotland and are embedded in imported goods and services.
2.2. Emissions by Industry Source
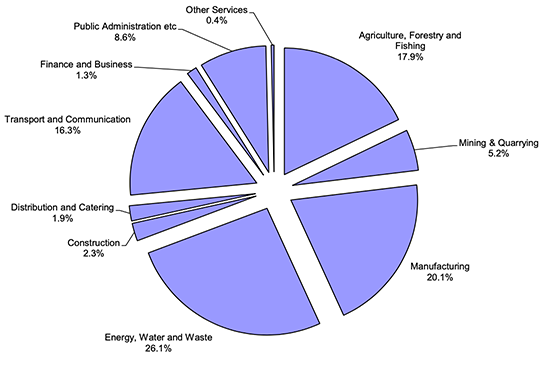
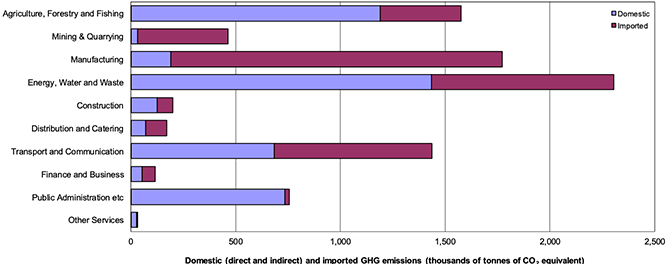
20. Total emissions broken down by industry are shown in Figure 1. Some 26 per cent of the Scottish Government's carbon footprint is caused by the use of Energy, Water and Waste, followed by Manufacturing (20 per cent) and Agriculture, Forestry and Fishing (18 per cent).
2.3. Domestic and Imported Emissions
21. In addition to direct and indirect domestic emissions, the assessment takes into account the emissions generated outside of Scotland in the production of imported goods purchased as a result of Government spending (e.g. food, machinery, IT equipment).
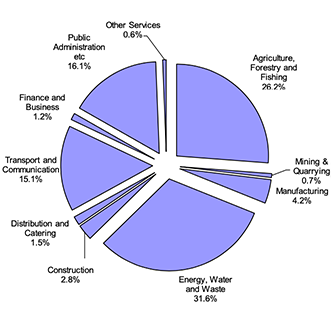
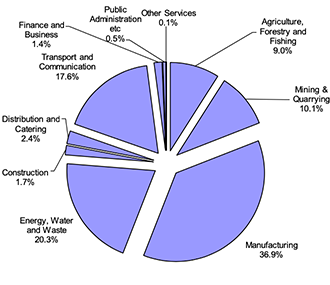
22. Figure 2c demonstrates that imported emissions make up around a half of emissions from Budget spend. There is however a difference between the sources of domestic and imported emissions. Expenditure on Energy, Water and Waste accounts for the largest share of domestic emissions (followed by Agriculture, Forestry and Fishing), while expenditure on Manufacturing generates the largest share of imported emissions (followed by Energy, Water and Waste).
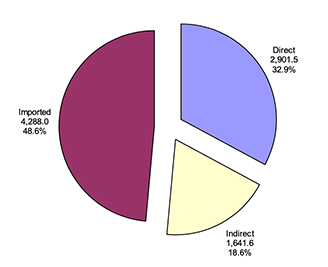 CO2 equivalent). Direct domestic emissions are the next largest, accounting for around 32.9% of emissions (2,901.5 thousand tonnes of
CO2 equivalent) Indirect domestic emissions are the smallest share of emissions, accounting for 18.6% of emissions (1,641.6 thousand tonnes of
CO2 equivalent) ">
CO2 equivalent). Direct domestic emissions are the next largest, accounting for around 32.9% of emissions (2,901.5 thousand tonnes of
CO2 equivalent) Indirect domestic emissions are the smallest share of emissions, accounting for 18.6% of emissions (1,641.6 thousand tonnes of
CO2 equivalent) ">
Contact
Email: sasha.maguire@gov.scot