Gypsy/Travellers in Scotland - A Comprehensive Analysis of the 2011 Census
This report brings together analysis previously published to provide a comprehensive and wide ranging evidence base on Scotland’s Gypsy/Travellers. It presents analysis of key areas such as health, education, housing, transport and economic indicators to reveal important information on the lives and life chances of Gypsy/Travellers.
2. Identity, Language and Religion
In 2011 Gypsy/Travellers in Scotland, compared to the population as a whole, were more likely to have lower skills in English language and more likely to speak other languages at home.
The following analysis shows how the national identity and religion of Gypsy/Travellers compares to that of the Scottish population as a whole. It also shows how the language skills of the group compare to the rest of the population. Gypsy/Travellers had lower levels of English language skills and this could have a negative impact on life chances.
Chart 3: Gypsy/Travellers by National Identity, Scotland, 2011

Chart 3 and Table 1 show that two thirds (66 per cent) of Gypsy/Travellers in Scotland identified their national identity as ‘Scottish only’. The next most common category (11 per cent) was ‘Other identity’ i.e. those that exclude UK national identities.
Table 1: National Identity of Gypsy/Travellers compared to all people in Scotland, 2011[8]
| White: Gypsy/Traveller |
All people |
Difference |
|
|---|---|---|---|
| Scottish identity only |
66% |
62% |
+4% |
| Scottish and British identities only |
7% |
18% |
-11% |
| Scottish and any other identities |
3% |
2% |
+1% |
| British identity only |
7% |
8% |
-1% |
| English identity only |
4% |
2% |
+1% |
| Any other combination of UK identities (UK only) |
2% |
2% |
0% |
| Other identity and at least one UK identity |
0% |
0% |
0% |
| Other identity only |
11% |
4% |
+7% |
Table 1 also shows the differences between Gypsy/Travellers and the Scottish population. A slightly higher proportion of Gypsy/Travellers identified as ‘Scottish only’. Gypsy/Travellers were more likely to identify as ‘Other identity only’ and less likely to identify as ‘Scottish and British’.
Chart 4: Gypsy/Travellers by Country of Birth, Scotland, 2011

Chart 4 shows that Scotland was the most common country of birth for Gypsy/Travellers in 2011 (76 per cent), followed by England (11 per cent).
However, a lower proportion of Gypsy/Travellers were born in Scotland than the population as a whole (76 per cent compared to 83 per cent). Six per cent of Gypsy/Travellers were born in EU Accession countries; this compared to only one per cent of the population as a whole.
Chart 5: Gypsy/Travellers by age of arrival in UK, Scotland, 2011
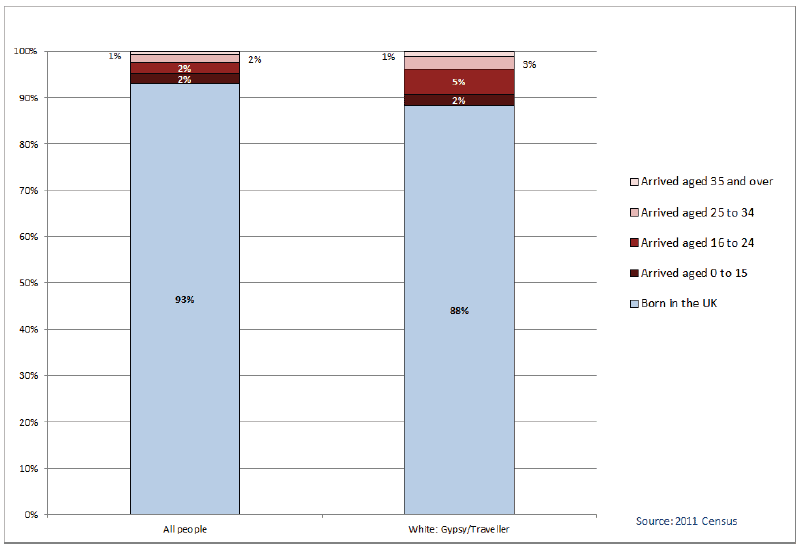
Chart 5 shows that Gypsy/Travellers were more likely to have been born outside of the UK than the general population (12 per cent compared to 7 per cent).
The largest difference was amongst the 16-24 age group where 5 per cent of Gypsy/Travellers were aged 16-24 when they arrived in the UK compared to only 2 per cent of the general population.
Chart 6: Gypsy/Travellers by English Language Skills, Scotland, 2011

Chart 6 shows that English language skills for Gypsy/Travellers aged 3 and over were generally lower than for the population as a whole. Only 83 per cent of Gypsy/Travellers could speak, read and write English compared to 94 per cent of the whole population. A further 16 per cent of Gypsy/Travellers had some skills in English, however. Less than 1 per cent of Gypsy/Travellers had no skills in English.
Chart 7: Gypsy/Travellers by English Language Proficiency, Scotland, 2011

Gypsy/Travellers were less proficient in spoken English than the population as a whole with only 93 per cent able to speak English ‘well’ or ‘very well’ compared to 99 per cent of the whole population aged 3 and over. Seven per cent of Gypsy/Travellers spoke English ‘not well’ or ‘not at all’ compared to only 1 per cent of the whole population.
Chart 8: Gypsy/Travellers by Language Used at Home, Scotland, 2011

Gypsy/Travellers aged 3 and over were more likely to use languages other than English at home. Eighteen per cent used languages other than English compared to 7 per cent of the population. Four per cent of Gypsy/Travellers used Polish at home compared to 1 per cent of the population. One in ten used ‘other’ languages, where numbers were too small to report on separately.
Chart 9: Gypsy/Travellers by Religion, Scotland, 2011

Chart 9 shows that around half of Gypsy/Travellers stated their religion to be a Christian denomination (‘Church of Scotland’, ‘Roman Catholic’ and ‘Other Christian’) and over a third (37 per cent) stated that they had no religion. Five per cent reported an ‘Other’ religion (which included ‘Buddhist’, ‘Muslim’, ‘Jewish’, ‘Sikh’ and ‘Hindu’ amongst others).
Table 2: Religion of Gypsy/Travellers compared to all people in Scotland, 2011[9]
| White: Gypsy/Traveller |
All People |
Percentage point difference |
|
|---|---|---|---|
| No religion |
37% |
37% |
0% |
| Church of Scotland |
19% |
32% |
-13% |
| Roman Catholic |
16% |
16% |
0% |
| Other Christian |
14% |
6% |
+8% |
| Religion not stated |
9% |
7% |
+2% |
| Other religion |
5% |
3% |
+3% |
Table 2 shows the differences between the religion of Gypsy/Travellers and the Scottish population as a whole. Gypsy/Travellers were much less likely to identify as ‘Church of Scotland’ and much more likely to identify as ‘Other Christian’.
Contact
Email: Mhairi Wallace