Green Heat Finance Taskforce: report part 1 - November 2023
The independent Green Heat Finance Taskforce, has identified a suite of options which will allow individual property owners to access finance to cover the upfront costs for replacing polluting heating with clean heat solutions in the manner best suited to their own individual circumstances.
9. Annex 3: Market Structure Overview
9.1 Domestic Buildings
There are over 2.5 million domestic properties in Scotland[48] and while they comprise a range of different buildings, their ownership can be classified as social housing, owner occupied or privately rented. Figure 9-1 below sets out the number of buildings falling into each ownership category, as well as the energy efficiency rating for each ownership type.

The figures show that owner occupied housing accounts for around 66% of all domestic buildings in Scotland, approximately 50% of which have an energy efficiency rating of C or better. While accounting for under approximately 12% of total domestic building stock, privately rented buildings echo the proportionate splits in energy efficiency shown by owner occupied buildings. However, there are likely to be differences in approaches required to encourage these two sectors to invest in ZDEH and energy efficiency as the barriers for the private rented sector are not all the same as for owner occupiers (see section 4.2.4 for discussion around split incentives).
In contrast, social housing, which accounts for around a 25% of total domestic buildings, has around 65% of its stock rated C or better for energy efficiency and only 6% which is E or lower.

Figure 9-2 highlights the fact that 80% of homes are on mains gas, with electricity being a distant second as a primary source of heating, accounting for 11% of properties. The remaining fuel types make up the final 9% with oil being the most prevalent at 6% (mostly in rural settings where there is no mains gas available). There is therefore a compelling case for focusing on properties connected to the gas network, as converting these properties to ZDEH will have the biggest impact on overall targets. We recognise the actual technical solution and the financing needs will vary across gas connected properties.
Table 9-1 below shows indicative costs using government-derived data to make domestic buildings energy efficient and install ZDEH, broken down by different ownership types. These are aggregated averages across different types of property ownership and the individual costs will vary based on a range of factors, such as property age and type. Social housing is estimated to require 22% of the total cost for decarbonising heat in domestic buildings, slightly below its 25% share of building stock, although only 15% of the total cost involved with making domestic buildings energy efficient. This indicates that the efforts to and financing of decarbonising buildings, so as to contribute to achieving Net Zero targets, needs to be focused on owner occupiers, which account for both the largest number of buildings and a disproportionately higher level of costs required to decarbonise.
| Decarbonisation costs | Energy Efficiency costs | |||||
|---|---|---|---|---|---|---|
| Total cost (£m) | Mains gas (£m) | Off gas (£m) | Mains gas (£m)2 | Off gas(£m) | Low Carbon fuels (£m) | |
| Owner Occupier | 17,673 | 12,702 | 1,554 | 2,690 | 493 | 234 |
| Private rented | 3,550 | 2,238 | 340 | 679 | 139 | 154 |
| Social Housing | 5,886 | 5,082 | 77 | 600 | 8 | 119 |
| Total | 27,109 | 20,022 | 1,971 | 3,969 | 640 | 507 |
Understanding the type of building, along with its age and geographical locations (urban versus rural, etc.) will have an impact on the types of retrofitting measures that will be most suitable for decarbonising an individual property’s heat source. It will also have implications for the most appropriate type of financing.
Figure 9-3 below demonstrates that tenements are the most common type of domestic property in Scotland, followed closely by detached houses, which have accounted for the largest proportion of domestic construction since 1982. While relatively few of these two types of building were constructed during the mid-twentieth century, the retrofitting requirements of this stock are likely to vary substantially, as between a quarter and a fifth of both tenements and detached buildings were constructed before 1919. With the costs for retrofitting older buildings anticipated to be higher, and in some cases impacted by planning restrictions on the types of work permitted, the Taskforce anticipates a need for financing products that offer longer payback periods to ensure they are affordable for property owners where the costs of retrofitting are higher.

It will also be helpful to consider the annual turnover of housing stock in the development and financing of retrofit, as the point at which ownership of a property changes can be a key time at which heating (and other building) upgrades can be undertaken. Figure 9-4 below shows that out of the near 100,000 property sales in Scotland per year, about a third are flats, whilst almost three fifths are houses of different types[49].

If annual turnover of housing stock remains broadly in line with the levels in 2021, this means that between now (2023) and 2030, around three quarters of a million properties could be expected to change ownership. While this is equivalent to about 30% of Scotland’s current domestic housing stock, it would not, on its own, deliver the scale of transformation required to achieve targeted levels of Net Zero heating by the end of the decade, particularly as certain properties are likely to be sold multiple times over that period.
Accordingly, this supports the need for mechanisms that incentivise and encourage retrofit at other points in the ownership cycle of a property, for instance, on change of energy supplier. The Scottish Government should reflect on what these trigger points may be and how to best incentivise action at each point. This is likely to include broader area-based delivery mechanisms that can support decarbonising Scotland’s buildings in a way that does not rely on property sales as a natural trigger point for undertaking decarbonisation works. The use of LHEES and associated delivery plans will provide a valuable contribution to area-based delivery and is something we will discuss further in our Part 2 Report.
9.2 Non-domestic buildings
There are nearly 230,000 non-domestic buildings in Scotland of varying size and use. Over half (59%) of these buildings have electricity as their main heating fuel, compared to only 11% in domestic properties where 80% are heated by gas. Although a higher proportion of non-domestic buildings have electric heating, poor energy efficiency needs to be addressed to avoid massive peak demand on the grid and enable renewable supply to service a larger number of buildings.
Table 9-2, Table 9-3, and Figure 9-5[50] below show that retail and financial, offices and workshops and public assembly buildings are the most populous non-domestic building type. It is worth noting that while these three usage types account for nearly 70% of non-domestic buildings by premises, they make up a substantially lower total by building floor area at just under 60%.
| Non-Domestic property type | Percentage of total non-domestic properties |
|---|---|
| Retail and Financial | 32% |
| Offices and Workshops | 27% |
| Public Assembly | 11% |
| Restaurants, Cafés and Takeaways | 8% |
| Industrial | 6% |
| Hotels | 4% |
| Education | 4% |
| Storage and Distribution | 4% |
| Healthcare | 3% |
| Other | 1% |
| Non-Domestic property type | Percentage of total non-domestic area |
|---|---|
| Offices and Workshops | 29% |
| Retail and Financial | 18% |
| Public Assembly | 12% |
| Industrial | 10% |
| Education | 9% |
| Hotels | 8% |
| Storage and Distribution | 7% |
| Restaurants, Cafés and Takeaways | 5% |
| Healthcare | 2% |
| Other | 2% |

The difference in the proportion of non-domestic buildings by premises, compared to floor area, may have implications for the targeting of initiatives at non-domestic building owners. The impact of each individual building owner amongst the top three categories (where floor areas of premises are smaller) converting to ZDEH on the overall heating emissions of non-domestic buildings will be less significant than when the owner of a hotel, industrial unit or educational property transitions. This is because these three categories of building account for relatively large proportions of the overall non-domestic building footprint and have relatively large individual property sizes on average. It is noted, though, that averages can be misleading, for example, in healthcare, where both hospitals (with a large footprint) and GP surgeries (with a much smaller footprint) are represented.
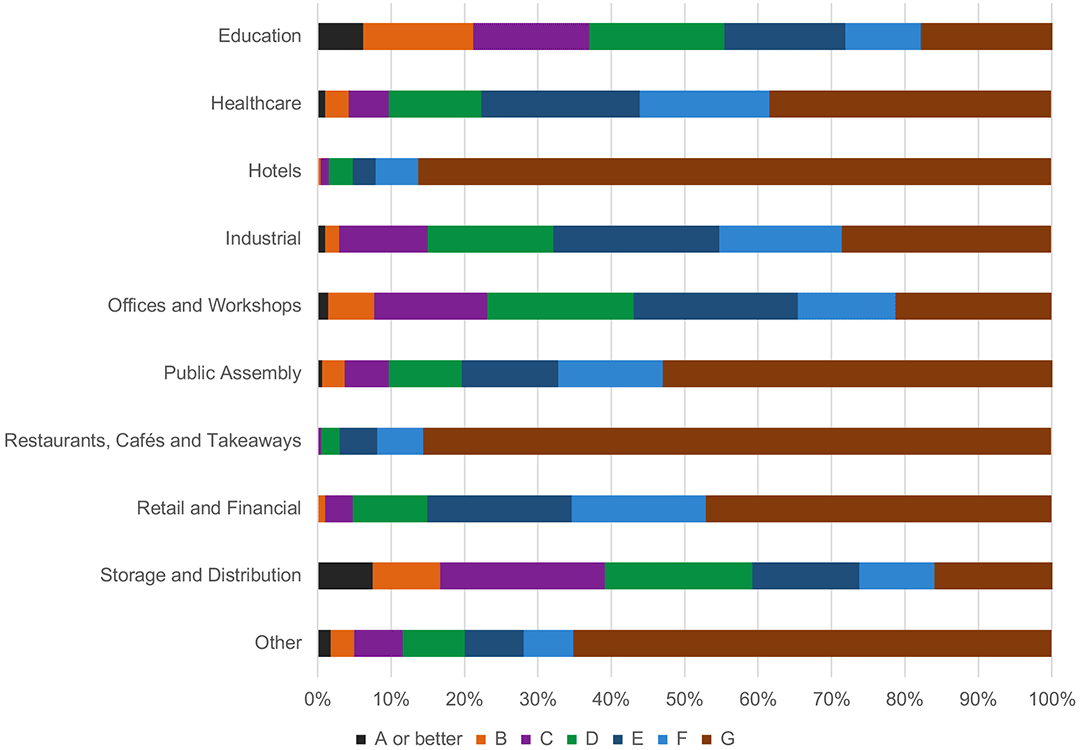
Non-Domestic EPC Profile By Sector
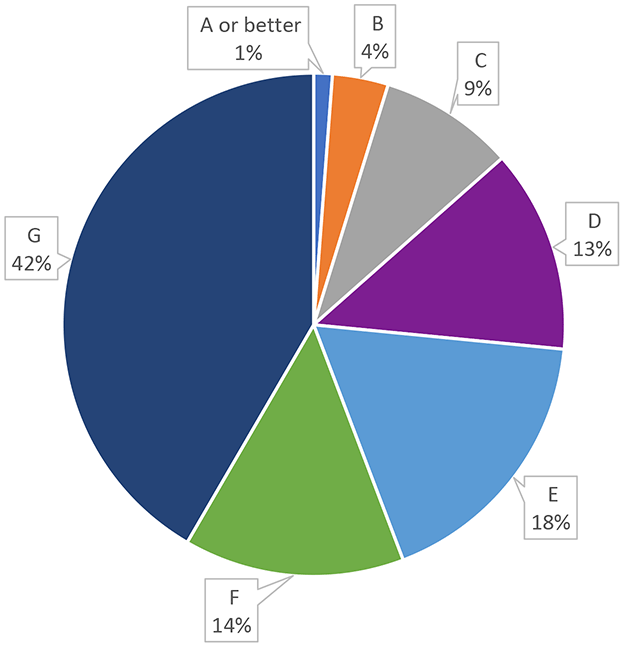
Figures 9-6 and 9-7 below illustrate that around 85% of non-domestic buildings have an EPC rating of D or lower[51]. This trend is relatively uniform across building types. While the EPC rating of non-domestic properties is generally much lower than domestic properties, some building types are particularly poor, for example, restaurants, cafés, takeaways and hotels. However, it is noted that available EPC data only covers less than 20% of non-domestic buildings and so the Taskforce recognises this trend may not be totally representative of the wider non-domestic stock.
These are also businesses which have been particularly hard hit through COVID-19 and the cost crisis, with margins being squeezed as they struggle to get demand to return to pre-pandemic levels, while simultaneously dealing with higher input and wage costs. The Scottish Government will need to take these pressures into account in designing policies and financing mechanisms that will enable these businesses to make a transition to ZDEH and improved energy efficiency at a time when many continue to face significant cash flow challenges.
Many of these businesses will also be tenants, so questions around whether it should be the owner or tenant that invests in property improvements, and how this is captured in leasing agreements, will be particularly important for these types of non-domestic buildings. (See section 4.2.4 for further discussion of this split incentives barrier).