Fishing - multispecies management approaches: evaluation
This report explores the potential of four proposed multispecies management approaches to address the issue of "choke species" in North Sea demersal fisheries using a multi-stock, fleet-based model.
Results - comparison of management approaches
The simulation results for the management approaches are compared below in terms of the biological health of the stocks, fleet performance and management system effectiveness.
Biological health of the stocks
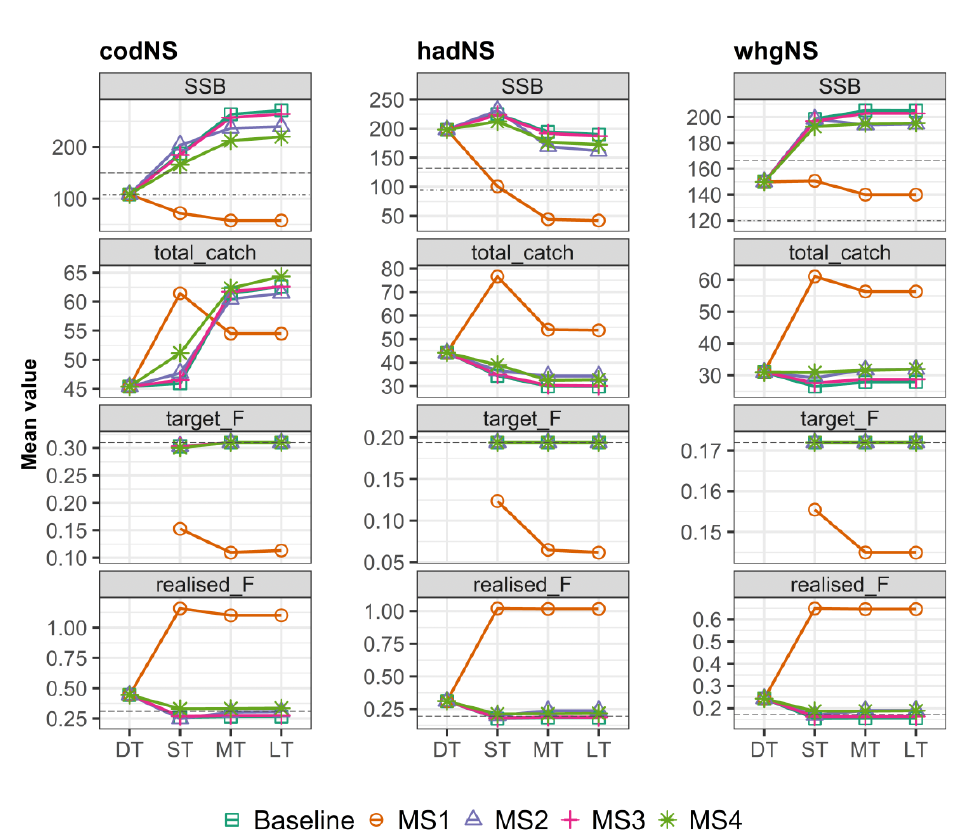
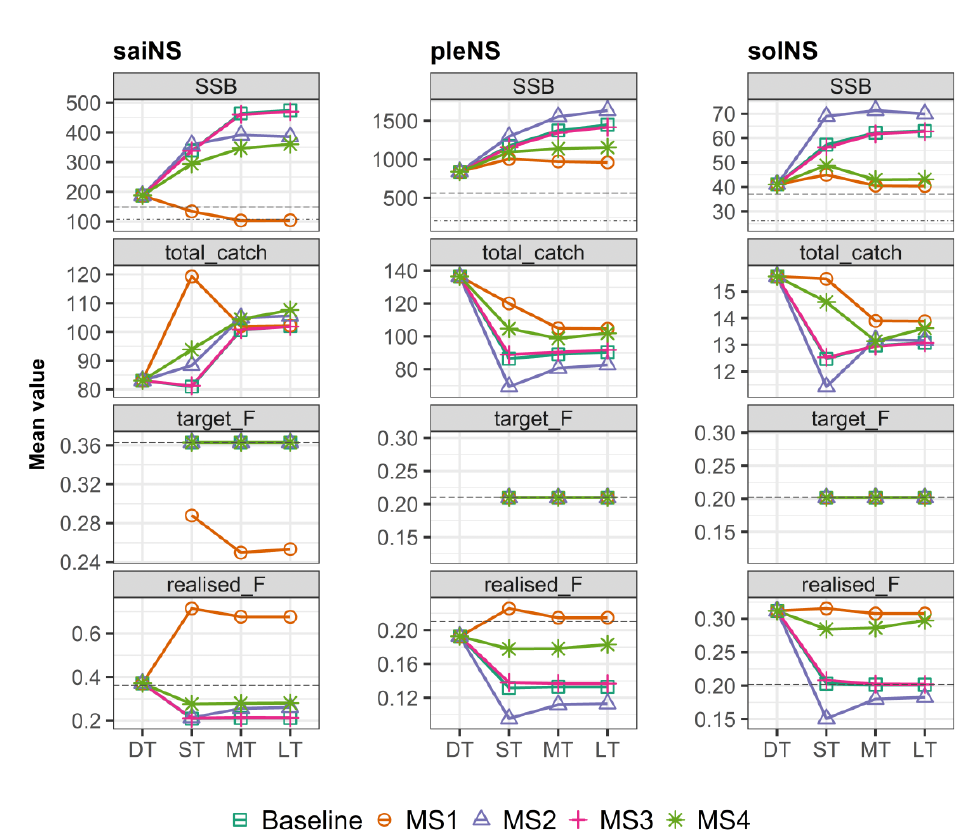
In all scenarios the SSBs of the fish stocks were seen to reach an equilibrium point by the end of the simulation period. In the ICES MSY approach (Baseline), quota points (MS2) and the two interspecies flexibility approaches (MS3 and MS4), the SSB was seen to be above MSY Btrigger for all stocks (Figure 4-6). However, the SFA Others pool approach (MS1) resulted in an SSB below MSY Btrigger for whiting and below Blim for cod, haddock and saithe. Additionally, for plaice and sole, this management approach resulted in the lowest SSB of all the management approaches while remaining above MSY Btrigger values for these stocks.
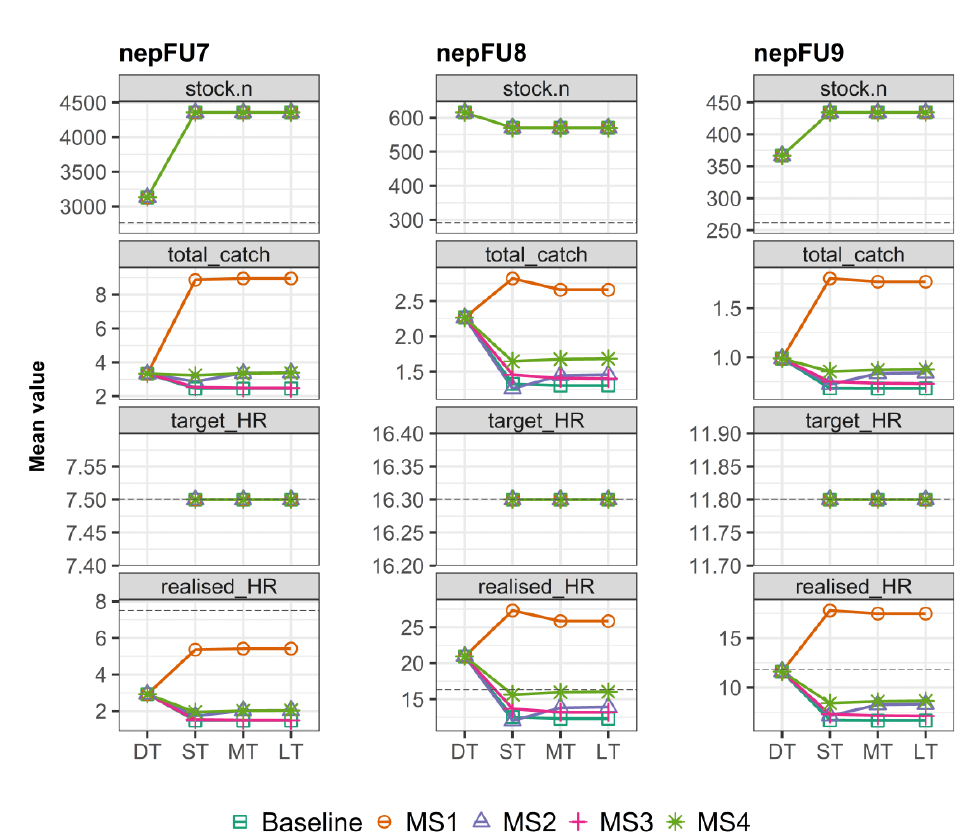
Correspondingly, catches were highest under the SFA Others pool approach for all the stocks except for cod, where, catches increased in the short term but were lower in the long term compared to the other management approaches. This pattern of short term increases in catches followed by a sustained decline over the rest of the simulation period was replicated across the fish stocks and Nephrops FUs for this approach, reflecting the corresponding decline in stock status.
Similarly, differences occurred between the target and realised fishing mortality between the management approaches. The target F for the SFA Others pool approach (MS1) was set lower than the FMSY value for the gadoid stocks due to the poor stock status. However, the realised fishing mortality was much higher than the FMSY for the gadoids for this management approach. Conversely, the other management approaches had realised fishing mortalities mostly at or below the target F values.
Across all stocks the CFP implementation of interspecies flexibility (MS3 and MS4) gave very similar results to the Baseline approach in terms of SSB, catches and realised fishing mortality. In both these management approaches the realised F did not reach the target F for most stocks. The alternative interspecies flexibility implementation gave slightly lower SSB values and higher catches compared to the CFP implementation across most stocks. Likewise, the alternative implementation of interspecies flexibility resulted in higher realised F compared to the Baseline and was above the target of FMSY for cod, haddock, whiting and sole; all of which were the most common choke species under this management approach.
The results of the quota points system approach (MS2) were, again, mostly similar to the Baseline and the interspecies flexibility approaches across SSB, catch and fishing mortalities. However, for flatfish stocks, higher SSBs and lower catches and realised Fs were seen under this management approach relative to the other approaches. For several other stocks, realised Fs were seen to be higher compared to the Baseline though they were below MSY fishing mortality or harvest rate values for most stocks. However, the realised F was seen to be equal to FMSY for cod and above FMSY for haddock and whiting.
Fleet performance
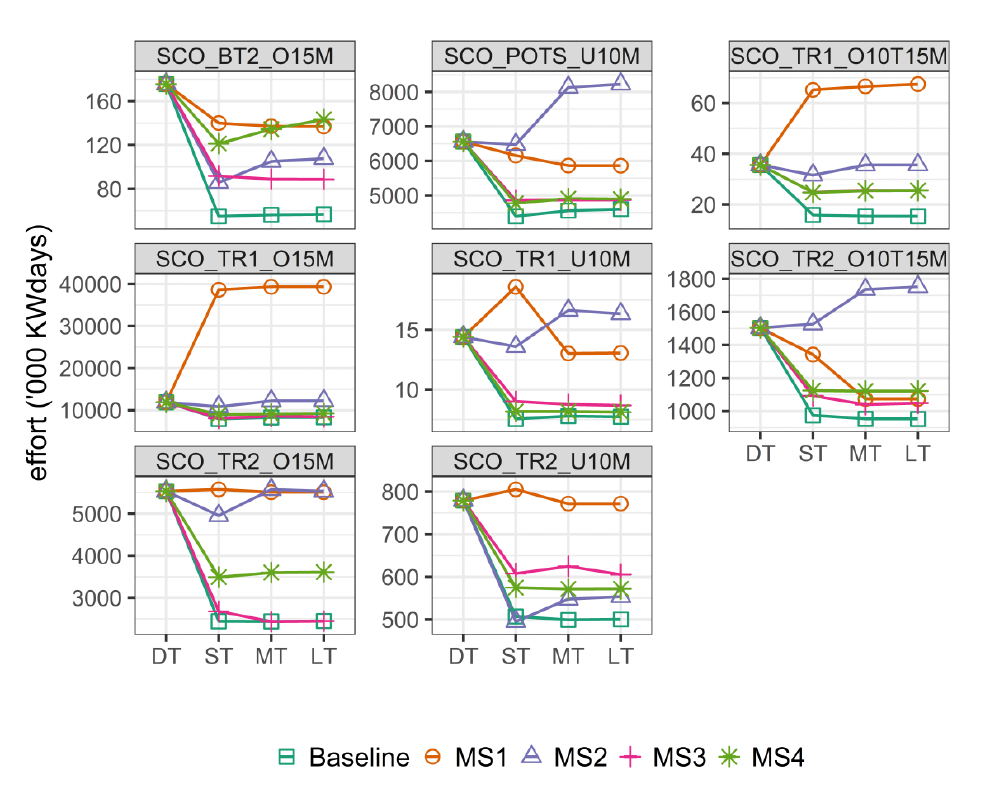
The total effort (kW days) by fleet was seen to be lowest under the ICES MSY approach compared to the other management approaches, corresponding to the strict implementation of a landing obligation (Figure 7). Similarly, for both interspecies flexibility management approaches the fleet effort was seen to be lower than historical values for all fleets. However, most fleets under the SFA Other pool (MS1) and the quota points system (MS2) approaches see a maintenance or increase in effort during the projection years. The exceptions to this were the beam trawl fleet (SCO_BT2_O15M) in both management approaches, the pot/creel fleet (SCO_POTS_U10M) and the mid-sized vessel, TR2 fleet (SCO_TR2_O10T15M) for the SFA Others pool approach and, the small vessel, TR2 fleet (SCO_TR2_U10M) for the quota points system.
The largest increases in effort were seen for the mid-sized and large vessel TR1 fleets (SCO_TR1_O10T15M, SCO_TR1_O15M) under the SFA Others pool approach, and for the pot/creel and mid-sized vessel TR2 fleets (SCO_POTS_U10M, SCO_TR2_O10T15M) under the quota points system approach.
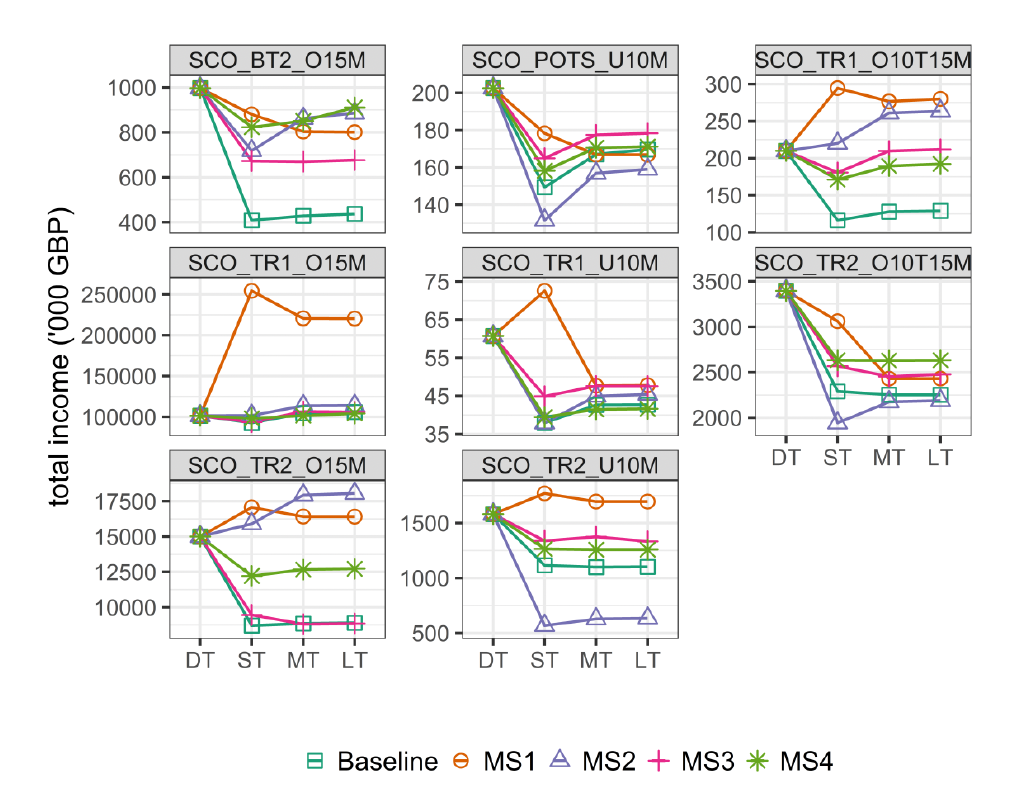
The patterns in total fleet income (Figure 8) show decreases in all the management approaches for the pots/creel, beam trawl, small vessel TR1 and mid-sized vessel TR2 fleets (SCO_POTS_U10M, SCO_BT2_O15M, SCO_TR1_U10M, SCO_TR2_O10T15M). Changes in total fleet income for the other fleets were dependent on the management approach with the SFA Others pool and quota points system being more likely to result in an increase in fleet income, particularly for the demersal trawl fleets of vessels over 10 metres. The quota points system approach was also seen to result in the lowest overall fleet income for the TR2 fleets for vessels under 15 metres as well as the pot/creel fleet. A common pattern seen across fleets and management approaches was a reduction in fleet income in the short-term after which a recovery in income levels was seen in the medium to long-term. A notable exception to this was the SFA Others pool approach which resulted in higher income levels in the short-term compared to the medium and long-term in most fleets.
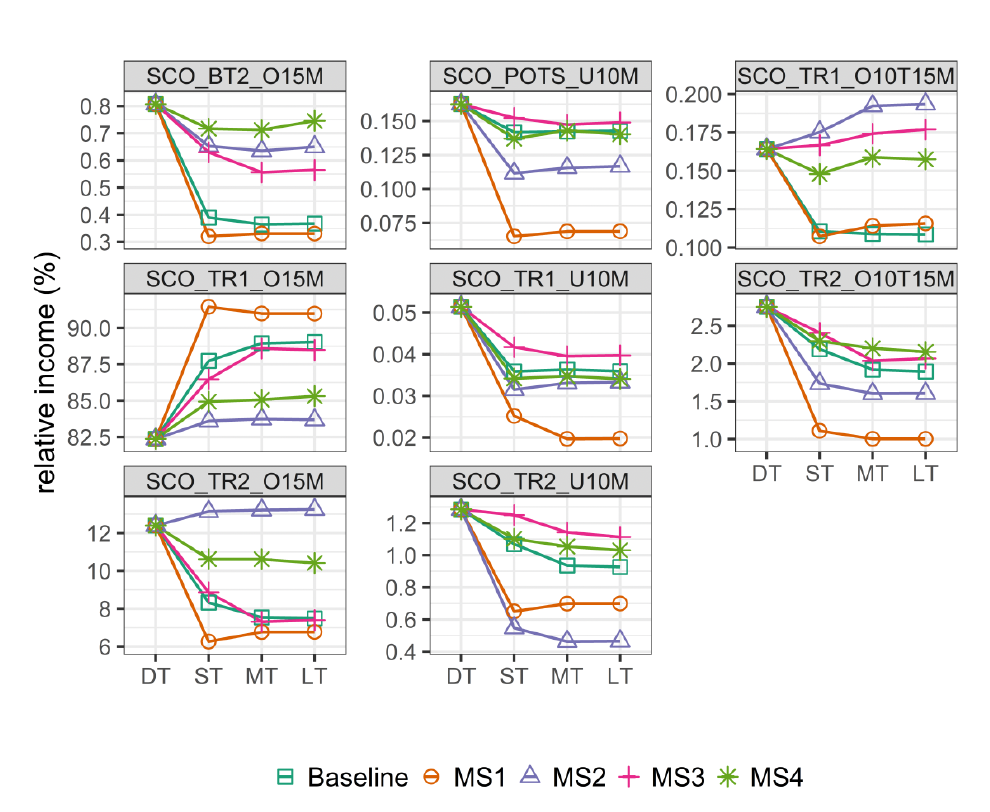
Changes in the annual income share for each fleet are shown in Figure 9. At the beginning of the simulations the majority of the total income amongst Scottish fleets was taken by the TR1 fleet of vessels over 15 metres (82%; SCO_TR1_O15M). This fleet’s share was seen to increase under all management scenarios, ranging from approximately 84% under the quota points system to over 90% under the SFA Others pool approach. Several fleets saw a reduction in their income share across all the management approaches with the largest reductions seen under the SFA Others pool approach.
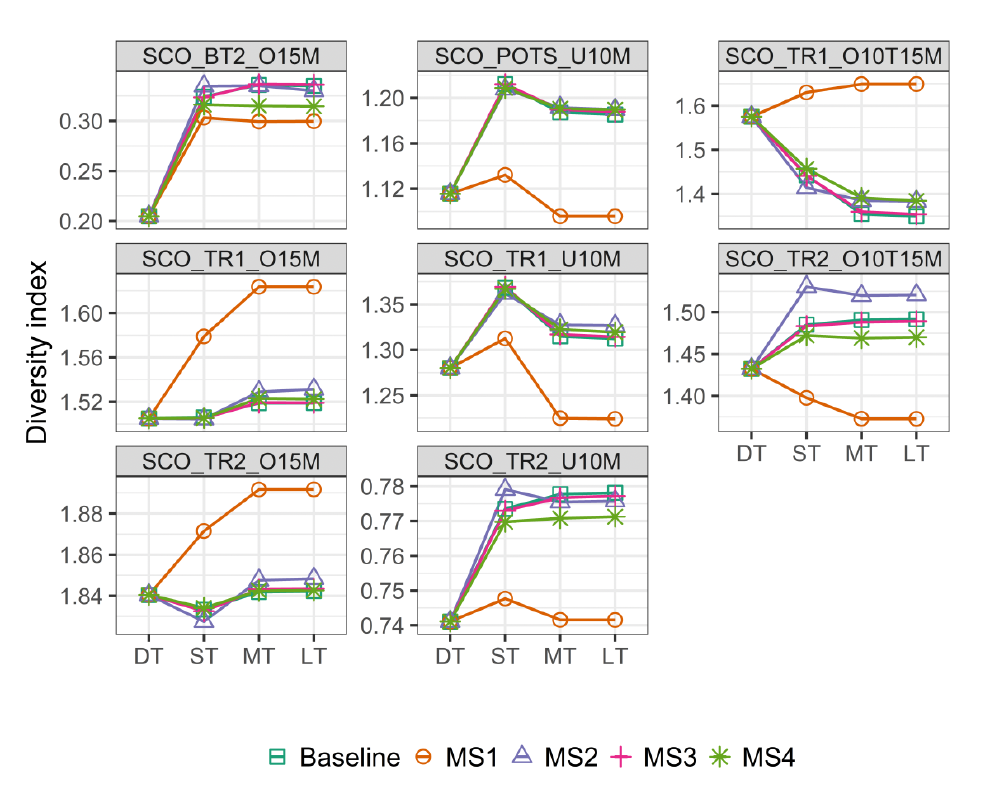
Changes in fleet catch diversity (measured by the Shannon diversity index; Shannon, 1948) indicate whether the management approaches resulted in fleets catching either a more or less diverse range of stocks compared to the historical data (Figure 10). For most of the management approaches, the majority of the fleets saw an increase in the level of diversity in the catch compared to recent historical values with little difference seen between the management approaches. This increase reflected the recovery of all stocks over time and the corresponding increase in catches. However, there were some notable exceptions. Firstly, the mid-sized vessel TR1 fleet (SCO_TR1_O10T15M) saw a reduction in catch diversity across most of the management approaches. Secondly, the SFA Others pool approach resulted in relatively larger increases in catch diversity for only around half the fleets, and a reduction in catch diversity for the rest of the fleets compared to the other management approaches.
Management system effectiveness
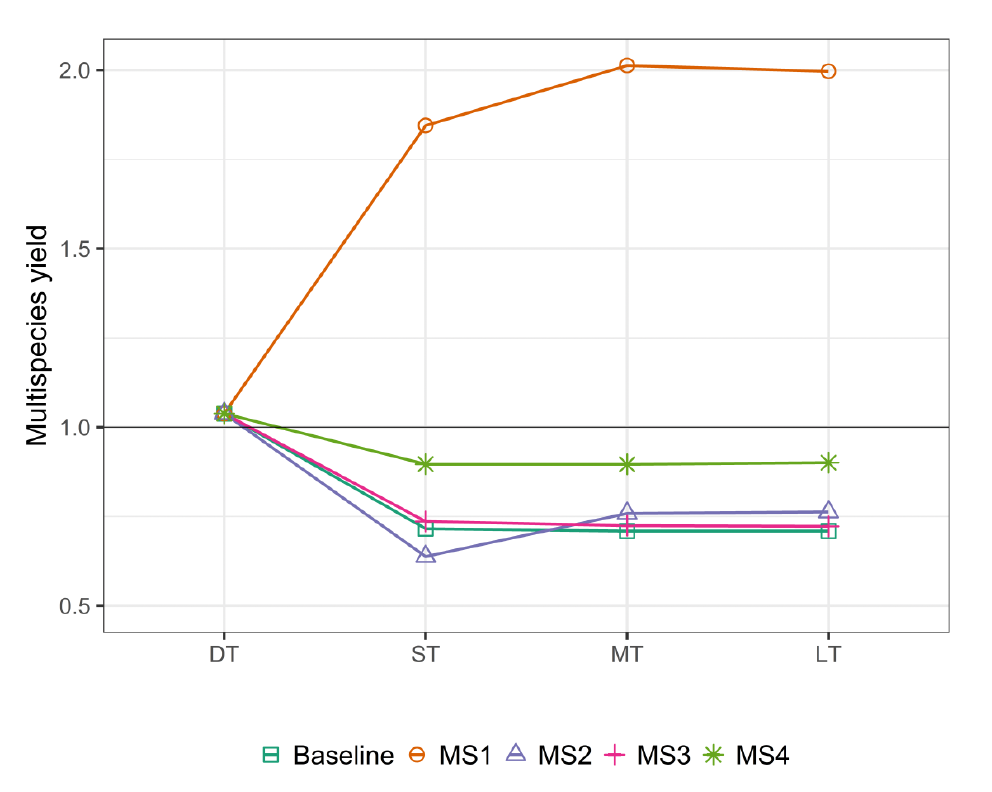
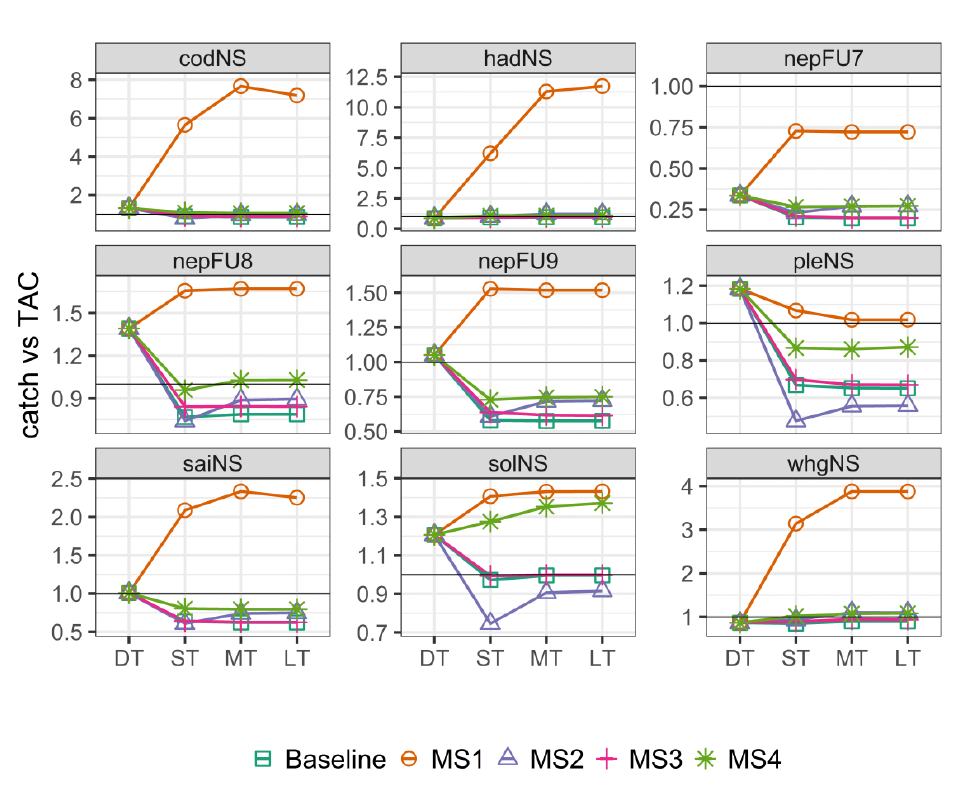
The multispecies management performance of each approach was assessed from the multispecies yield in addition to comparing the total catch and TAC for each individual stock (Figures 11 and 12). The multispecies yield compares the sum of total catch across all stocks to the sum of TAC across all stocks. A value of one indicates that the total catch across all stocks equals the total TAC across all stocks. A value below one or above one indicates that the TAC across all stocks is either being unutilised or is being exceeded, respectively.
The ICES MSY approach resulted in a multispecies yield of approximately 0.71. All the other management approaches resulted in a higher multispecies value increasing slightly to 0.72 (MS3), 0.76 (MS2), 0.9 (MS4) and almost 2 (MS1). However, the change in ratio between total catch and TAC for individual stocks was seen to vary across the management approaches (Figure 10). For most stocks, especially cod, haddock and whiting, total catch was seen to exceed the TAC under the SFA Others pool approach. Under the other management approaches, catches were seen to be either at or under the TAC for most stocks except for sole where catches exceeded the TAC under the alternative implementation of interspecies flexibility (MS4).
Contact
Email: harriet.cole@scot.gov