Fishing - multispecies management approaches: evaluation
This report explores the potential of four proposed multispecies management approaches to address the issue of "choke species" in North Sea demersal fisheries using a multi-stock, fleet-based model.
Methods and Materials
The candidate management strategies that will be tested in this report are the ‘Others’ pool, interspecies flexibility and a quota points system. They fall into two basic categories - quota transfer schemes (i.e. quota transfers between species) and schemes that employ an alternative tariff system to TACs against which to account for fishing activity. These approaches were chosen because the data requirements to simulate these strategies were easily available and did not require additional computing resources. Other schemes that were initially considered were not chosen due to the highly resolved spatial and temporal data needed or because it was not explicitly clear how the scheme would be implemented in Scottish fisheries.
Model setup
The analysis covers the North Sea region. The model used is FLBEIA (Bio-Economic Impact Assessment using FLR (Fisheries Library in R; Kell et al., 2007, R Core Development Team, 2014) which provides a flexible and generic simulation model for use in management strategy evaluations (MSEs) and can simulate multiple stocks and multiple fleets (GarcÃa et al., 2017, 2019).
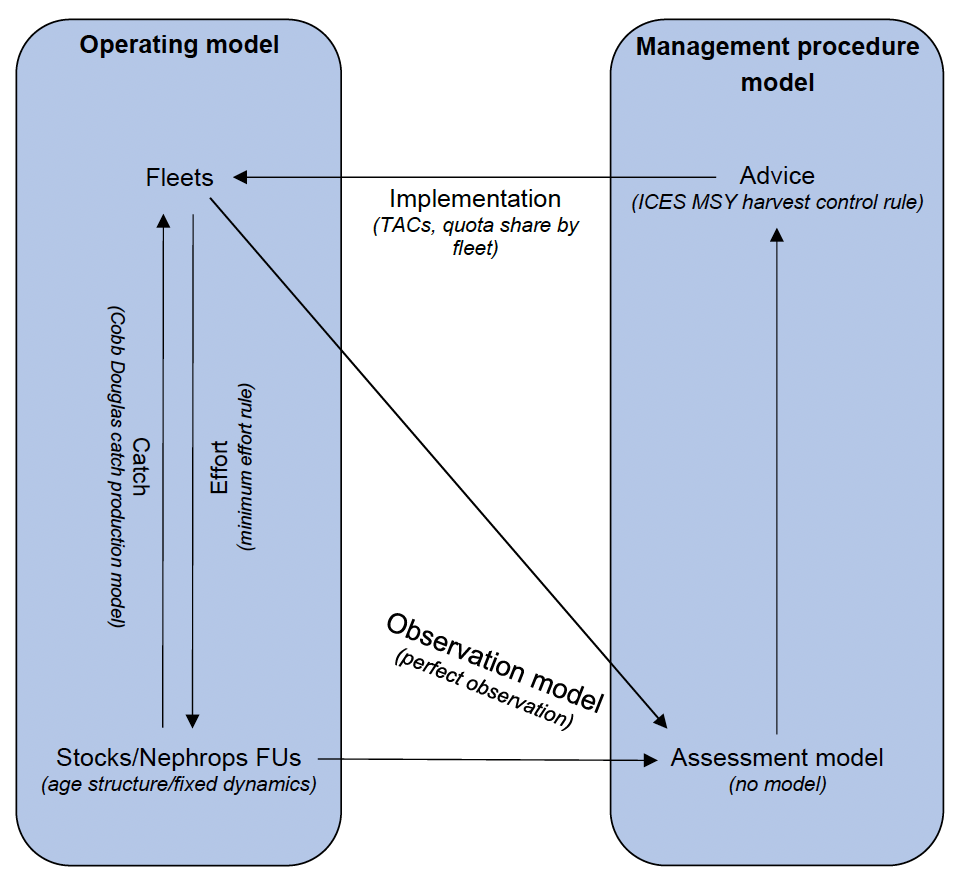
The model consists of two parts; the Operating Model and the Management Procedure Model (Figure 1). The Operating Model represents the underlying "truth" of the system and models the population and fleet dynamics. The population dynamics for the fish stocks were controlled by age-structured growth and stock-recruitment relationship (SRR) models whereas the Nephrops (Nephrops norvegicus) Functional Unit populations were projected using a fixed stock size. Fishing mortality was calculated numerically using the total catch projected by the fleet dynamics model. This fishing mortality was then applied as an exponential decay rate through the standard Baranov equation to adjust population levels.
The fleet dynamics were controlled by the Simple Mixed Fisheries Behaviour (SMFB) model provided in FLBEIA which is based on the Fcube method (Ulrich et al., 2011). Effort was allocated for each fleet based on a so-called "minimum" effort rule (WGMIXFISH-ADVICE; ICES, 2022). The "minimum" effort rule simulates a strictly implemented landing obligation (i.e. without any exemptions) as it sets the effort in line with a fleet’s most restrictive quota. The "minimum" effort rule was used for all projection years (2017 to 2037).
For each métier within a fleet, the catches were generated using the Cobb-Douglas catch production model (Cobb and Douglas, 1928) which links effort to catch for each stock based on the fleet’s catchability for that stock:
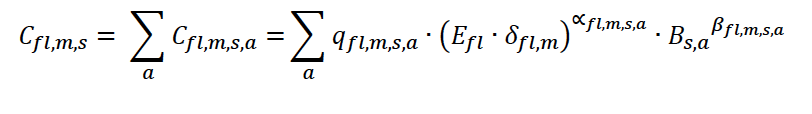
where 𝐶𝑓𝑙,𝑚,𝑠 is the total catch for fleet (𝑓𝑙) and métier (𝑚) of stock 𝑠. 𝐵 denotes the biomass, 𝑞 is the catchability, 𝐸 is fleet effort, δ is the effort share of the métier (m) and 𝑎 denotes age class. The parameters α and β are elasticity parameters and are specific to the stock, age class and gear technology of the métier. These were both set to the default value of one for all fleets due to lack of information on these parameters for each métier.
The Cobb-Douglas catch production model is the only catch production model available within FLBEIA as it allows effort restrictions to be estimated independently for each fleet. This is different to using a Baranov-type derivation (Baranov, 1918) as a catch production model, as more typically used in stock assessment models. A comparison of the performance of these two catch production models was performed by IBPMIXFISH (ICES, 2021), which found only limited differences between the models at low and moderate levels of fishing mortality. Therefore, for the current state of the stocks in this analysis, the Cobb-Douglas model should give similar results to the Baranov model.
The Management Procedure Model encapsulates the observation, assessment and management components. A full assessment approach was not used here due to the longer computational time that would be needed. Therefore, the values needed by the assessment and management components were derived from a perfect observation of the stock. The management procedure then produced catch advice by conducting a short term forecast and applying the ICES MSY approach harvest control rules before implementing this advice as TACs in the Operating Model (see Figure 1). The settings used for the short term forecast follow those used at the 2019 ICES Working Group for the North Sea, Skagerrak and Kattegat (WGNSSK; ICES, 2019) as closely as possible. However, a geometric mean was used as the SRR model for all fish stocks using the recruitment periods detailed in Table 1. This differs from some of the recruitment forecast assumptions made at WGNSSK but remains consistent with the SRR model used in the Operating Model. For the Nephrops Functional Units (FUs) a 25% discard survival rate was assumed, similar to the assumption made by WGNSSK. The biological reference points used in the HCRs use the ICES references points derived by WGNSSK (ICES, 2019).
Input data
The input data provided information on the stocks, the fleets and current fisheries management for the North Sea area. For the stocks, data were obtained from WGNSSK in the form of age-based, analytical assessments for North Sea cod, Northern Shelf haddock, North Sea whiting, North Sea sole, North Sea plaice and Northern Shelf saithe (Table 1). Data for Nephrops FUs were also available from WGNSSK of which FUs 7, 8 and 9 (Fladen, Firth of Forth and Moray Firth respectively) were included in the model (Table 2). The fish stock and Nephrops FU data used were the output from the final assessments performed at WGNSSK 2019 (ICES, 2019).
For the fleets, effort data in units of kilo watt (kW) days were obtained from the Scientific, Technical and Economic Committee for Fisheries (STECF) data portal (Report Annex Data) for 2012-2016. Effort was provided by country, ICES statistical rectangle, gear and vessel length. Corresponding landings and discards data, disaggregated by country, rectangle, gear, vessel length and stock were also obtained from STECF. The fleet data were subset to include only fleets which catch the stocks listed in Tables 1 and 2, and were aggregated by year and area (ICES Subarea, 27.4, divisions 27.7.d, 27.6.a, and subdivisions 27.3.21, 27.3.20). Data pertaining to all countries were used to condition the model, however only results for the Scottish fleets are presented.
Table 1 .
Details of the demersal fish stocks used in the model including the stock code used by ICES and in the multi-stock, multi-fleet model, the areas and years covered by the stock, the years used to derive a geometric mean of recruitment values and the stock assessment model used by ICES.
|
ICES stock code |
Model stock code |
Stock areas |
Time series years |
Recruitment period |
Assessment model |
|---|---|---|---|---|---|
|
cod.27.47d20 |
codNS |
Subarea 27.4, Division 27.7.d & Subdivision 27.3.a.20 |
1963-2018 |
1998+ |
SAM (Nielsen and Berg 2014) |
|
had.27.46a20 |
hadNS |
Subarea 27.4, Division 27.6.a & Subdivision 27.3.a.20 |
1972-2018 |
2000+ |
TSA (Fryer 2002) |
|
whg.27.47d |
whgNS |
Subarea 27.4 and Division 27.7.d |
1978-2018 |
2002+ |
SAM (Nielsen and Berg 2014) |
|
pok.27.3a46 |
saiNS |
Subareas 27.4, 27.6 & Division 27.3.a |
1967-2018 |
1998+ |
SAM (Nielsen and Berg 2014) |
|
ple.27.420 |
pleNS |
Subarea 27.4 & Subdivision 27.3.a.20 |
1957-2018 |
2006+ |
AAP (Aarts and Poos, 2009) |
|
sol.27.4 |
solNS |
Subarea 27.4 |
1957-2018 |
1957+ |
AAP (Aarts and Poos, 2009) |
Table 2 .
Details of the Norway lobster Functional Units (FU) used in the model including the stock code used by ICES and in the multi-stock, multi-fleet model, and the areas and years covered by the functional unit.
|
ICES stock code |
Model stock code |
FU areas |
Time series years |
|---|---|---|---|
|
nep.fu.7 |
nepFU7 |
Fladen; 27.4 |
1992-2018 |
|
nep.fu.8 |
nepFU8 |
Firth of Forth; 27.4 |
1993-2018 |
|
nep.fu.9 |
nepFU9 |
Moray Firth; 27.4 |
1993-2018 |
STECF presents discards as they are submitted by each nation and no longer applies its own discard raising/fill-in procedure. Therefore, a discard raising procedure was needed here. Discards were raised by calculating the mean discard rate by year, area (ICES Subarea, 27.4, divisions 27.7.d, 27.6.a, and subdivisions 27.3.21, 27.3.20) and species, and applying the rate to landings records that did not have any corresponding discard information. As a quality check, the total discards estimated from the STECF data for each stock were compared to the total discards reported by WGNSSK where some substantial discrepancies were revealed. The source of these discrepancies was found to be some discard estimates flagged as poor quality by STECF. To resolve these discrepancies, these poor quality estimates were removed and the mean discard rates were recalculated.
The processing of fleet data for Nephrops was conducted differently. Fleet catch data on Nephrops by ICES statistical rectangle were required to assign the correct landings to a Functional Unit. The STECF data portal also provided landings disaggregated by rectangle and these data were used to obtain the aggregated landings of Nephrops for each FU. Discards by fleet for each FU were calculated using the mean discard rate by ICES division/subarea from the landings and discards data described above. Since all the FUs included in the model are located in Subarea 4, the discard rate used for each FU was the same (mean discard rate over Subarea 4). However, it should be noted that different discard rates are typically reported by WGNSSK for each FU. Finally, the discard data were adjusted to account for only dead discards by assuming a 25% survival rate as done at WGNSSK.
Sale price information by year and stock was obtained for Scottish vessels only (Fisheries Information Network / iFish). Information on gear in the sale price data were converted to STECF gear types following procedures used by MD-SEDD when reporting data to ICES to then derive mean sale prices (GBP/kg) by year, fleet, métier and stock.
For the fisheries management, the STECF data described above were used to obtain the quota shares of each fleet by stock. This was calculated as the proportion of total catch per fleet for each stock.
Model conditioning
The input data described above was used to condition the Operating and Management Procedure Models.
The WGNSSK stock data were used to set the population dynamics in the simulations. Future values for mean weights at age (stock ,catch, landings, discards), maturity, natural mortality were set to a mean of the three years (2014-2016) prior to the first simulation year (2017). A three year mean was chosen because there was evidence of some strong variation in recent years for some stocks in some ages for these parameters. For recruitment, a geometric mean was used to derive future recruitment. The recruitment time period used for the geometric mean was consistent with the assumptions used by WGNSSK when generating reference points for the stocks (ICES, 2019).
The STECF data on effort, landings and discards, as well as the sale price data were used to set the fleet dynamics in the simulation years. The method used to derive parameters and condition the fleet dynamics is similar to that used by WGMIXFISH-ADVICE in 2022 (ICES, 2022) though adapted to be compatible with the age-based dynamics of the stocks. Each fleet within the model can have one or more métiers under which fishing activity occurs and each métier has associated catches. The values used for fleet data variables in the projections were based on a five year mean (2012-2016). These variables include sale prices, effort share by métier, catches by métier, and catchabilities and selectivities by métier and stock. Mean weights-at-age for the métier catches were set to the mean weight-at-age for the total catch for the stock as provided by WGNSSK (ICES, 2019).
The fleet data were aggregated into distinct fleets which were defined in a similar manner to that used at WGMIXFISH-ADVICE (ICES, 2022), using country, gear type and vessel length. Within each fleet, fishing activity was aggregated into métiers which were defined by country, gear type, vessel length and area (ICES division/subarea). To reduce the large number of métiers to a manageable quantity, métiers with small catches (<1%) of all stocks were aggregated together, as per the WGMIXFISH-ADVICE procedure. However, an exemption was made for certain Scottish fleets with small catches of multiple stocks to preserve the mixed fisheries interactions that the candidate management strategies are designed to address.
The fleet data were also used to condition the Management Procedure Model with an average quota share by stock for each fleet Again, a 5-year average (2012-2016) was used in the simulation runs. Since this quota share was based on total catch proportions, it represents the final uptake of quota for each fleet (i.e. post ITQ trades, swaps etc.) and not necessarily the initial allocation of quota.
Some of the candidate management approaches needed a differentiation between target and non-target stocks for each fleet. Target and non-target stocks were defined using a combination of expert knowledge and values for catchability and discard rate for each stock per fleet. Target stocks were defined by a high catchability relative to other stocks (over 1/3 of the maximum catchability for the fleet) and a discard rate by weight of less than 50%. The choices of cut off values are arbitrary but relatively high catchabilities and low discard rates indicate that fish are being caught efficiently and retained and are therefore likely to be a target stock. Expert knowledge was used to ensure that the identified target stocks for each fleet were realistic and to assign target stocks where the criteria described above failed to identify one.
Model simulations
The first projection year was set to 2017. Each simulation ran for 20 years with only one replicate to reduce computational requirements.
The simulation runs:
Baseline - ICES advice (MSY approach).
MS1 - Shetland Fishermen’s Association Others pool
MS2 - Quota points system
MS3 - Interspecies flexibility - CFP
MS4 - Interspecies flexibility (alternative)
Simulations were run for each of the multispecies management strategies (MS1-4) and compared to the results of the Baseline simulation which used the single species ICES MSY approach. A range of targets and indicators were developed to objectively measure the performance of each strategy and identify trade-offs between stock health and fleet performance (i.e. catches, revenue) (Table 3).
Table 3 .
Performance targets and indicators
|
Goal |
Target |
Indicator |
|---|---|---|
|
Sustainability |
SSB is at or above MSY Btrigger |
SSB/MSY Btrigger |
|
Sustainability |
Fishing is at or below FMSY |
Fishing mortality/ FMSY |
|
Sustainability |
Potential for going below Blim |
Number of years SSB < Blim |
|
Economics |
Low mismatch between catch and quota |
Multispecies yield - sum of max individual species yields/quotas (Branch and Hilborn, 2008). |
|
Economics |
Avoid loss of income per fleet |
Income by fleet |
|
Economics |
Disproportionate effects on fleets |
Change in income by fleet, in absolute terms (compared to baseline) and as share of total income. |
|
Economics |
Avoid loss of catch diversity |
Shannon Diversity Index. |
Baseline
For the baseline projection, the ICES MSY approach harvest control rules (HCR) were used to generate an advised TAC for all stocks. The ICES HCR links the target fishing mortality for the TAC year to spawning stock biomass (SSB) at the start of the TAC year:
Rule 1: If SSB ≥ MSY Btrigger then Ftarget = FMSY
Rule 2: If MSY Btrigger > SSB ≥ Blim then Ftarget = FMSY * SSB/MSY Btrigger
Rule 3: If SSB < Blim and using Ftarget from rule 2 would not result in SSB ≥ Blim in the year after the TAC year then Ftarget is set accordingly to ensure that SSB rises above Blim in the year after the TAC year. This may result in Ftarget being set to zero.
For Nephrops FUs the advised catch was calculated by applying a harvest rate to the total abundance of the FU. The harvest rate value was set accordingly:
If abundance ≥ MSY Btrigger then Ftarget = FMSY harvest rate
If abundance < MSY Btrigger then Ftarget = FMSY * abundance/MSY Btrigger
At WGNSSK, only dead discards are considered in the HCR and the annual advice, due to the high survivability of discarded live Nephrops.
MS1
The SFA Others pool approach (MS1) was implemented through changes to the fleet behaviour model. First, the Others quota pool was defined as the total quota from a fleet’s non-target stocks that would remain unfilled when following a strict landing obligation as done in the Baseline scenario. Then, for each fleet, an optimal level of effort was derived that would ensure that the size of the Others quota pool would adequately cover the over-quota catch on target stocks. This was done by minimising the difference between the amount of over-quota target stock catches and the amount of unused non-target stock quota.
The SFA recommended that quota should not be transferred from fish stocks to cover Nephrops catches and vice versa (i.e. quota can be transferred between different Nephrops FUs but cannot be used to cover over-quota catch in a fish stock and vice versa). Additionally, as suggested by the SFA a limit of 20% of a fleet’s total quota allocation was used to limit the size of the ‘Others’ pool.
MS2
The quota points management strategy (MS2) is multispecies in approach and therefore required the development of two new tools for use in managing the fisheries. These two tools are the derivation of the total quota points available each year and the setting of a points tariff to determine how many points a tonne of each stock will cost.
Needle (2012) recommended basing the total quota points on a stock-specific threat index. However, in practice, the threat index definition from Needle (2012) often resulted in a negative number of total quota points across the stocks considered here. Therefore, the index was adapted (and renamed the "status index" ) to reduce the likelihood of negative quota points, and was defined as:
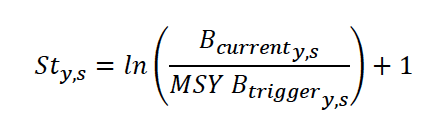
Where 𝑆𝑡 is the status index for year, 𝑦, and stock, 𝑠, Bcurrent is the SSB (or abundance) at the start of the TAC year. The status index for stocks at MSY Btrigger is equal to 1.
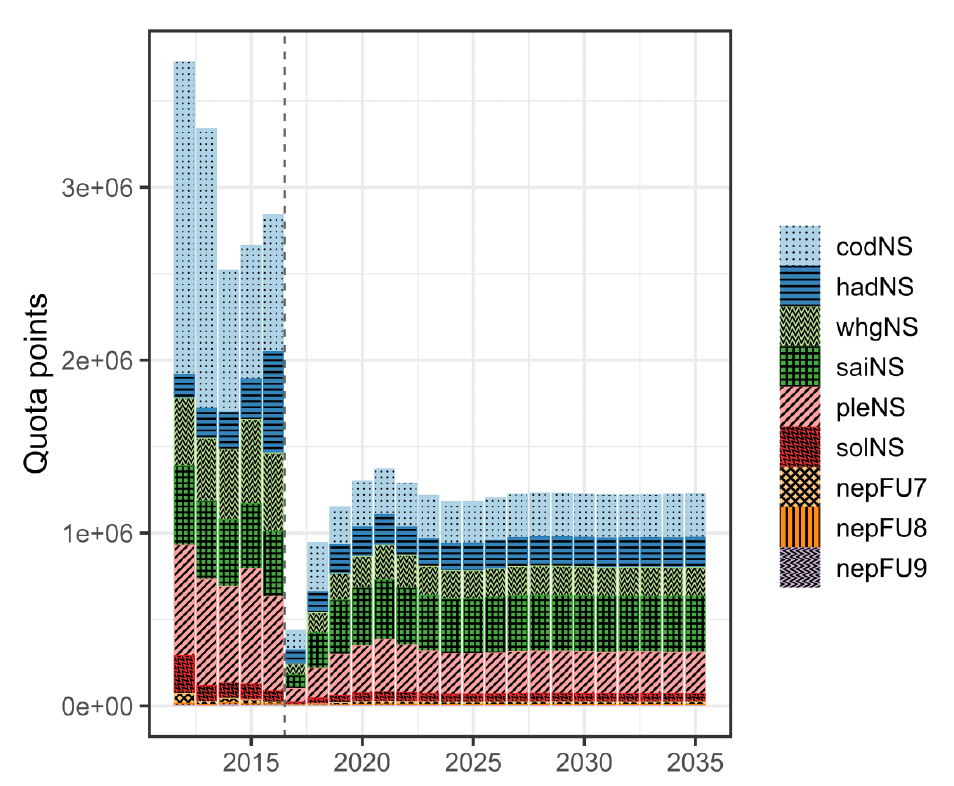
Then, the total quota points (Figure 2) available to the fishery in the TAC year is given by:
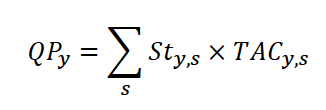
Where 𝑄𝑃 is the total quota points, 𝑆𝑡 is the status index and TAC is the stock-specific total allowable catch for the TAC year as estimated through the usual forecasting and advice procedure (same HCRs as the ICES MSY approach).
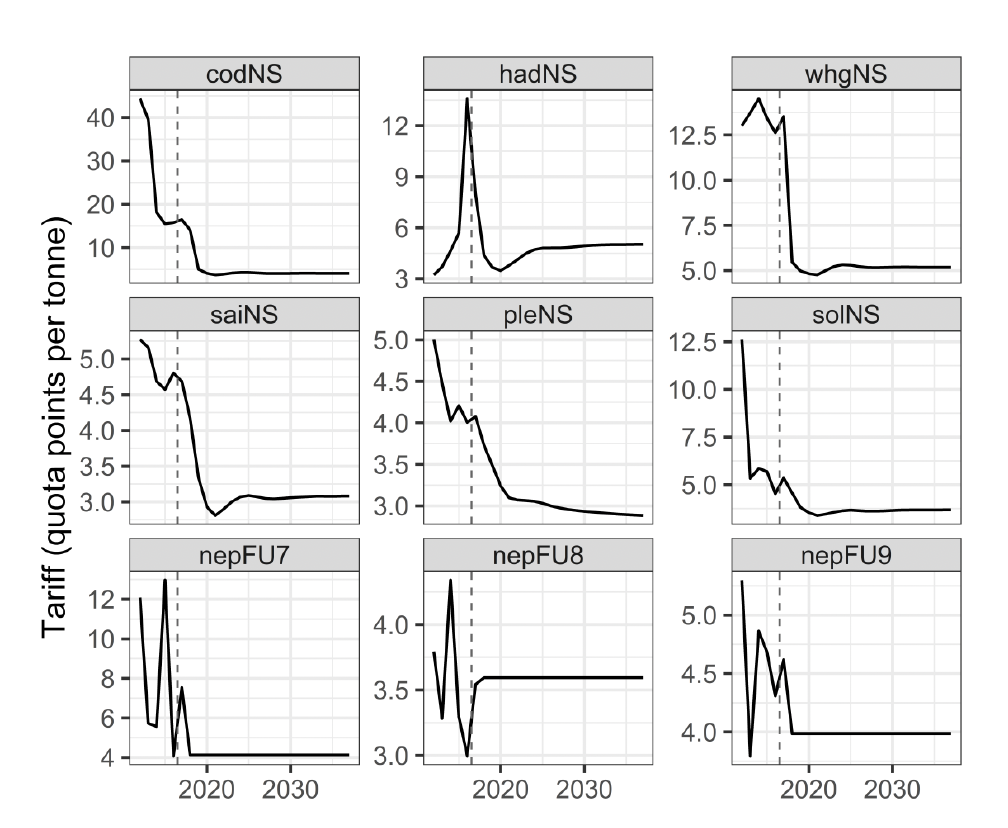
Next, the tariff (Figure 3) specifies how many points each tonne of caught fish is worth. This varies by stock allowing high tariffs to be set for threatened stocks to incentivise avoidance. The basis of the tariff for each stock in each year was set to be inversely proportional to the status index, 𝑆𝑡:
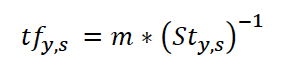
where 𝑡𝑓 is the tariff value and is a multiplier applied when the current biomass (Bcurrent) of a stock falls below specified reference points. The value of 𝑚 was set to 6 if 𝐵current if was above or equal to MSY Btrigger, 12 if 𝐵current was below MSY Btrigger but above or equal to Blim and 24 if 𝐵current was below Blim. These values applied to all stocks and were derived through a trial and error process.
Implementing this management approach in the model was done by setting the total fleet effort and effort share among a fleet’s métiers to maximise the utilization of a fleet’s share of quota points. Economic factors were not considered in this optimisation. Prior to running the simulation, the fleet’s share of the total quota points in the projection was set to the mean share over 2012-2016 using historical values of SSB (or abundance), TAC quota share, TAC and MSY Btrigger to calculate the historical time series of total quota points and each fleet’s quota point allocation.
MS3 and MS4
Using interspecies flexibility as a management approach was tested with two different implementations - one which followed the CFP guidance (MS3) and another which relaxed some of the CFP limitations (MS4).
Interspecies flexibility as set out in the CFP (Article 15(8) of Regulation (EU) No 1380/2013) states that catches of species subject to the EU Landing Obligation, caught in excess of quota or in the absence of quota may be deducted from the quota of the target species. The deduction should not exceed 9% of the quota of the target species and the donor, non-target species must be within safe biological limits.
To implement the CFP interspecies flexibility approach, target and non-target stocks were first identified for each fleet. Then, if the effort-restricting stock was a non-target stock, a deduction of quota at the fleet level was made from the target stocks to cover the excess catch of the non-target stock, providing the SSB or abundance of the non-target stock was above MSY Btrigger. The quota transfers were implemented in the fleet behaviour model by maximising fleet effort through changing the percentage quota that each donor (target) stock transfers to the recipient (non-target) stock. As per the CFP regulations, an upper limit on the percentage of received quota was set as 9% of the recipient stock’s initial quota.
The second implementation of interspecies flexibility removed the restrictions on donor and recipient stocks being target or non-target stocks so that the effort restricting stock could receive quota from any other stock. However, the stipulation on recipient stocks being within safe biological limits and the 9% limit on received quota were both kept. In addition to these existing rules, a new restriction was introduced - that fish and Nephrops would be treated separately (i.e. quota cannot be transferred from Nephrops to fish and vice versa).
Contact
Email: harriet.cole@scot.gov