Connecting Scotland - evaluation: qualitative research - implementation and early impact
Findings of research with organisations who applied for digital devices, through the Connecting Scotland programme, to distribute to people that they support.
Appendix 2 – Profile of survey respondents
Survey respondents
We received 547 responses from 420 organisations.
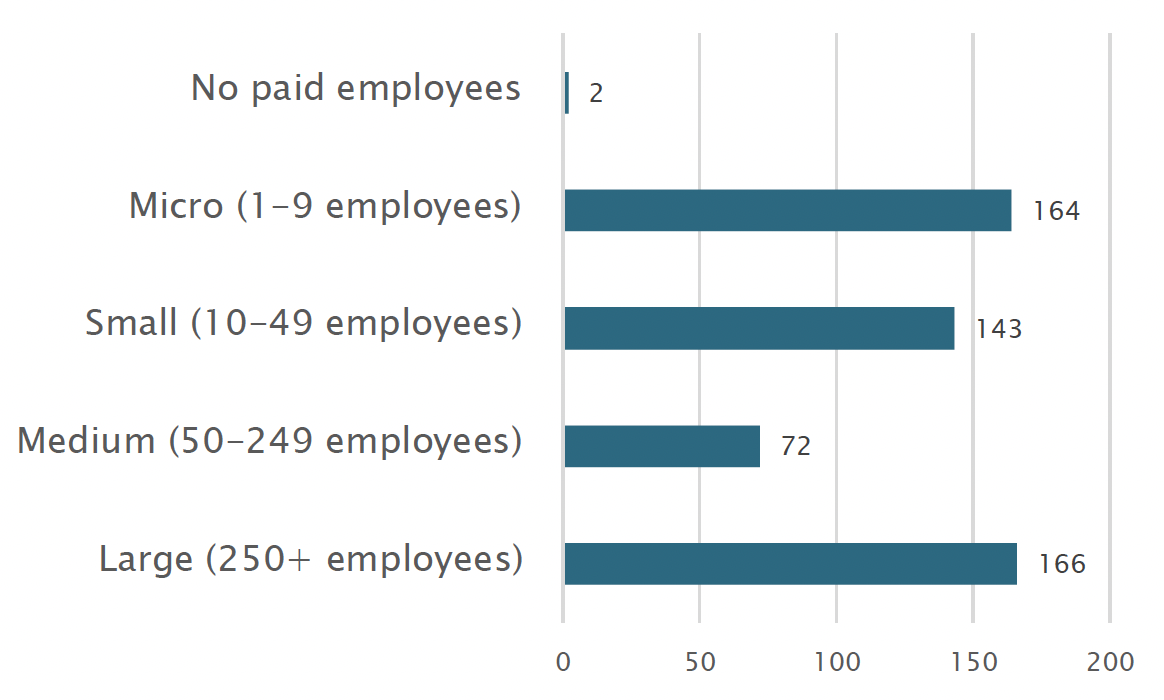
Size of organisation
Of the 547 responses, most (307, 56%) were either micro (164, 30%) or small organisations (143, 26%). Nearly a third (166, 30%) were from large organisations.
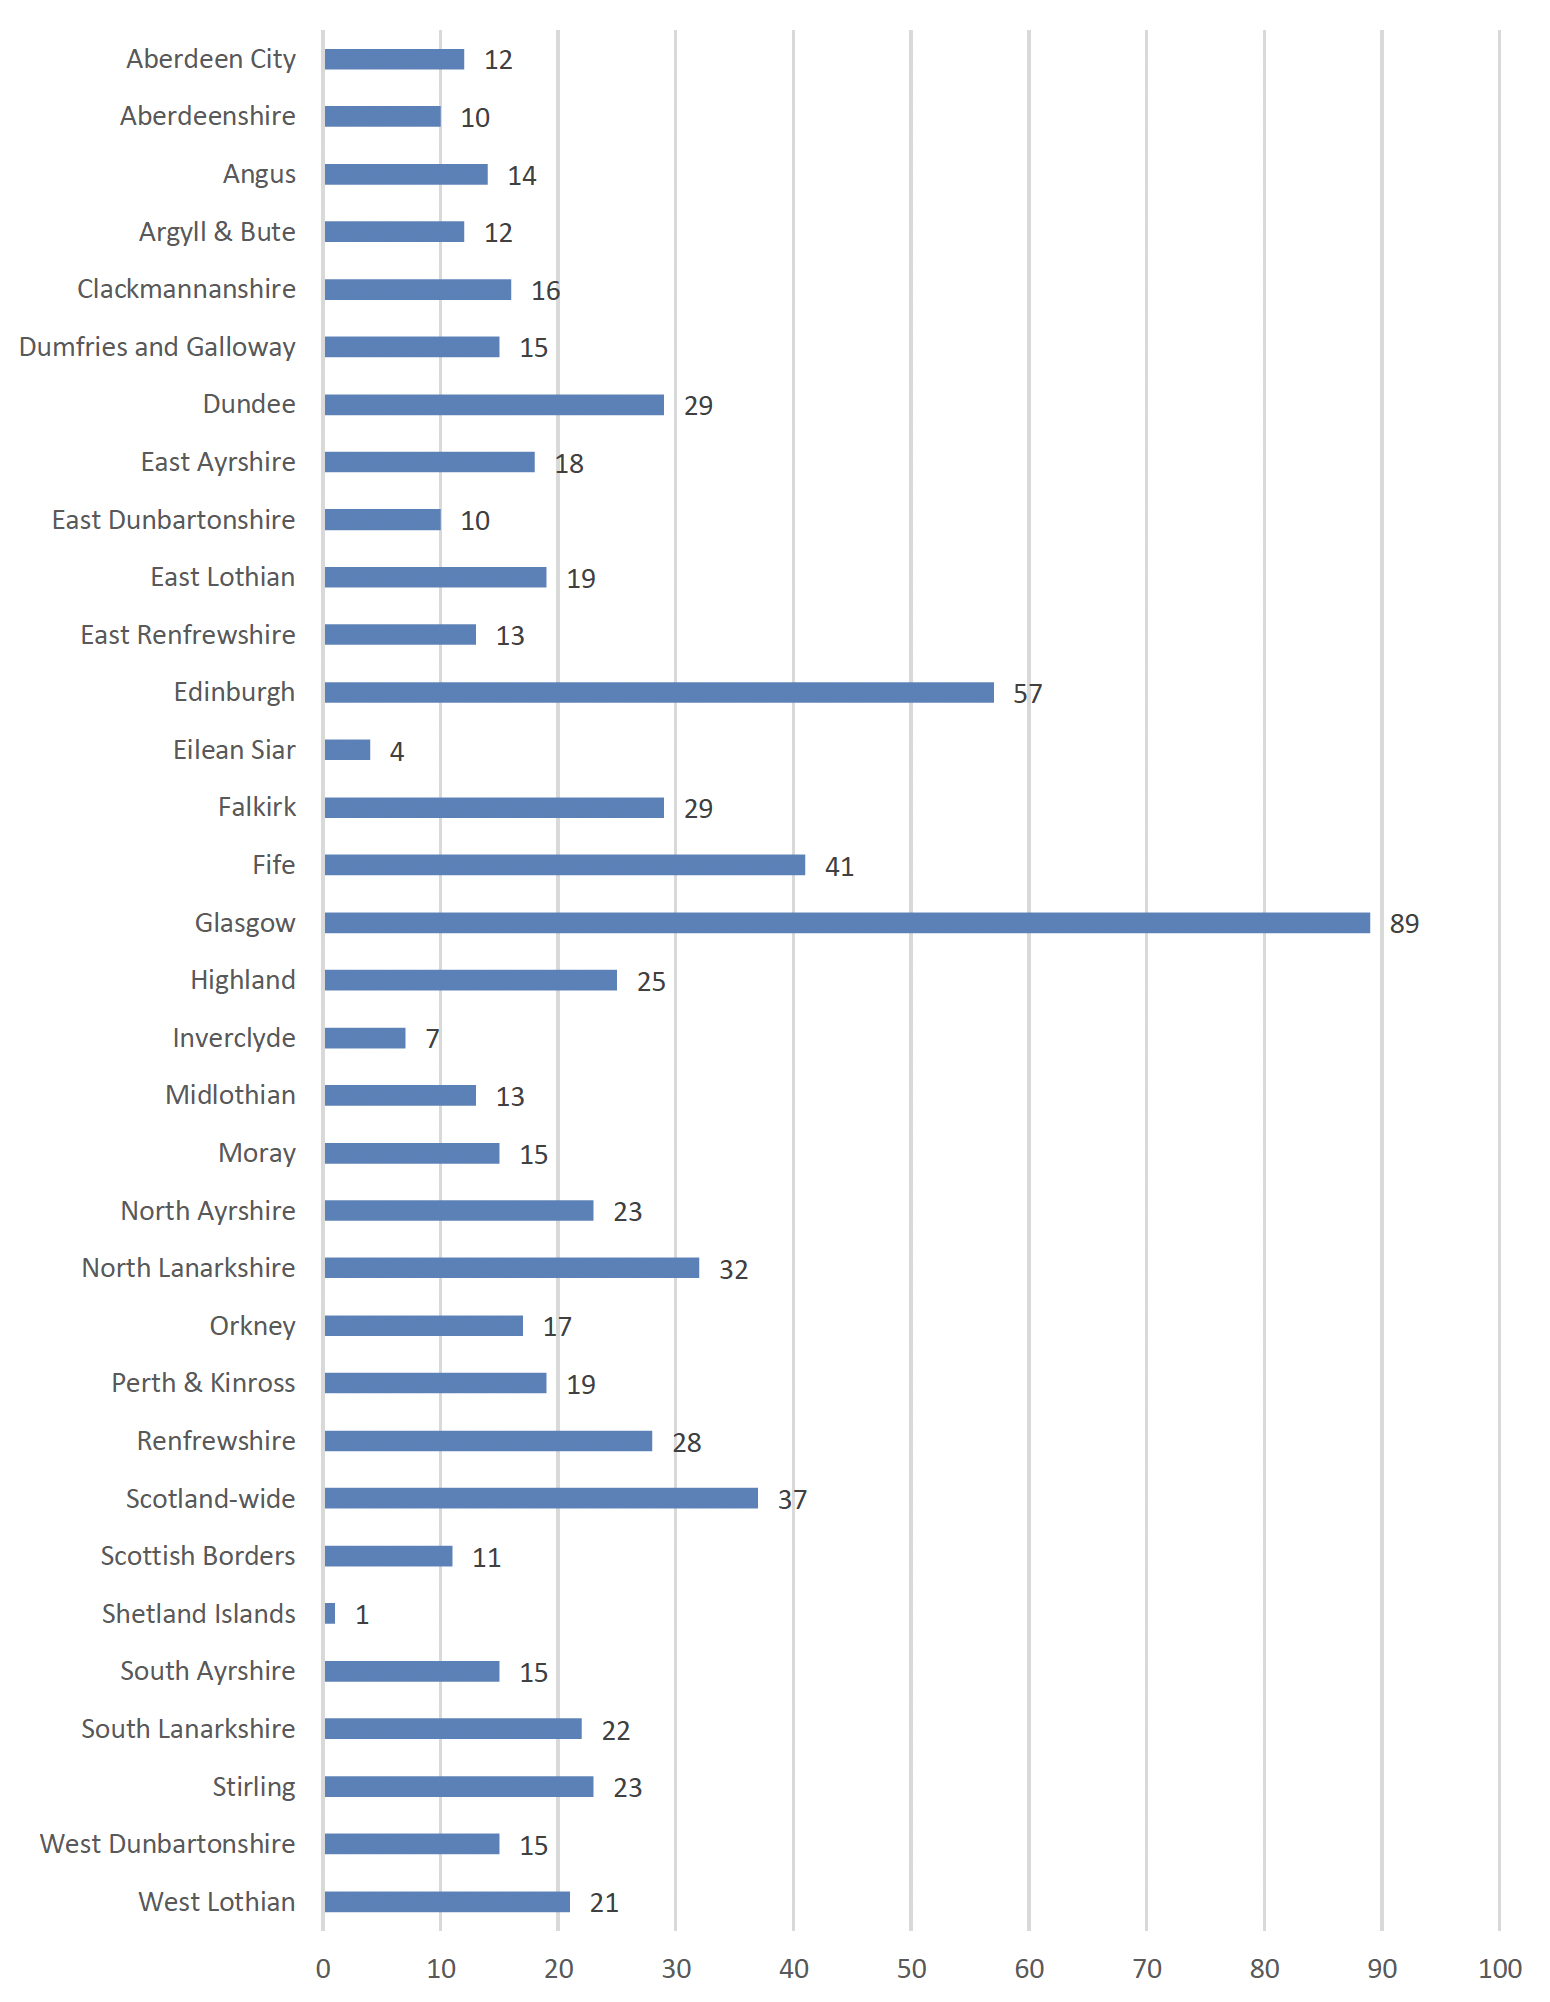
Location
Survey respondents were based across Scotland, with at least one response from each local authority area. Most worked in Glasgow (89, 16%), Edinburgh (57, 10%), Fife (41, 7%) or North Lanarkshire (32, 6%). (See over.)
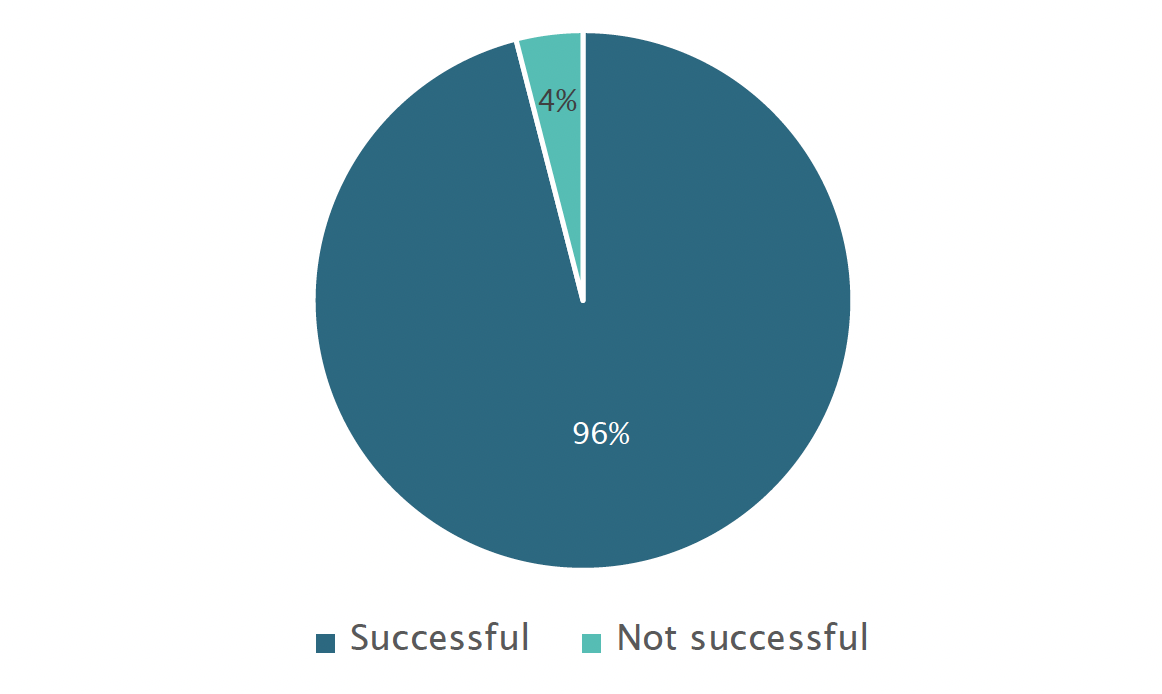
Application outcome
The vast majority of respondents (524, 96%) were successful with their application. Twenty-three (4%) were not.
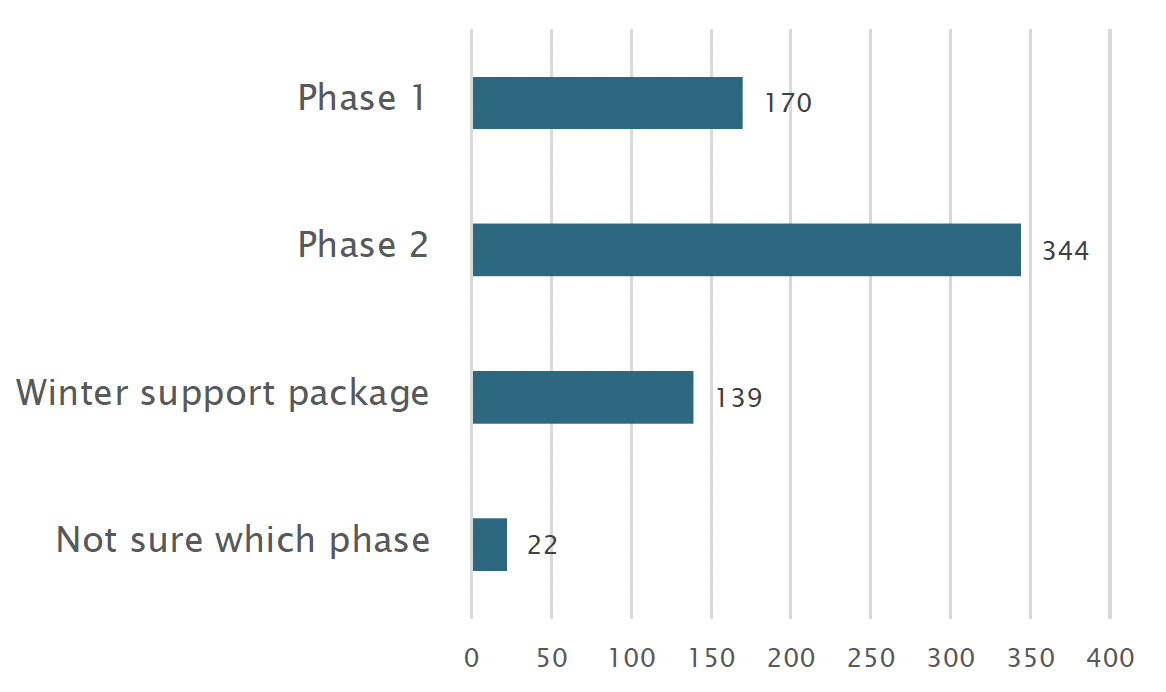
Phase
Of the 524 respondents that were successful with their application, most applied to phase 2 (66%). Just over a quarter (139, 27%) applied to the winter support package, 170 (32%) applied to phase 1 and 22 (4%) were not sure which phase they applied to.
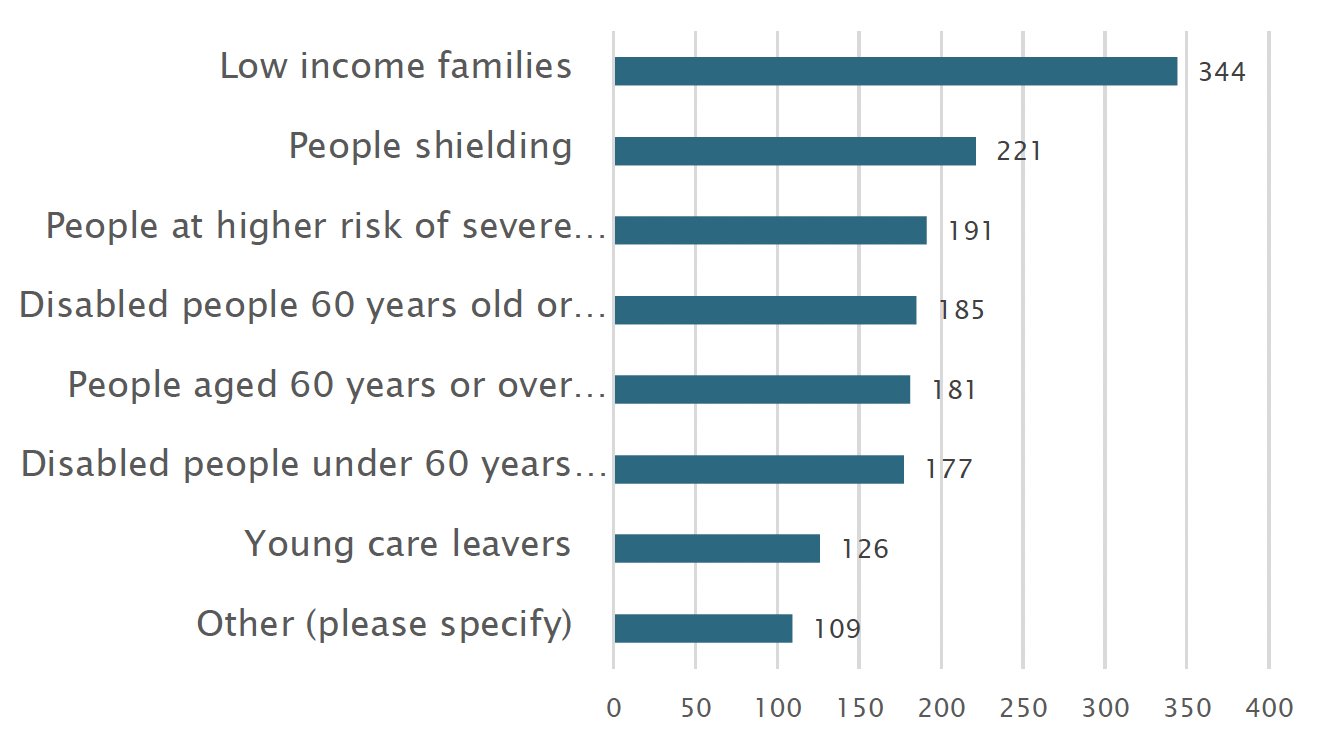
Type of participants
The 524 successful applicants supported a wide range of participants. The most common category was low income families (66%), followed by people shielding (221, 42%), people at higher risk of severe illness (191, 36%) and disabled people aged 60 years or over (185, 35%), people aged 60 years or over (not disabled) (181, 35%) and disabled people under 60 years old (177, 34%). One hundred and nine respondents (21%) reported that they supported another type of participants. These 'other' types were wide ranging and included young carers, people with substance use issues, people with mental health issues and homeless young people.
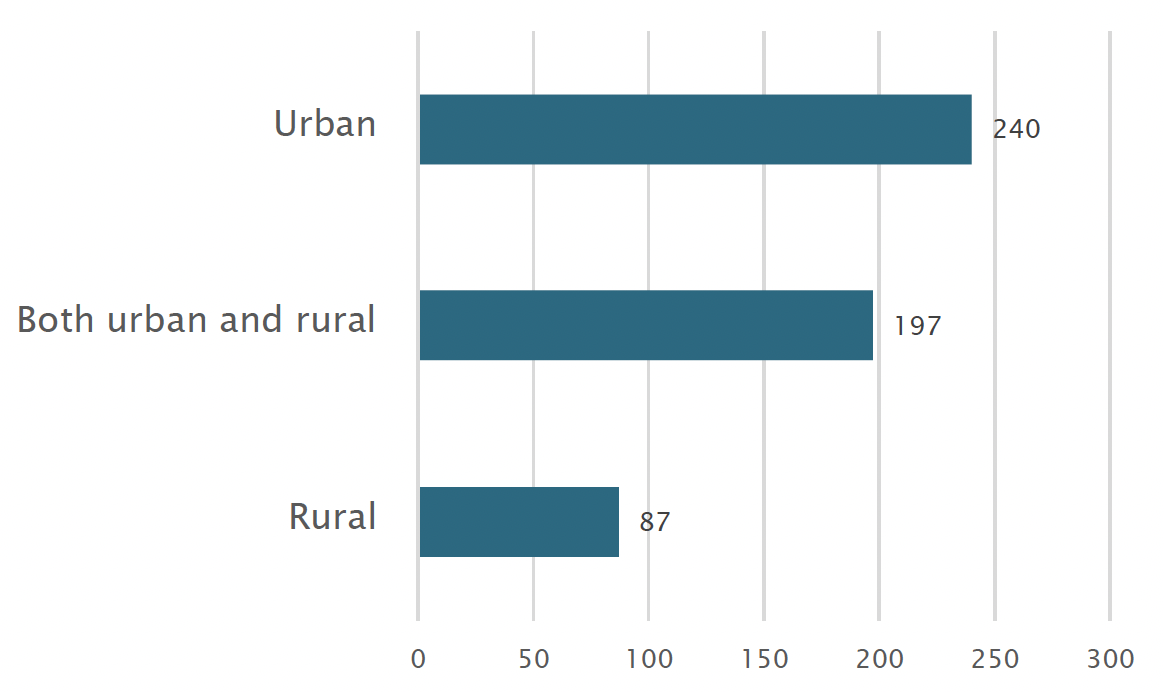
Urban/rural
Most respondents reported that their clients are based in urban locations (240, 46%), 87 (17%) said they were rural and 197 (38%) described their clients as both urban and rural.
Contact
Email: CSresearch@gov.scot