Aquaculture sector - wider economic impacts: estimates
This study provides the estimates of the direct, indirect and wider economic impacts of the Scottish aquaculture sector for 2018, including associated tax receipt estimates.
3. Survey Evidence
To estimate the direct economic impact of the aquaculture sector in Scotland, BiGGAR Economics drafted a survey to be sent to organisations and businesses in the sector. This section discusses the evidence emerged from the survey that was sent to companies and sectoral organisations across the aquaculture sector in Scotland.
3.1 The Survey
BiGGAR Economics drafted a survey to be sent to organisations and businesses in the sector. The survey avoided the replication of information that was already available to Marine Scotland through their annual surveys of finfish and shellfish producers. A first draft of the survey was sent to Marine Scotland for review, comments were then addressed and the survey finalised.
The survey was circulated in January 2020. The decision to circulate after the Christmas period was taken jointly with Marine Scotland to account for the increase in activity and demand that the sector experiences prior to Christmas.
The survey was sent to the following organisations and businesses:
- British Trout;
- Association of Scottish Shellfish Growers;
- Scottish Sea Farms;
- Scottish Salmon Company;
- Mowi;
- Loch Duart;
- Grieg Seafood Shetland;
- Wester Ross Salmon; and
- Cooke Aquaculture.
Once sent, the survey was then followed up either by telephone, email or both to increase take-up and ensure that companies and organisations across Scottish aquaculture were fully aware of this exercise.
3.2 Survey Respondents
This engagement resulted in the following four companies filling in the survey:
- Mowi;
- Loch Duart;
- Scottish Sea Farms; and
- Scottish Salmon Company.
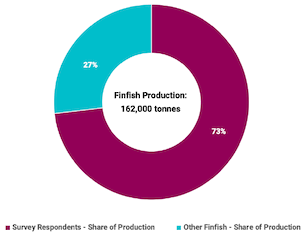
In 2018 these companies represented around 73% of finfish production in Scotland[2]. Their share of employment and turnover with respect to the finfish sector was similar. The type of expenditure undertaken by these companies was considered to be similar to that of other finfish production. For instance, fish feed costs would constitute a large share of spending of both salmon and trout producers.
Source: BIGGAR Economics
The survey respondents were active across a wide range of activities within the aquaculture sector, including:
- salmon farming;
- hatcheries;
- processing; and
- headquarter activities.
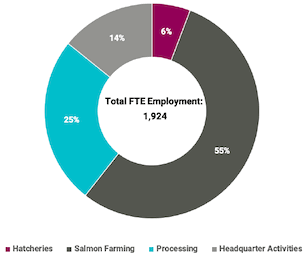
Salmon farming accounted for over 55% of the 1,924 jobs supported by these companies in 2018. Around 25% of total employment was in processing and the remainder was in headquarter activities (14%) and hatcheries (6%). Most of the processing activity supported by the companies surveyed was primary processing, as this processing (e.g. heading and gutting) tended to take place close to the farm sites. Spending in processing activity by these producers provided a reliable approximation of expenditure patterns in the broader processing of aquaculture products.
Source: BIGGAR Economics Analysis
Overall, the survey responses provided a good approximation of expenditure patterns across the finfish sector and aquaculture processing. Survey evidence was then complemented with the evidence collected through consultations and available literature for other aspects of the aquaculture sector.
3.3 Supply Spending
In 2018 the companies which responded to the survey spent a total £562.7 million in goods and services to support their activities. This included spending on capital goods such as the construction of new farms and plants or the purchases of specialised equipment.
To avoid double-counting supply spending, companies were asked to provide spending data exclusive of any transactions taking place within the same business. Expenditure would have been counted twice, if the value of the fish farmed and then processed within the same company had been included in the analysis.
Companies were asked to provide spending details on a range of items. These were then mapped to the relevant Standard Industrial Classification (SIC) level 2 codes, where possible. For reporting purposes spending was, however, aggregated at the industrial sections level.
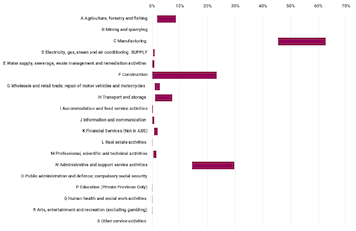
This found that that in 2018 50.5% of spending from the survey respondents was within the manufacturing sector. This captures the relative importance of fish feed within the supply chain of the companies surveyed. The manufacture of fish feed accounted for 72% of all surveyed spending within the manufacturing sector[3].
In 2018, survey respondents spent £245.3 million in products and services from the agriculture, forestry and fishing (3.7%), construction (14.9%), transport (5.4%) and administrative and support services (19.4%) sectors.
Spending in the aquaculture sector was mostly linked to the purchase of fingerlings, while construction spending included most capital expenditure. Spend on administrative and support activities included insurance, consultancy and accounting.
| Sector | Share |
|---|---|
| Agriculture, forestry and fishing | 3.7% |
| Mining and quarrying | 0.0% |
| Manufacturing | 50.5% |
| Electricity, gas, steam and air conditioning SUPPLY | 0.7% |
| Water supply, sewerage, waste management and remediation activities | 0.4% |
| Construction | 14.9% |
| Wholesale and retail trade; repair of motor vehicles and motorcycles | 1.9% |
| Transport and storage | 5.4% |
| Accommodation and food service activities | 0.1% |
| Information and communication | 0.2% |
| Financial Services (Not in ABS) | 1.4% |
| Real estate activities | 0.0% |
| Professional, scientific and technical activities | 1.1% |
| Administrative and support service activities | 19.4% |
| Public administration and defence; compulsory social security | 0.0% |
| Education (Private Provision Only) | 0.1% |
| Human health and social work activities | 0.0% |
| Arts, entertainment and recreation (excluding gambling) | 0.1% |
| Other service activities | 0.0% |
| Total Reported Supply Spend (£ million) | 562.7 |
Source: BiGGAR Economics Analysis
Across the companies surveyed there was some variation in the share of their spending benefitting any given sector. For all respondents, the largest area of supply chain expenditure was within the manufacturing sector. Expenditure in manufacturing ranged between 45% and over 63%.
The largest difference in supply expenditure was recorded over construction spending, which ranged between 23% and 0% of respondents’ spending. This reflected the different stages the companies were at in the capital investment cycle.
The spread was largest across the main sectors of supply spending as shown in Figure 3‑3. Variation in expenditure is expressed as the distance between the maximum and minimum share of spending.
Source: BiGGAR Economics Analysis
Based on the information provided, it was possible to estimate supply chain expenditure per Full-Time Equivalent (FTE) job supported. This ranged between £530,000 per FTE and £750,000 per FTE.
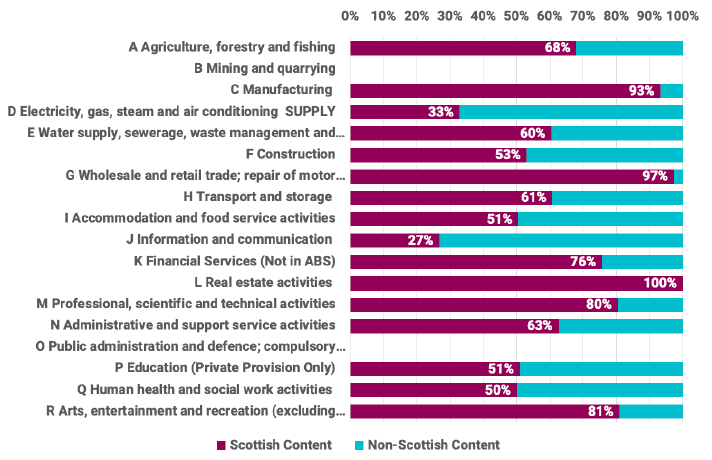
Survey respondents also provided data on the share of expenditure taking place in Scotland. It was estimated that in 2018 producers spent £437.6 million in Scotland. This is shown in Figure 3‑4. Among the main sectors of spending, construction had the least Scottish content (53%). Around 93% of spending in manufacturing took place in Scotland.
The manufacturing spend included spending on fish feed, the main variable cost for companies producing Atlantic salmon[4]. While fish feed is purchased from Scottish suppliers, its production relies on raw materials that are often sourced from outside the UK. Analysis of the Input-Output tables suggests that around 61% of intermediate use (supplies) for this sector are imported. The main inputs in the production of fish feed for salmonidis include fish oil, fish meal, rapeseed oil, soy meal and wheat[5].
Source: BiGGAR Economics Analysis
3.4 Summary of Survey Evidence
The four respondents to the survey constituted around 72% of finfish production in 2018 and therefore provided a comprehensive insight into the sector’s supply chain. Similarly, the respondents also provided data on their processing activity which can be used to estimate the supply chain activities of other processors. Manufacturing, fishing, transport, administrative and support activities and construction were the sectors where most of supply spending took place. The largest opportunity for the Scottish supply chain was manufacturing of fish feed production, whereas construction and parts of manufacturing equipment tended to take place outside of Scotland.