We use cookies to collect anonymous data to help us improve your site browsing
experience.
Click 'Accept all cookies' to agree to all cookies that collect anonymous data.
To only allow the cookies that make the site work, click 'Use essential cookies only.' Visit 'Set cookie preferences' to control specific cookies.
Annual report setting out the progress made in the last 12 months by national government, local government and third sector partners against actions in the Ending Homelessness Together action plan.
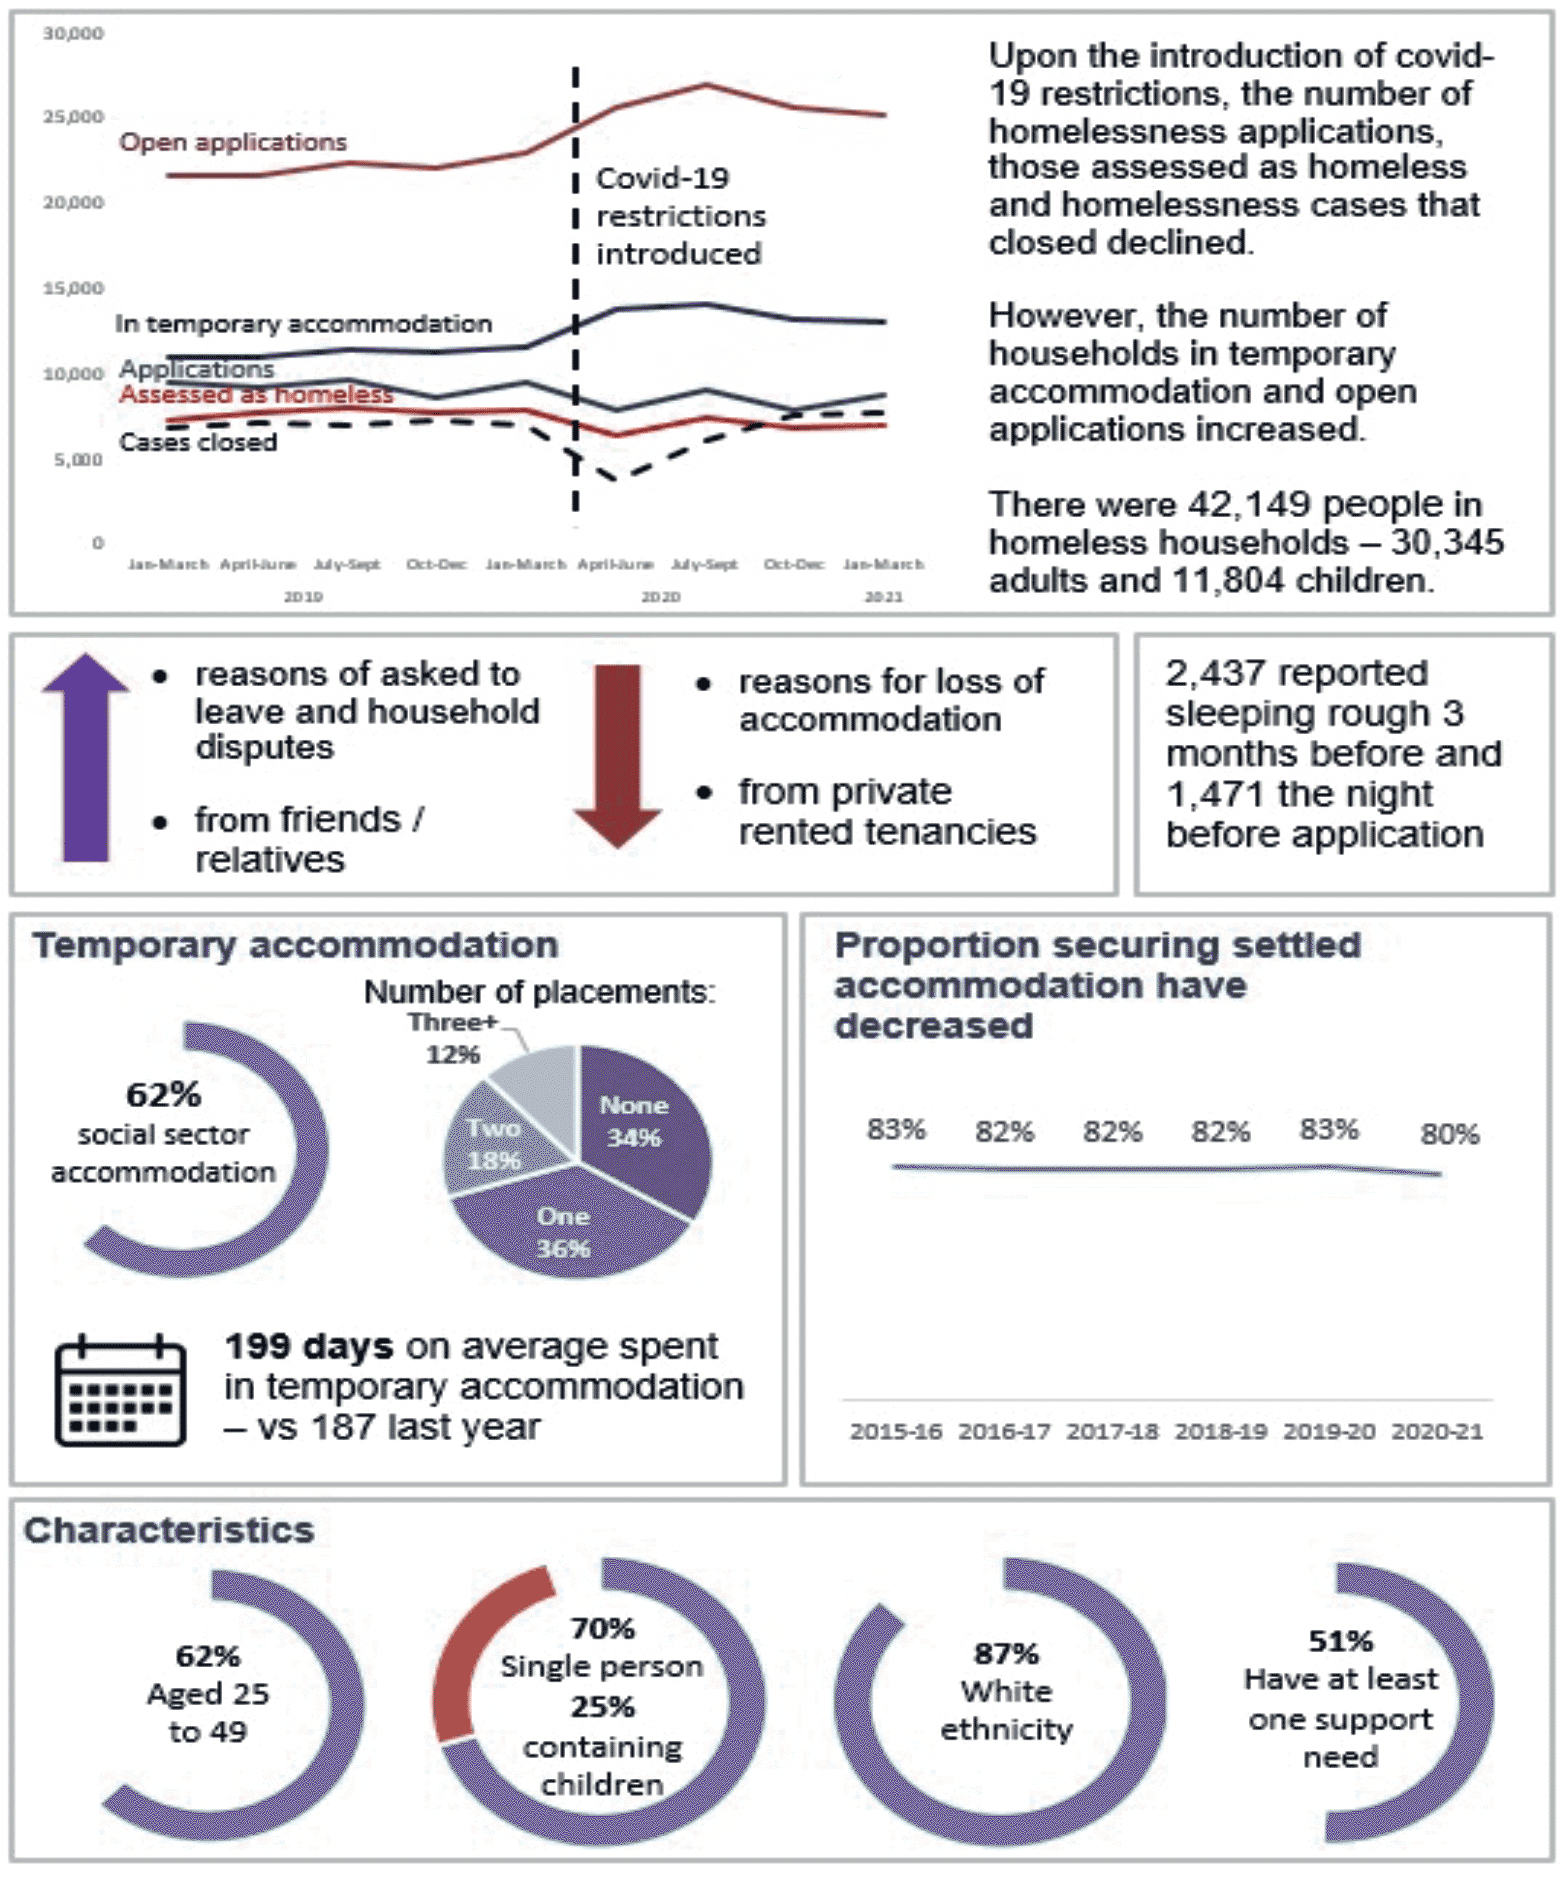
The Scottish Government's latest homelessness statistics remind us why our commitment to end homelessness is so important.
The emergency measures we put in place to protect tenants from eviction has contributed to a 42 per cent reduction in homelessness applications from people in the private rented sector compared to 2019/20.
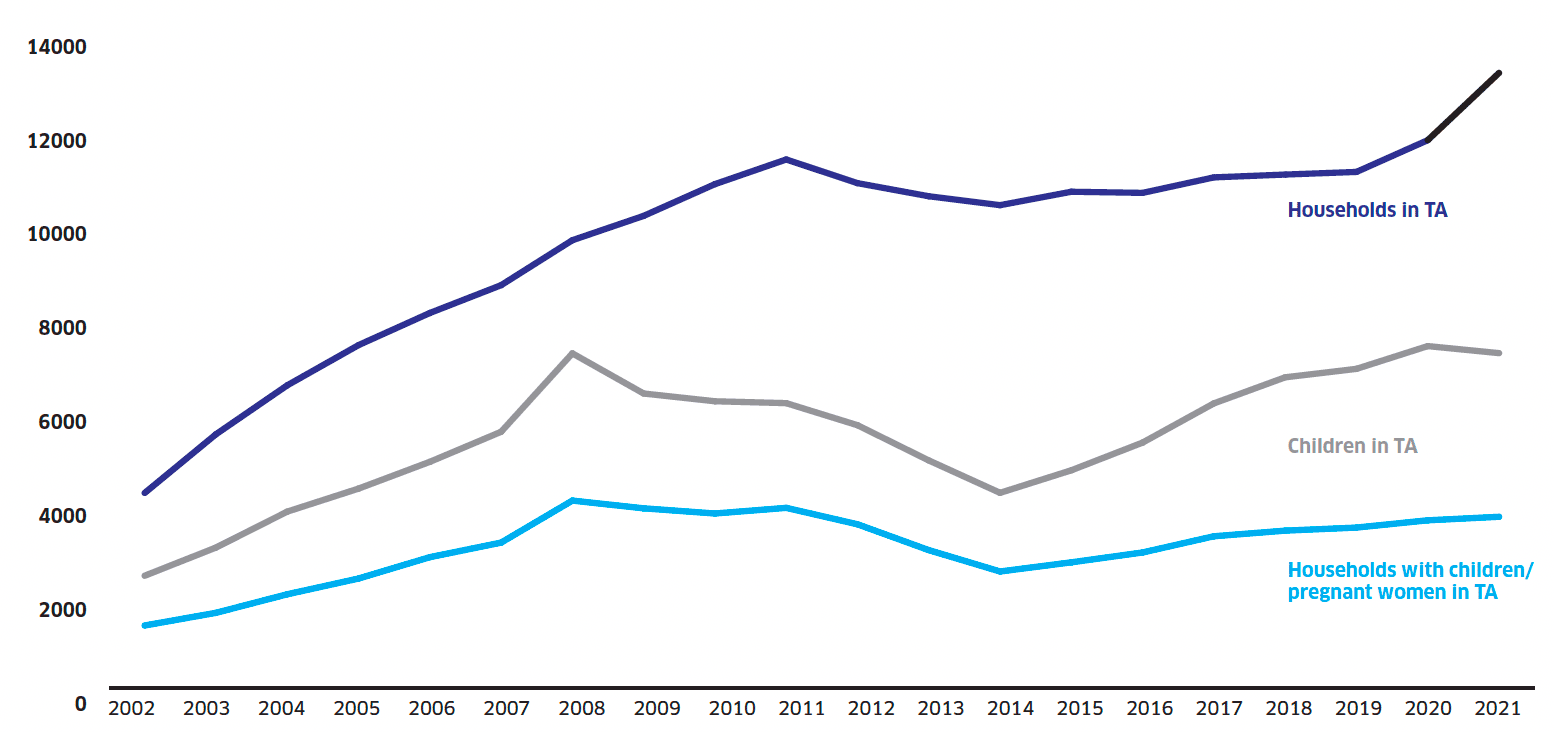
Throughout the pandemic, our priority has been to keep people safe from coronavirus. Although this has contributed to an increase in the numbers in temporary accommodation, we are starting to see reductions in number of open homeless cases and in the number of households in temporary accommodation since peaks in August 2020.
And while we do not collect and publish data on the number of people sleeping rough, the statistics show that a smaller proportion of those making homelessness applications reported sleeping rough in the three months prior to their application when compared with last year.
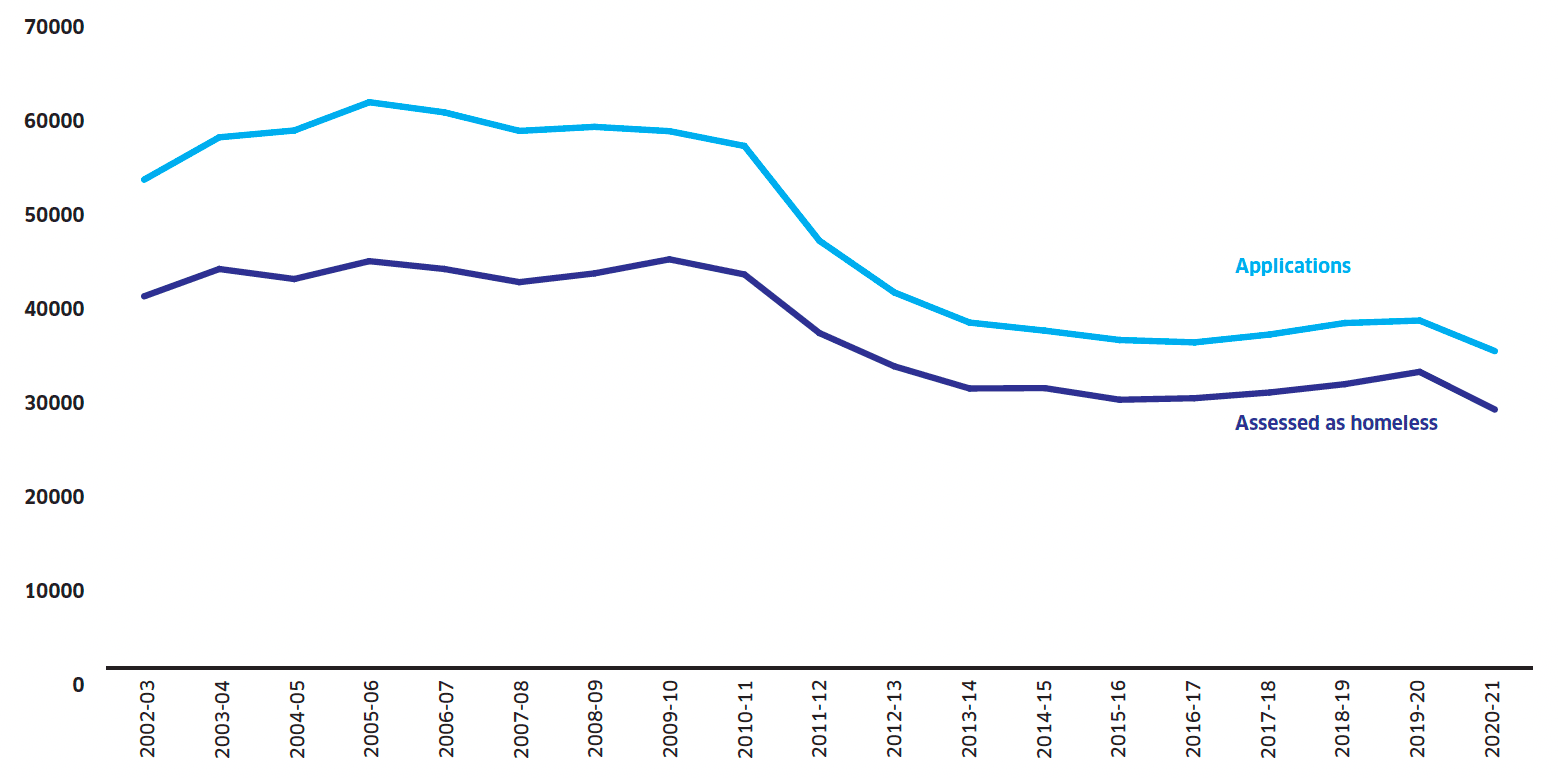
Figure 1: Number of applications and those assessed as homeless: 2002-03 to 2020-21
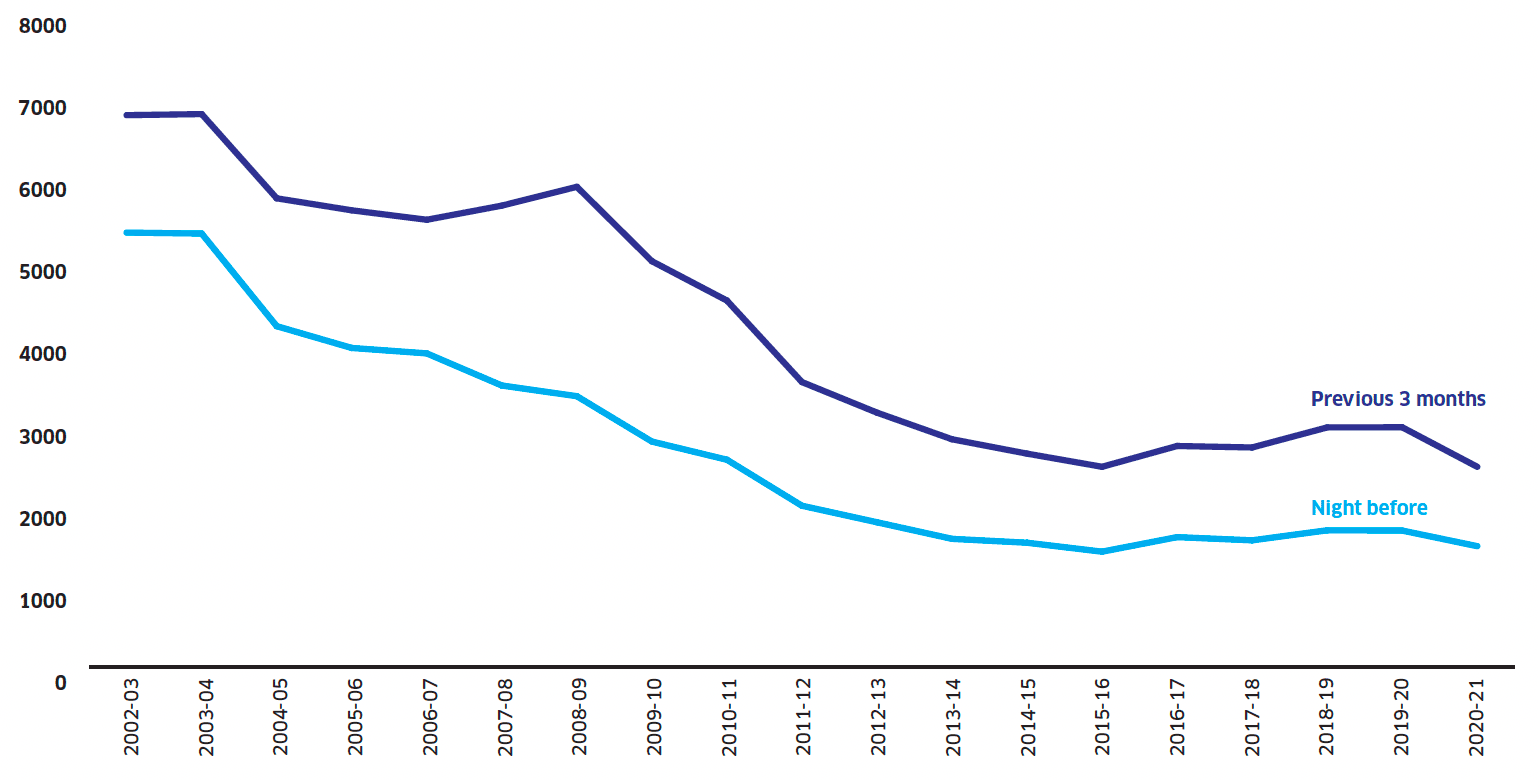
Figure 2: Households where at least one household member experienced rough sleeping the night before their application and in the three months prior to their application
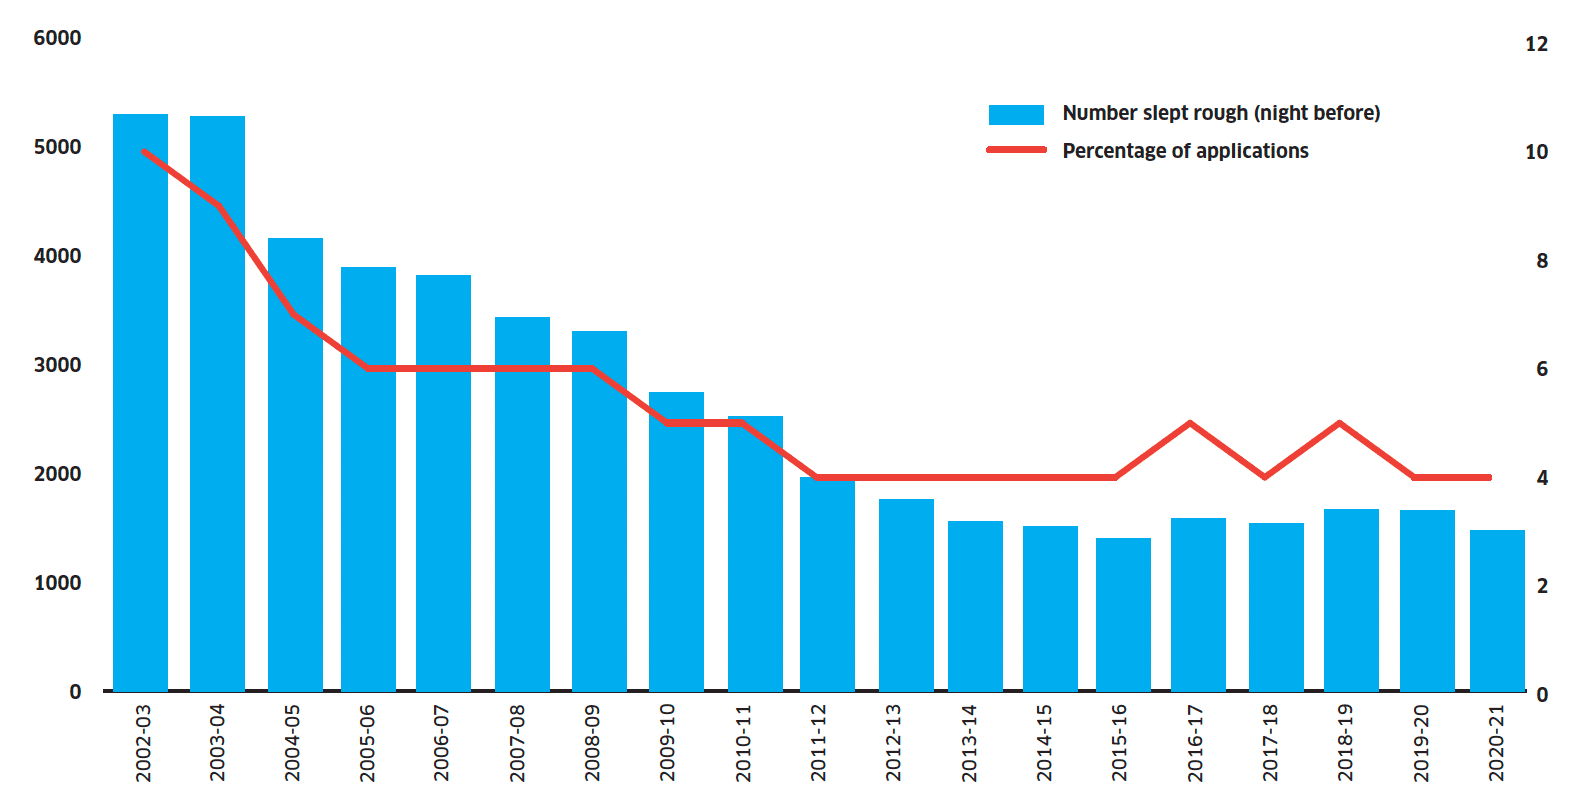
Figure 3: Rough sleeping the night before application: 2002-03 to 2020-21
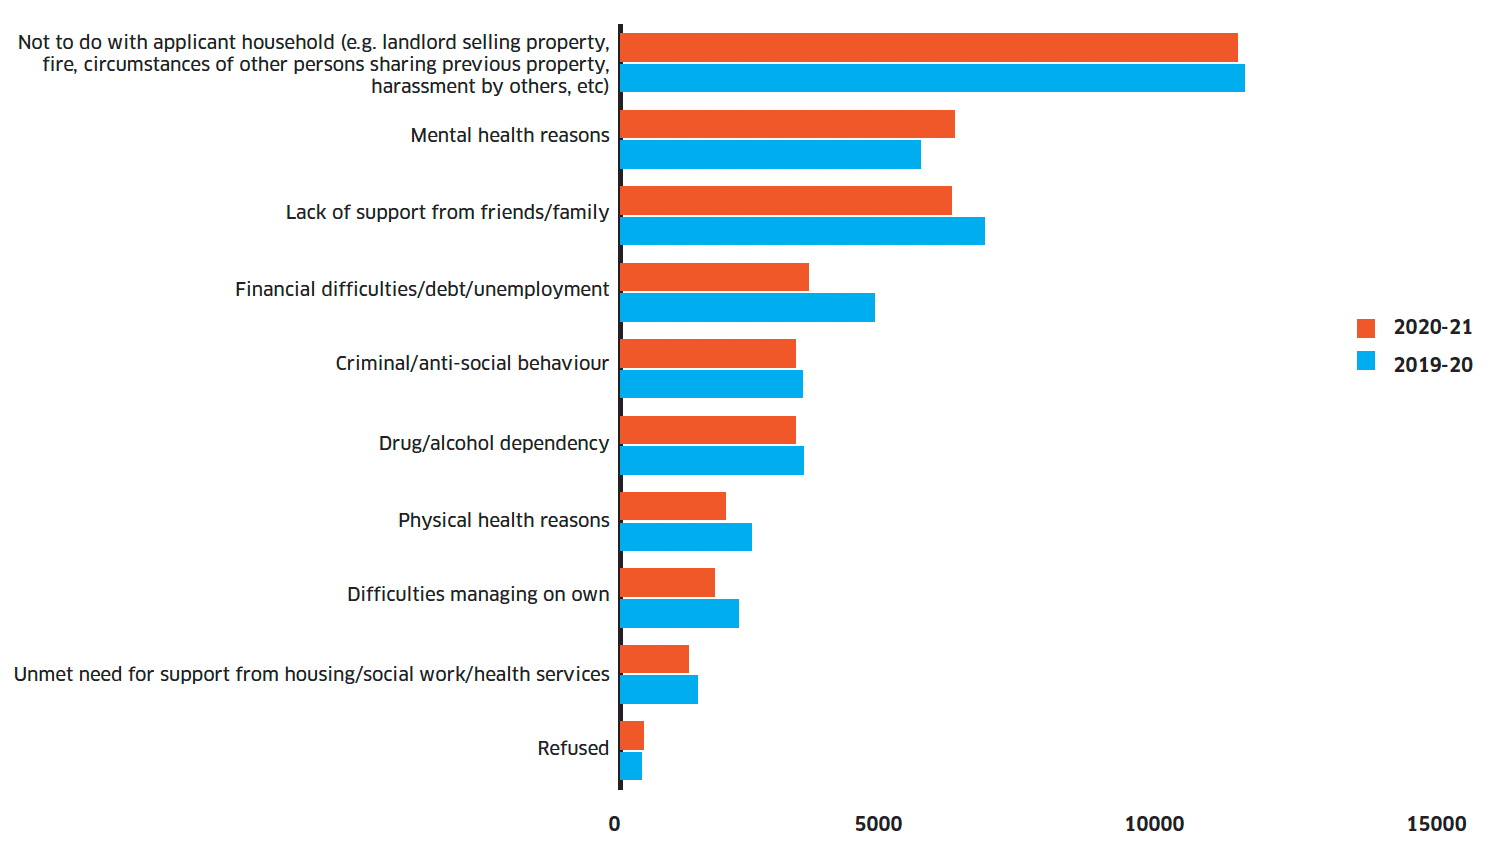
Figure 4: Main reason for making a homelessness application: 2020-21
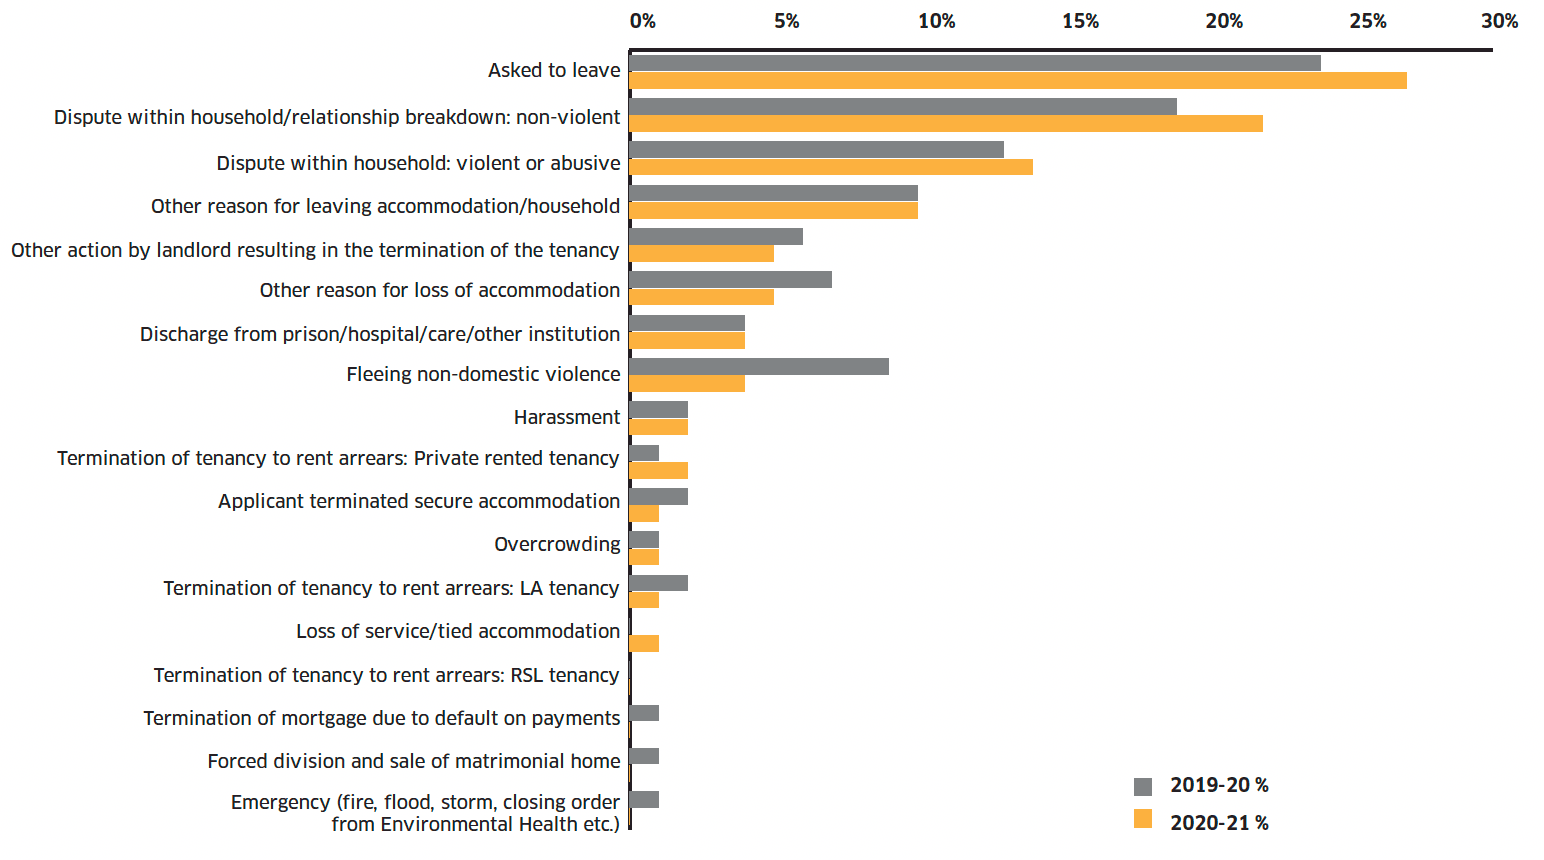
Figure 5: Reasons for failing to maintain accommodation, 2019-20 and 2020-21
Table 1: Property type from which the household became homeless: 2019-20 to 2020-21
2019-20
2020-21
All assessed as homeless
31,581
27,571
Own property - LA tenancy
2,877
2,600
Own property - RSL tenancy
1,541
1,490
Own property - private rented tenancy
5,145
2,984
Own property - tenancy secured through employment / tied house
218
229
Own property - owning / buying
1,096
929
Own property - Shared ownership / Shared equity / LCHO
26
22
Parental / family home / relatives
7,626
8,159
Friends / partners
5,601
5,929
Lodger
406
287
Armed services accommodation
47
30
Prison
1,756
1,574
Hospital
229
146
Childrens residential accommodation (looked after by the local authority)
41
40
Shared Property – Private Rented Sector
143
85
Shared Property – Local authority
40
32
Shared Property - RSL
47
51
Supported accommodation
1,456
746
Hostel (unsupported)
98
69
Bed & Breakfast
41
84
Caravan / mobile home
132
123
Long-term roofless
157
120
Long-term "sofa-surfing"
743
662
Other
861
682
Not known / refused
1,254
498
Table 2: Property type from which the household became homeless, as a proportion of all households assessed as homeless: 2019-20 to 2020-21
All assessed as homeless
2019-20
2020-21
100%
100%
Own property - LA tenancy
9%
9%
Own property - RSL tenancy
5%
5%
Own property - private rented tenancy
16%
11%
Own property - tenancy secured through employment / tied house
1%
1%
Own property - owning / buying
3%
3%
Own property - Shared ownership / Shared equity / LCHO
0%
0%
Parental / family home / relatives
24%
30%
Friends / partners
18%
22%
Lodger
1%
1%
Armed services accommodation
0%
0%
Prison
6%
6%
Hospital
1%
1%
Childrens residential accommodation (looked after by the local authority)
0%
0%
Shared Property – Private Rented Sector
0%
0%
Shared Property – Local authority
0%
0%
Shared Property - RSL
0%
0%
Supported accommodation
5%
3%
Hostel (unsupported)
0%
0%
Bed & Breakfast
0%
0%
Caravan / mobile home
0%
0%
Long-term roofless
0%
0%
Long-term "sofa-surfing"
2%
2%
Other
3%
2%
Not known / refused
4%
2%
Table 3: Support needs of households assessed as homeless: 2019-20 and 2020-21
2019-20
2020-21
Mental health problem
8,404
7,397
Learning disability
932
736
Physical disability
1,839
1,246
Medical condition
3,091
2,405
Drug or alcohol dependency
3,560
3,248
Basic housing management / independent living skills
7,395
7,113
At least one support need
16,204
14,106
Figure 6: Number of households in temporary accommodation as at 31 March, by local authority: 2002 to 2021
Table 4: Temporary accommodation type: 2020-21
All households
Social sector accommodation
Hostel
Bed & Breakfast
Other
Total
8,840
710
1,130
2,415
13,095
Households with pregnant women/children
Social sector accommodation
Hostel
Bed & Breakfast
Other
Total
2,795
0
20
830
3,645
Table 5: Number of temporary accommodation placements: 2020-21
None
One
Two
Three
Four
Five+
All
All
8,720
9,470
4,595
1,520
645
955
25,905
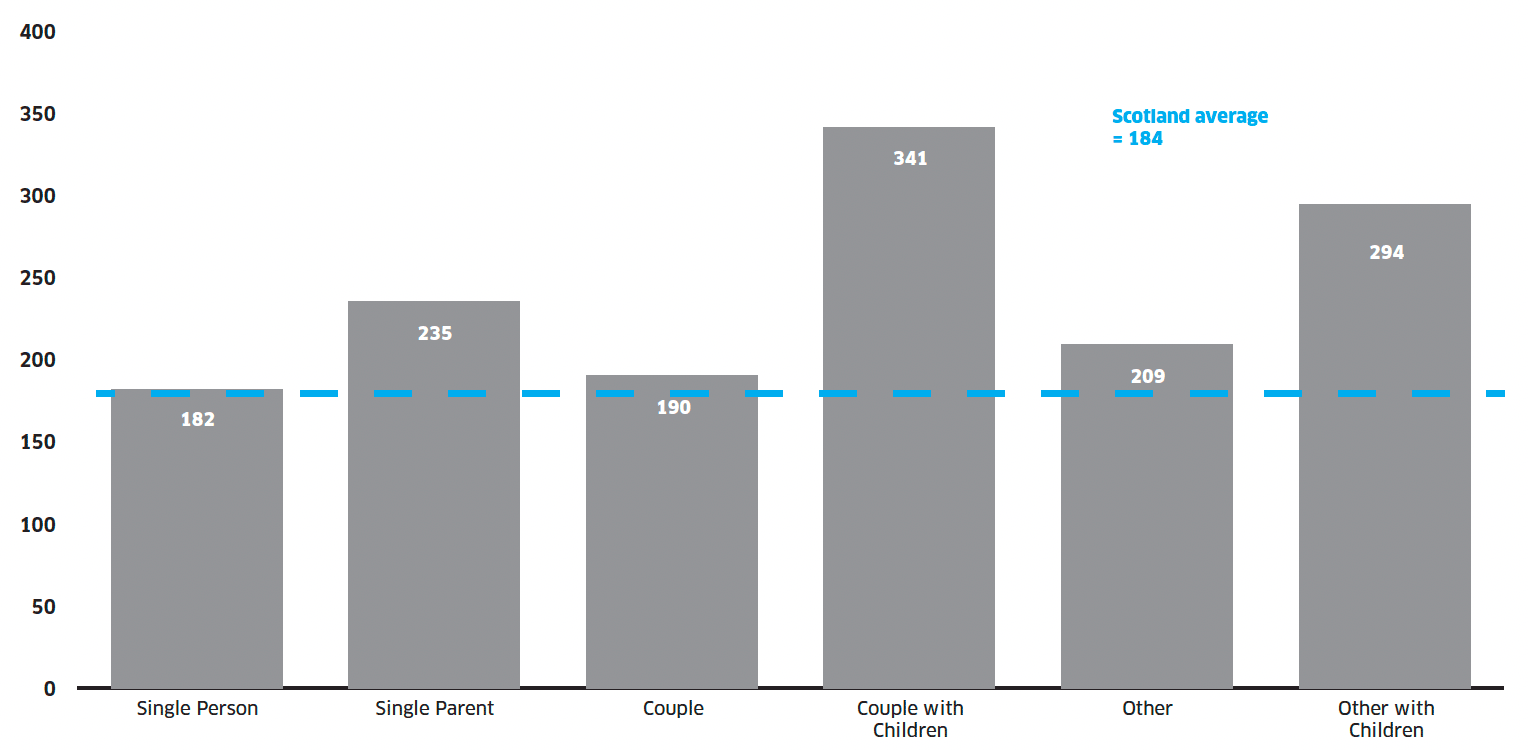
Figure 7: Average number of days in temporary accommodation, 2020-21
Table 6: Number of temporary accommodation placements that have been in breach of the Unsuitable Accommodation Order, by local authority: 2018-19 to 2020-2021
2018-19
2019-20
2020-21
Apr-Jun
July-Sept
Oct-Dec
Jan-Mar
Apr-Jun
July-Sept
Oct-Dec
Jan-Mar
Apr-Jun
July-Sept
Oct-Dec
Jan-Mar
Scotland
200
175
155
110
110
110
170
125
40
185
160
105
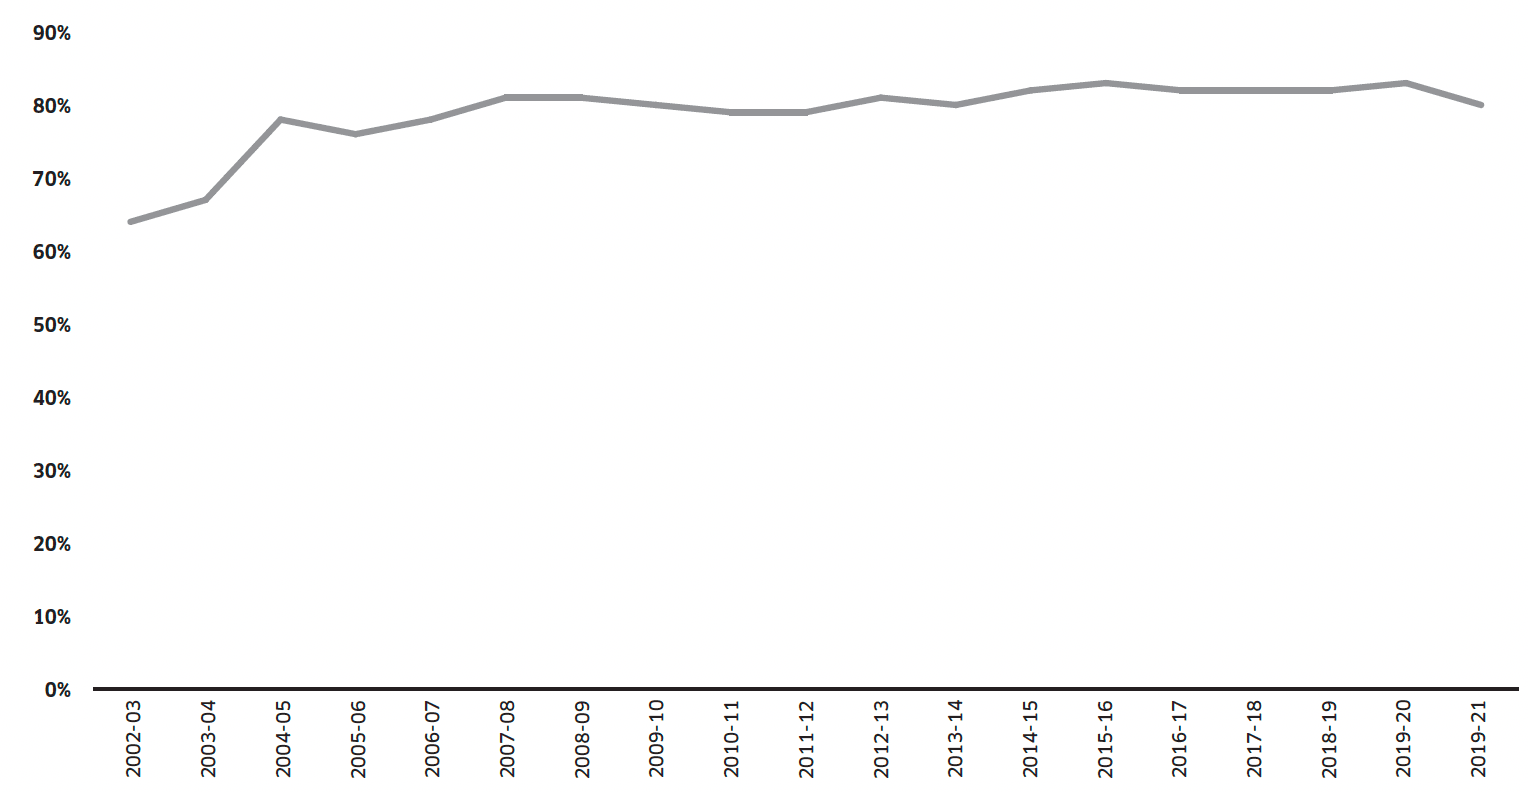
Figure 8: Proportion of unintentionally homeless households securing settled accommodation: 2002/03 to 2020/21
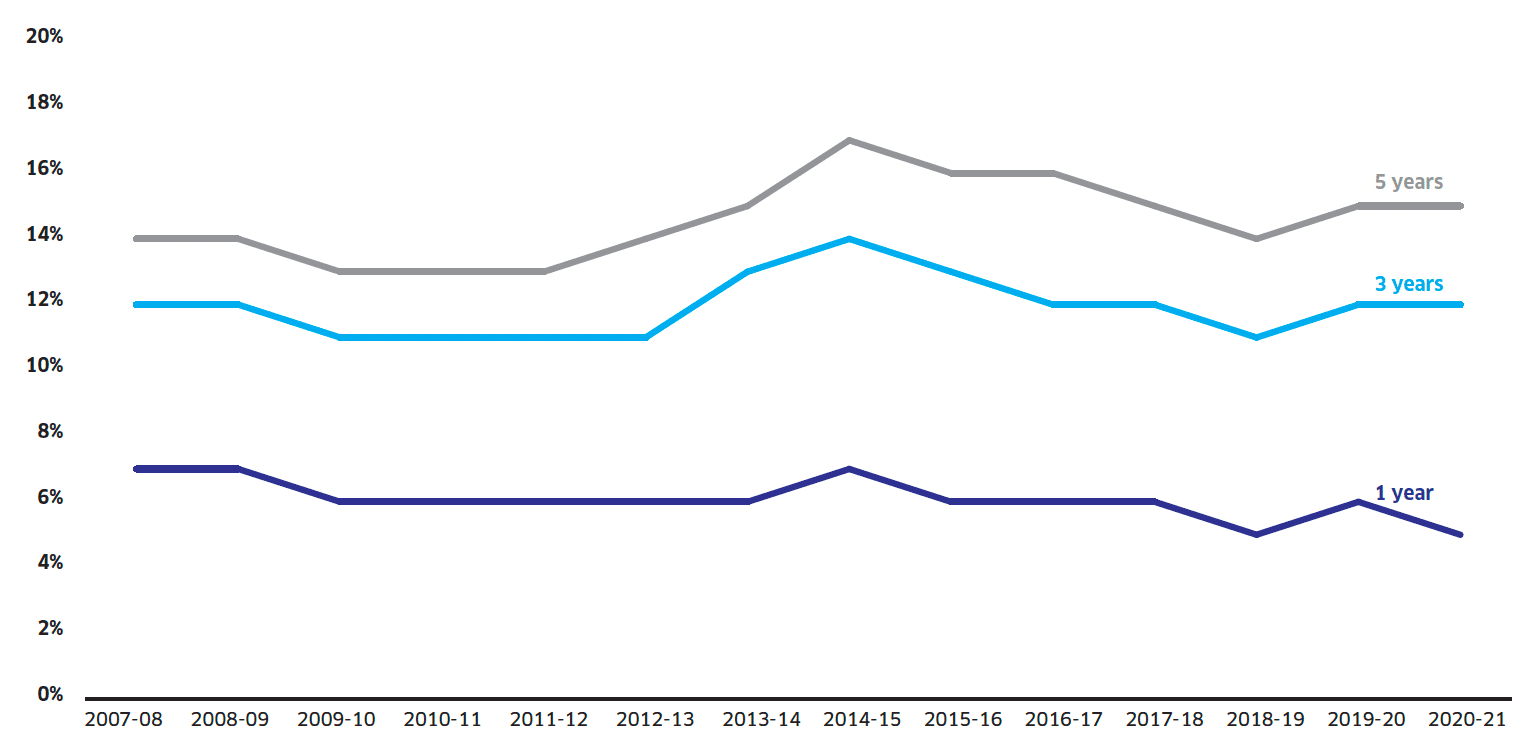
Figure 9: Households assessed as homeless that have previously been assessed as homeless in the previous one, three and five years