Education and Skills Impact Framework (ESIF) - university provision: contextual summary report 2022
This analysis uses longitudinal education outcomes data to estimate labour market outcomes and returns to investment associated with post-school qualifications. A technical report describes the methodology and findings in detail. This summary report covers university qualifications.
Return on investment
Introduction
The analysis assesses the Return on Investment (ROI) associated with Scottish domiciled individuals who started qualifications at universities in Scotland in the 2018-19 academic year. This involves the estimation of benefits and costs associated with each level of qualification, at the individual and exchequer level.
Using the marginal earnings and employment returns presented in section 4, Return on Investment (ROI) to each qualification was estimated for the cohort of students beginning their studies in AY 2018-19. Lifetime earnings were estimated for qualifiers and the control group. For postgraduate taught and research qualifications, the control group was individuals with a first degree. For qualifiers with a first degree the control group was students who began but did not finish a first degree. Lifetime earnings are estimated by combining earning figures from LEO, earning growth rates from the Labour Force Survey (LFS) and
marginal earning and employment figures presented in section 6. Comparison of lifetime earnings between learners achieving the qualification and the control group provided an estimate of the increase in gross lifetime earnings from completing a qualification. This provided the basis to calculate the net benefit to both the qualifier and exchequer based on the total costs and benefits unique to each. Results are disaggregated by qualification type and sex, reflecting the characteristics of a typical learner within those groups. Calculations apply to Scottish domiciled students living anywhere in the UK after completion of their studies.
Results presented are net present values (NPVs) calculated using discount and inflation rates from the HM Treasury Green Book and Office for Budget Responsibility (OBR) forecasts, respectively.
Changes to economic conditions, such as inflation, may alter the estimated return on investment to qualifications.
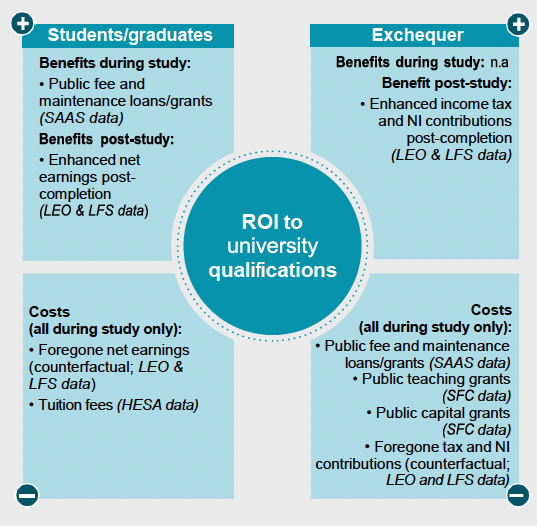
The approach to estimating costs and benefits for the ROI model is summarised in Figure 1 below.
Individuals
Table 12 presents return on investment expressed as lifetime net benefit per learner and benefit-to-cost ratios associated with the completion of each qualification. The ROI estimates are net present values, representing the difference in life timeearnings (after costs) between individuals who complete a qualification and the control group. For example, a typical man whose highest qualification is a first degree is estimated to earn £81,780 more than a comparable individual who started but did not complete a qualification at that level. This is equivalent to a benefit to cost ratio of 2.6 to 1 for the individual – in other words a man completing a first degree qualification receives an average additional return of £2.60 for every pound that he spends on gaining the qualification (compared with a non-completer).
| Qualification | ||||
|---|---|---|---|---|
| Net benefit per learner £ (NPV in 2018-19 Benefit-to-cost ratio prices) |
||||
| Men | Women | Men | Women | |
| PG (research)* |
£68,899 |
£9,700 |
2.3 |
1.2 |
| PG (taught)* |
£71,519 |
£67,866 |
5.1 |
4.8 |
| First degree |
£81,780 |
£42,305 |
2.6 |
1.9 |
*Counterfactual is graduates with a first degree.
Key findings:
- Each qualification considered is associated with a positive net present value for the qualifier. Typical graduates from each qualification are estimated to have higher earnings (net costs) than the control group.
- The net present value of each qualification is higher for men than for women. While women have a higher % increase in earnings from qualifying with a first degree or taught postgraduate, men earn more at each level in absolute terms, and this is reflected in the net benefit to learners.
- The methodology assumes that university students forego all earnings during their studies. This is likely to represent an overestimate of the costs to an individual of obtaining a qualification at university and as such returns presented here may be underestimates.
Exchequer
Table 13 presents the ROI to the Scottish Exchequer (the net return to public investment). The return on investment to the Exchequer represents the difference in exchequer income between qualifiers and the relevant control group, over an individual's lifetime. For example, men who completed a first degree provide the public purse with a net benefit of £51,081 over their lifetime compared to non-completers with similar characteristics. This is equivalent to a benefit to cost ratio of 2.5 to 1 for the public purse – in other words, a man completing a first degree generates an additional return of £2.50 for every pound of public investment (compared with a non-completer).
| Qualification |
Net benefit per learner £(NPV in 2018-19 prices) |
Benefit-to-cost ratio |
||
|---|---|---|---|---|
| Men |
Women |
Men |
Women |
|
| PG (research)* |
£87,503 |
£27,888 |
8.0 |
3.3 |
| PG (taught)* |
£63,276 |
£50,628 |
9.2 |
7.4 |
| First degree |
£51,081 |
£19,583 |
2.5 |
1.6 |
*Control group is qualifiers with a first degree.
Key findings:
- Qualifying with a first degree is associated with a large, positive increase in income for the Exchequer as compared to individuals who begin but do not complete a first degree.
- Typical qualifiers with either postgraduate research or postgraduate taught qualifications are estimated to produce a large increase in tax income compared to the control group, first degree graduates.
- Men are consistently estimated to generate a larger net return on public investment than for women, reflecting higher lifetime earnings. For postgraduate research students a large amount of this gap is explained by the 'typical learner' used. The average age of a female PGR student is slightly higher than for a male student. As such estimates for women with postgraduate research degrees are generated based on returns to women 31+.
Contact
Email: stuart.king@gov.scot