Development of a novel physiology tag to measure oxygen consumption in free-ranging seabirds: research
This project took initial steps to develop a new type of tag that can measure energy expenditure of seabirds. To do this, the project adapted a Near-infrared spectroscopy system for humans, that can measure muscle oxygen saturation, and deployed the new tags on European shags.
Results
Behavioural activity states
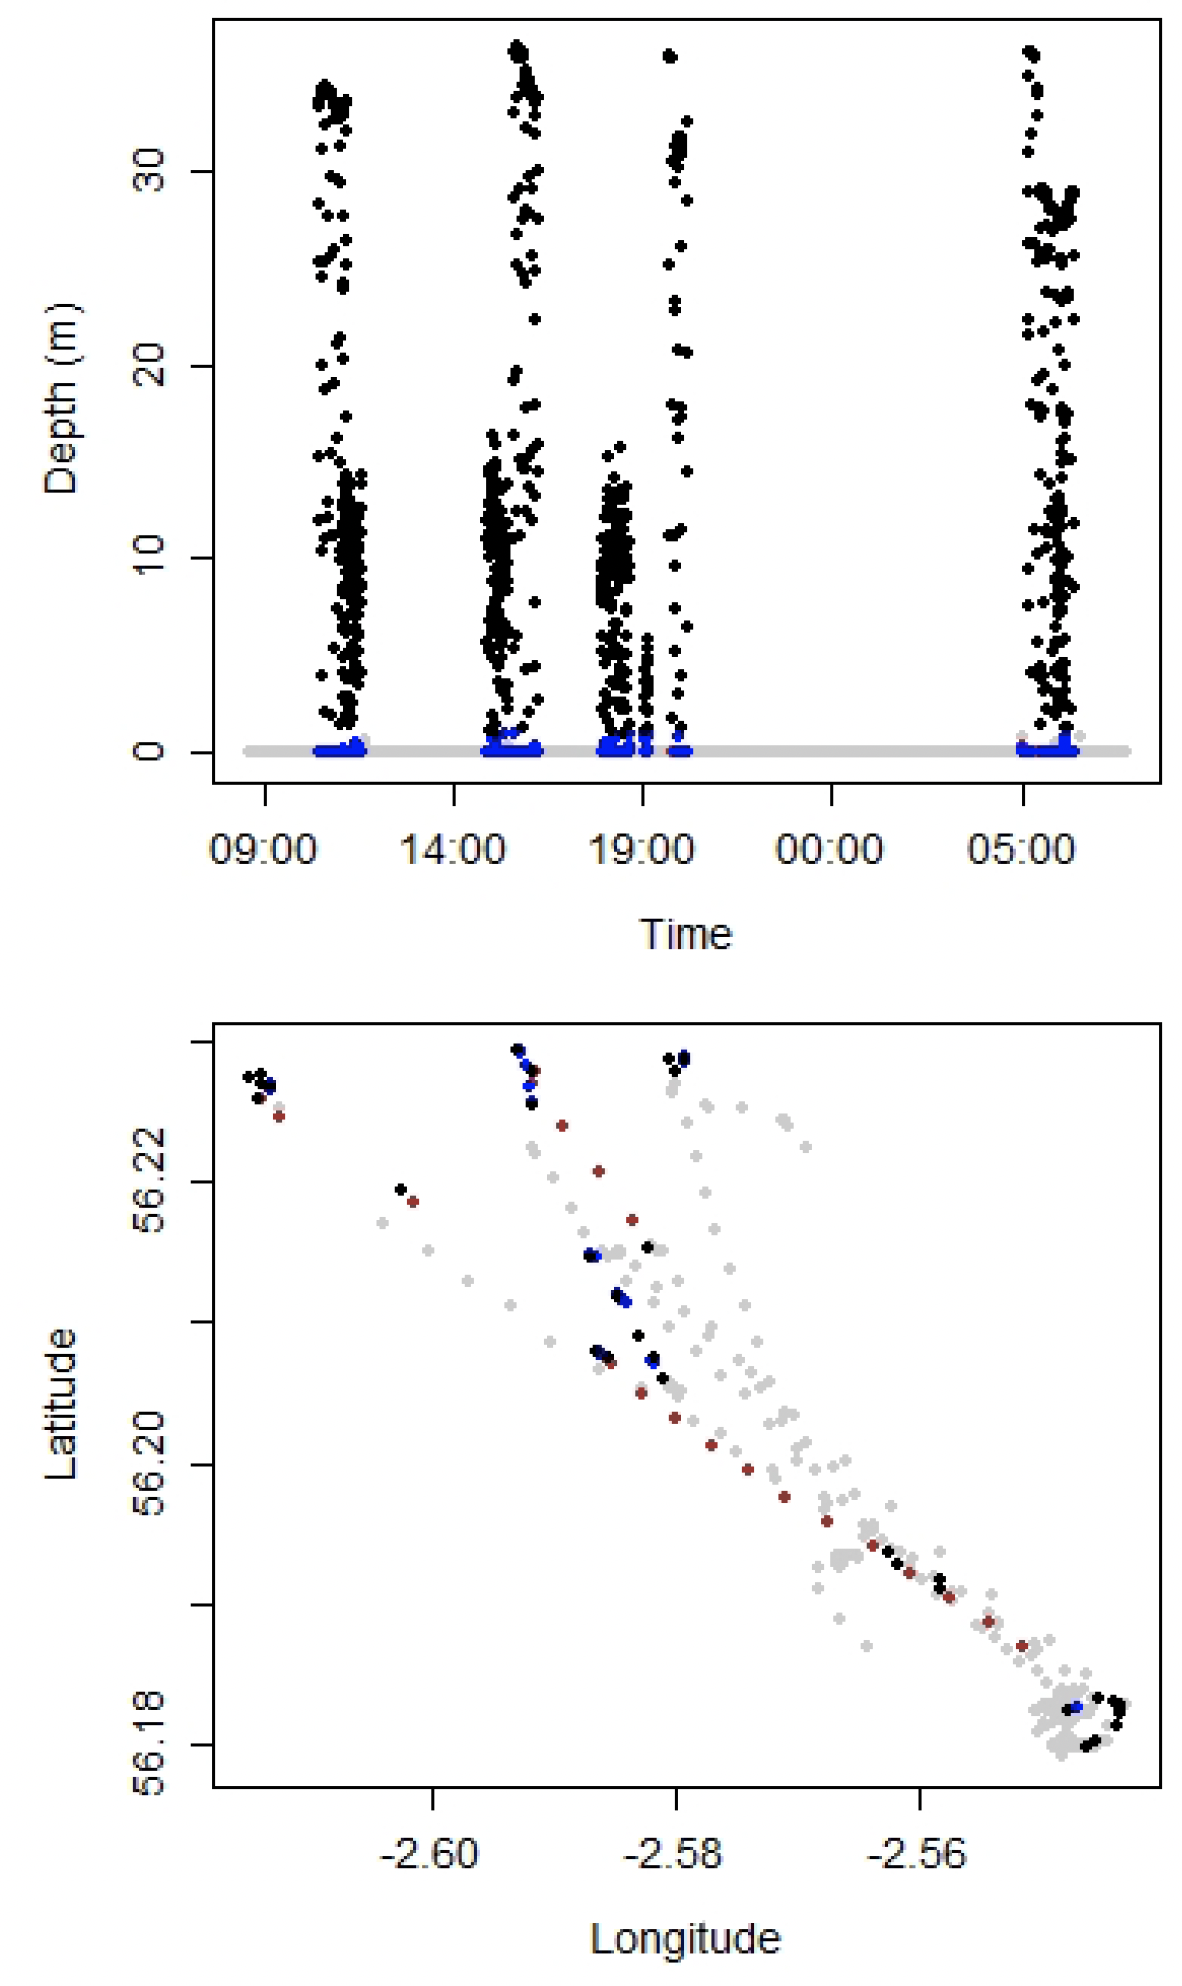
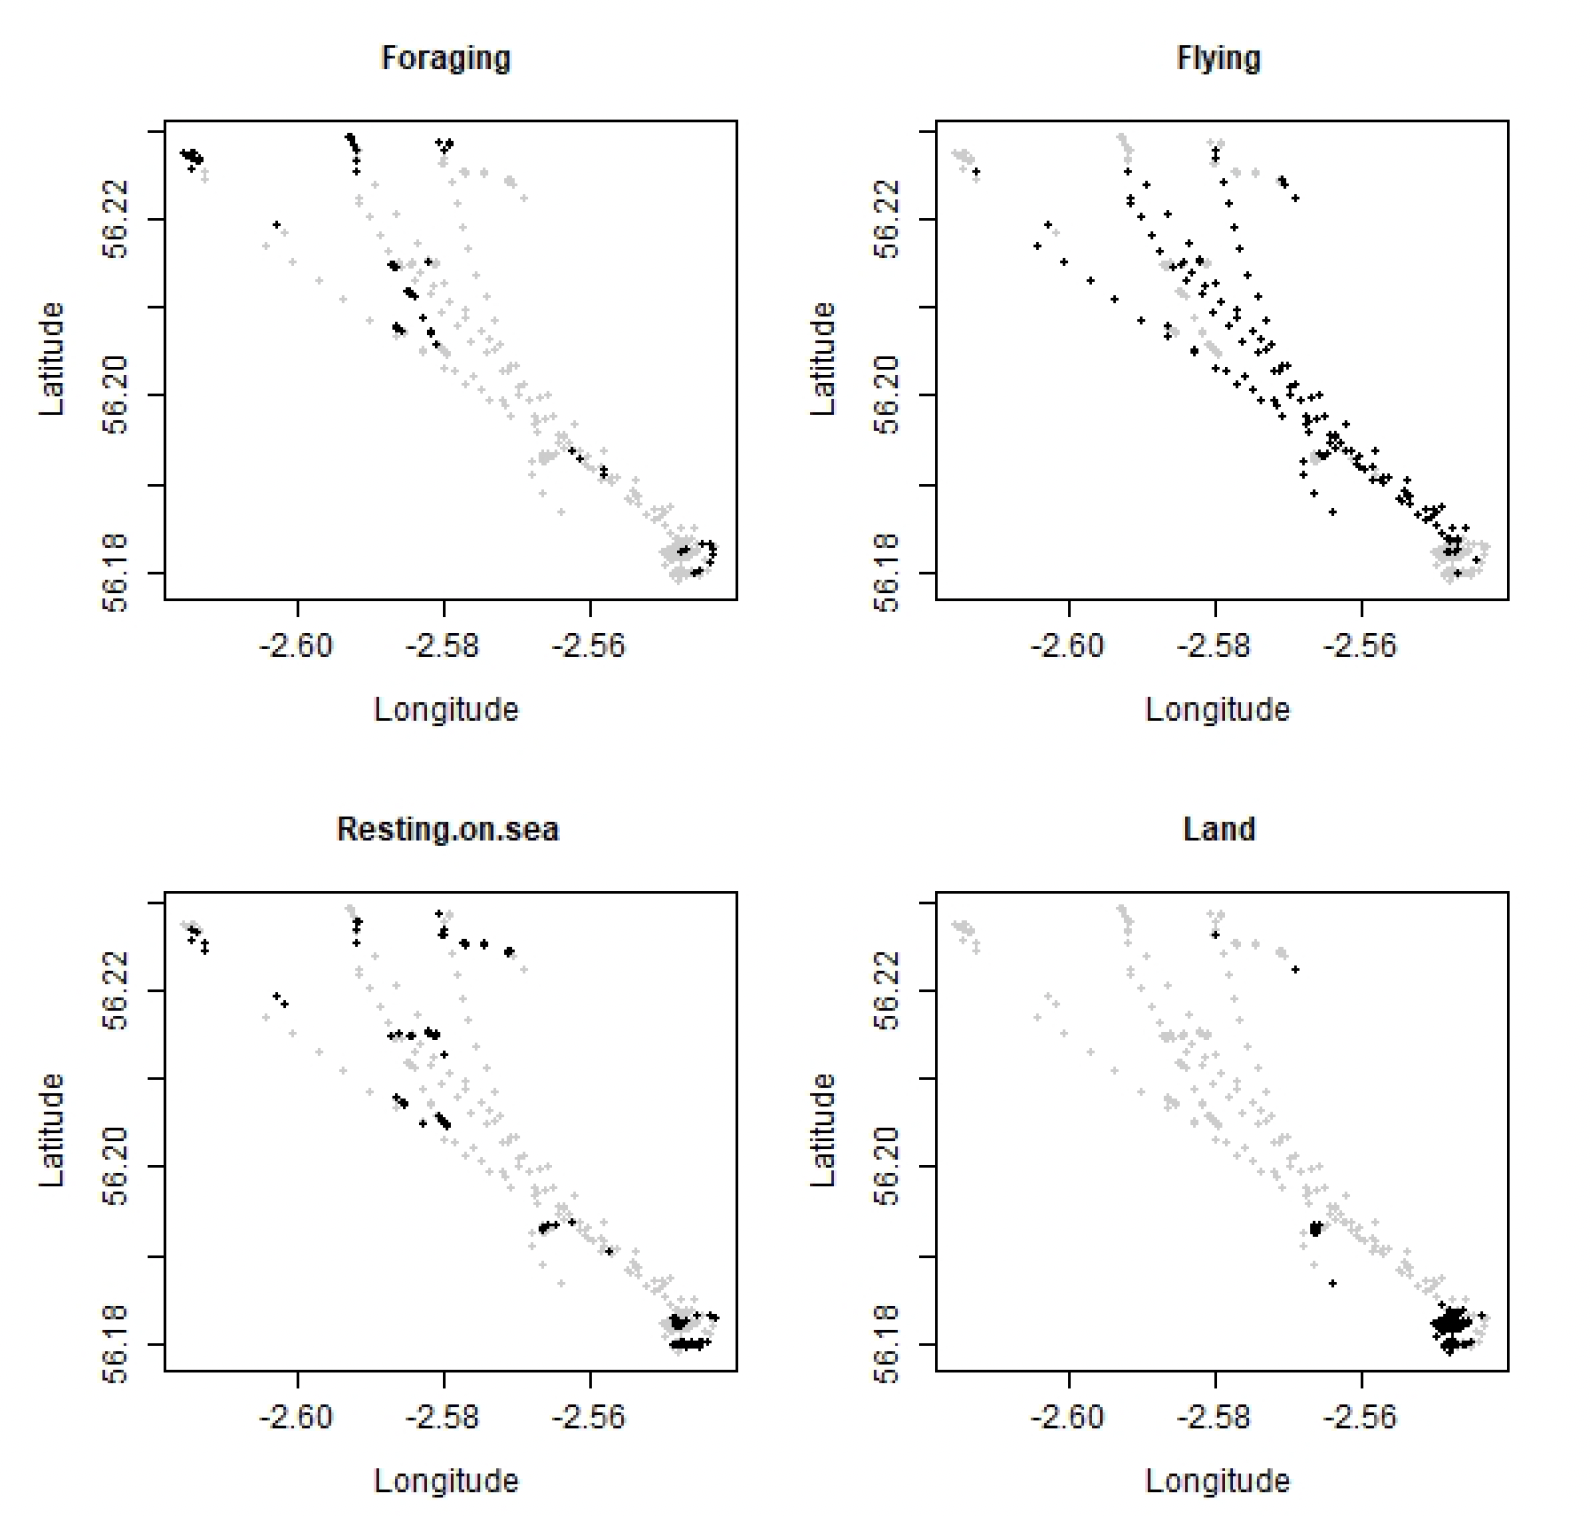
The initial separation of foraging bouts from non-foraging behaviours and the final classification of all behaviours obtained from the GPS-accelerometer-TDR tags are shown in Figures 4 and 5, respectively. Over the 45.5 hrs of deployment (across both birds), behaviour was classified into four categories. The majority (83%) of time was spent on land, 11% was spent foraging, 4% resting at sea and the remaining 2% flying. This matches the results from previous research on shag daily time activity budgets (Wanless et al., 2005: 89% on land, 6% foraging, 2% resting at sea, 3% flying in 2001; 81% on land, 12% foraging, 2% resting at sea, 5% flying in 2002) and suggests that there was no major disruption in the birds' behaviour as a result of our logger deployments.
NIRS measurements
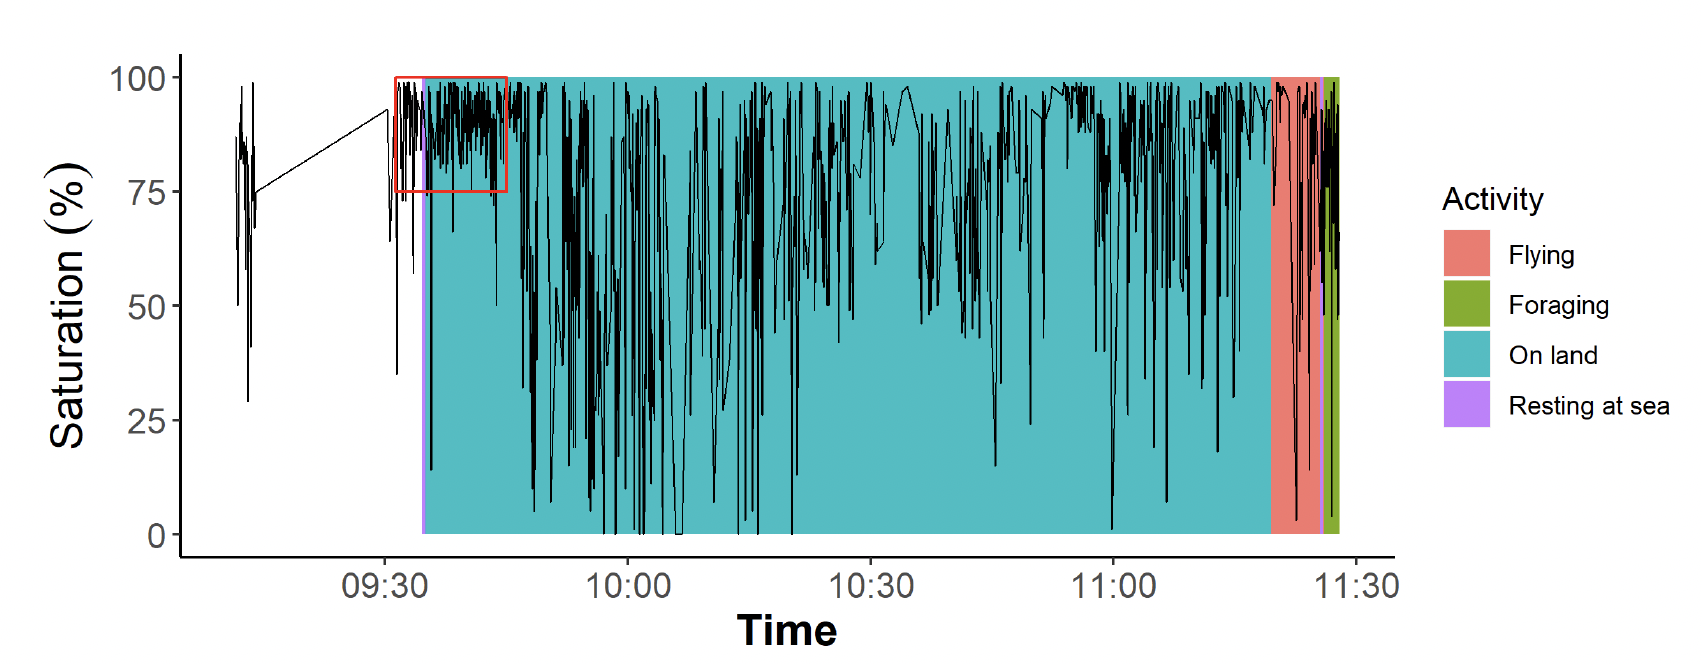
Of the two NIRS systems deployed, both were in good condition when they were retrieved and did not suffer water ingress or damage during the deployment. This included periods of flight and dives to depths greater than 30 m. However, SmO2 data were only successfully retrieved from one device; failure to retrieve data from the second device was a result of the system erroneously switching into a programming mode following the recharge of the battery after tag recovery. Once in programming mode, data could not be downloaded from the device. The system that successfully operated recorded a total of over two hours (02h 16m 30s) of NIRS data. Whilst the system had been programmed to sample at 2Hz, a software error resulted in a sample frequency of 0.5Hz during the deployment; unfortunately, as a sample rate of at least 2Hz is required to identify the cardiac waveform, this precluded heart rate measurements during the deployment. However, the system did provide continuous 0.5Hz measures of SmO2 (Figure 6).
In general, SmO2 levels remained greater than 80% of normoxic muscle oxygenation during the initial period of deployment (marked by the red polygon in Figure 6). However, from approximately 09:45 onwards there is marked variability in the measurements. Rapid levels of muscle deoxygenation could only result from significant and sustained energetic exertion, which could perhaps be expected from sustained flight or apneic swimming. However, the marked variability in the data is apparent throughout an 'on land' behavioural state (Figure 6) where the bird's body angle is maintained at 45° and it is assumed that activity is relatively low. Considering these data are SmO2 values from secondary-flight muscles, the pronounced apparent deoxygenation and reoxygenation while the animal is on land suggest that the SmO2 signal may have been contaminated by LEO/RPD movements, or inadequate contact between LEO/RPD and the bird's skin; it was therefore considered that measurements after 09:45 were inaccurate and did not represent biologically relevant measurements of SmO2.
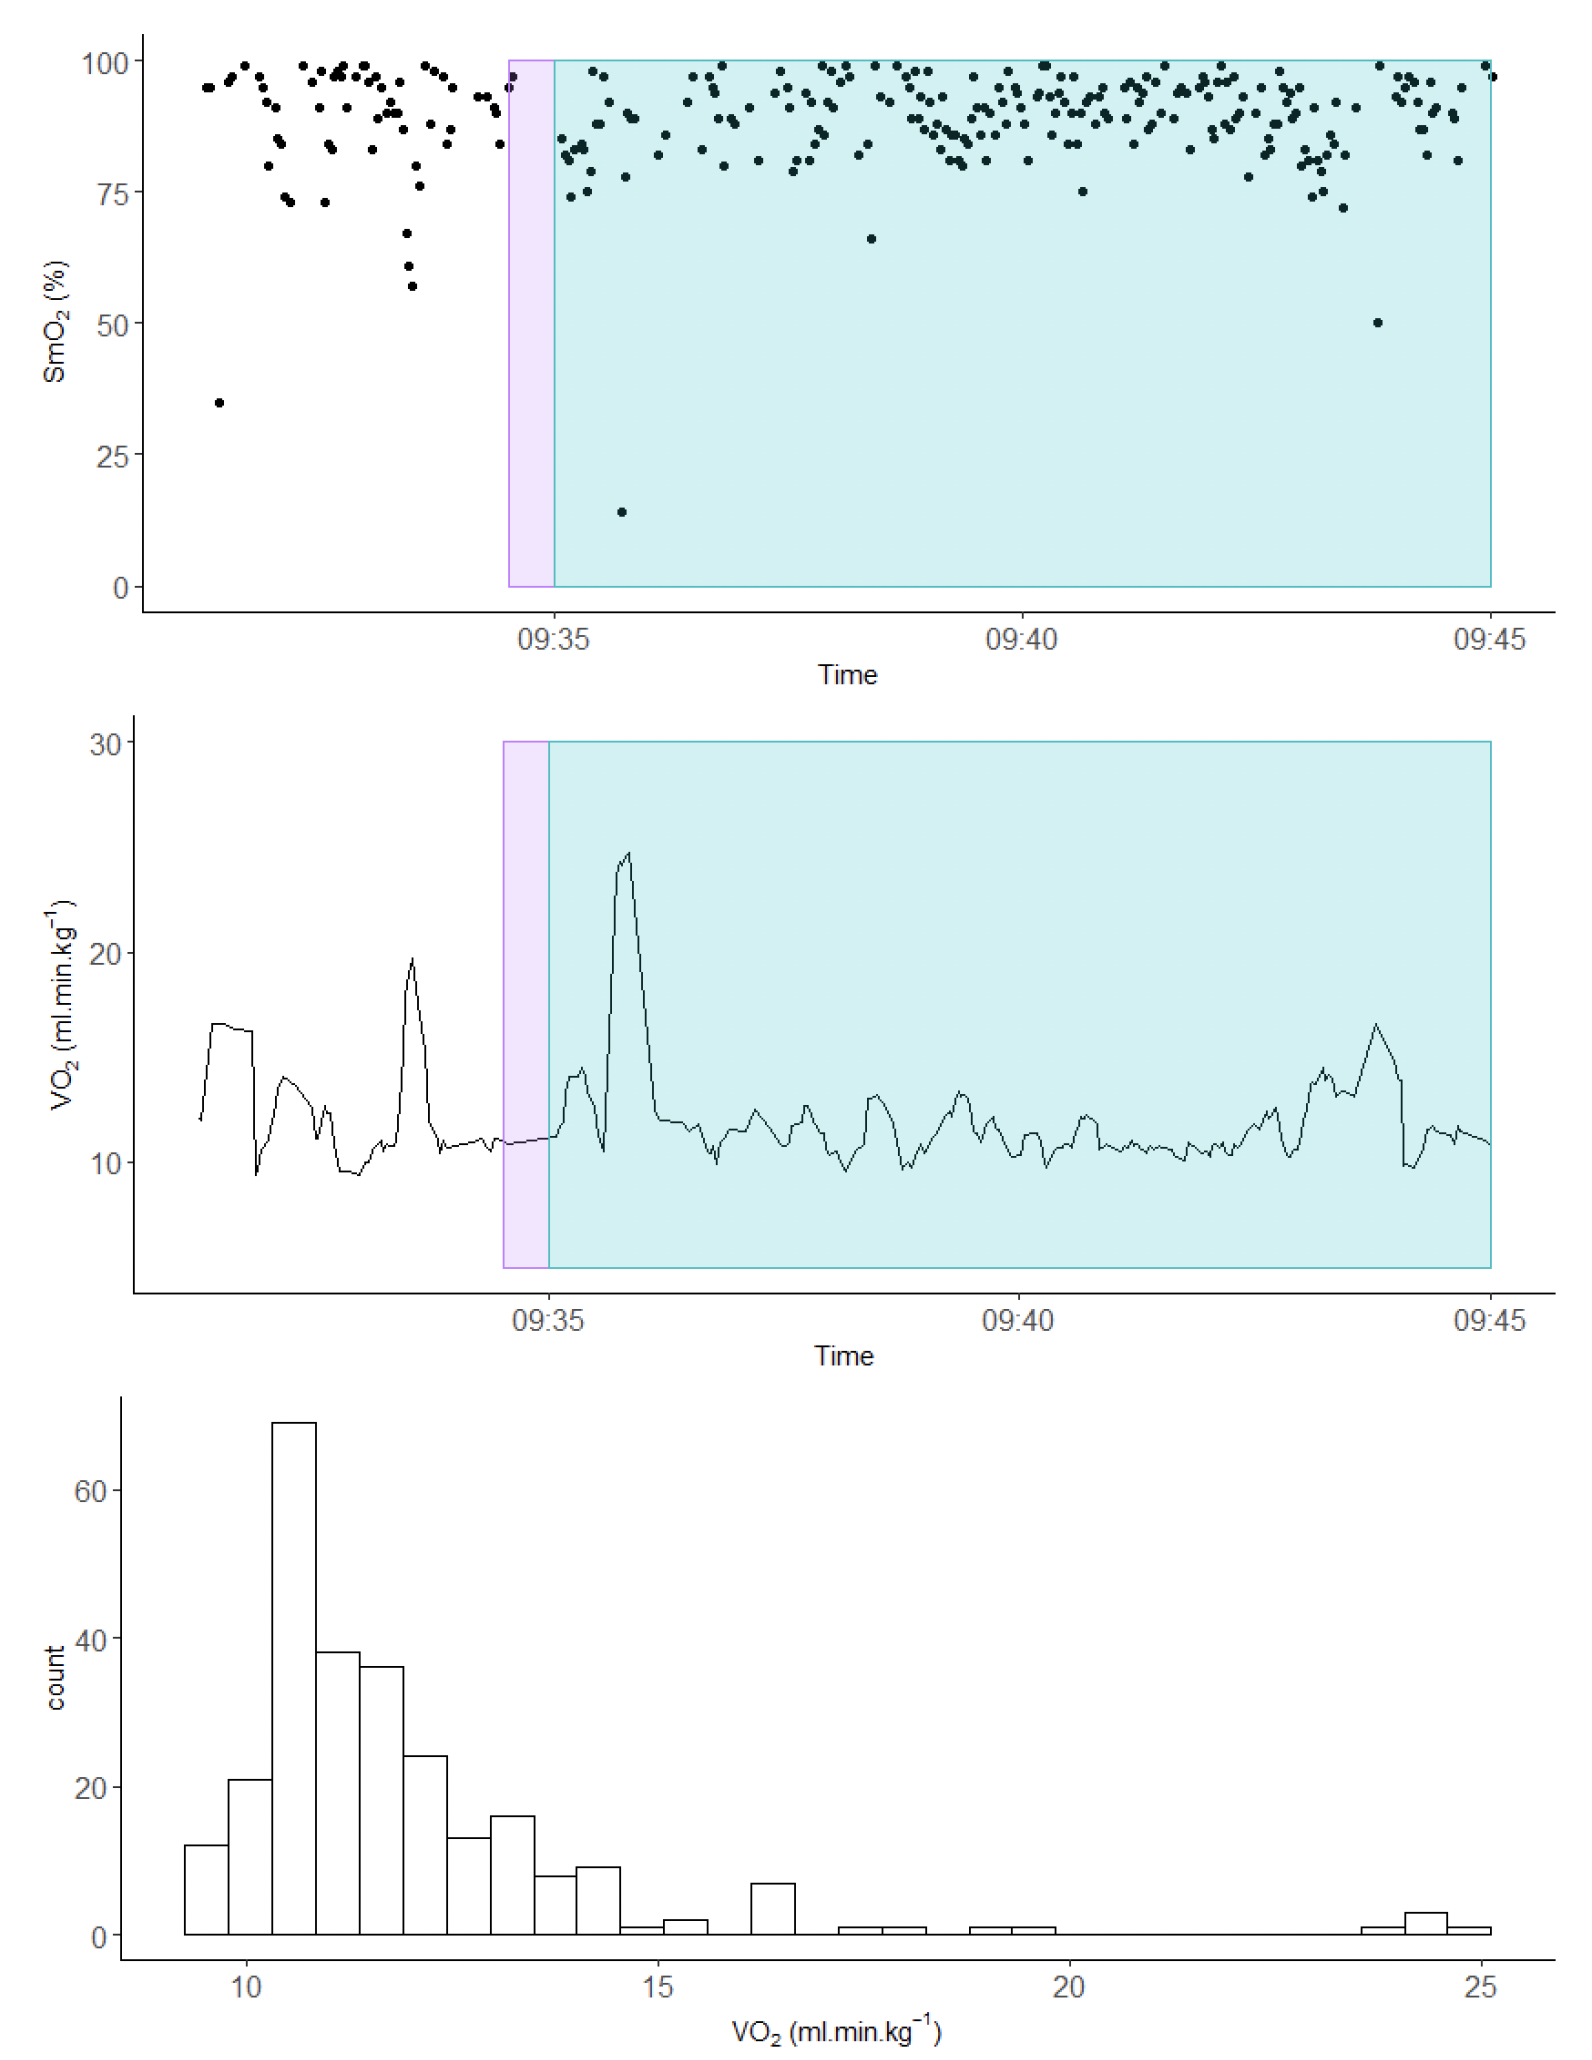
Using the section of reliable data (denoted by the red box in Figure 6), oxygen consumption (VO2) was estimated to demonstrate the utility and application of NIRS to measure energetic expenditure in free-ranging birds. SmO2 measurements during this period ranged from 14.0 to 99.0% with a median of 91.0 (95% CIs = 70.0-99.0%) (
Figure 7). Using the GLM based on the data from (Crum et al. 2017), whole body VO2 estimates ranged between 8.9 and 74.6 ml.min.kg−1 with a median of 10.9 (95% CIs = 8.9-20.0) ml.min.kg−1. It is important to highlight that, although the duration was relatively short, no NIRS data appear to have been recorded when the bird was in the behavioural state 'Resting at sea'.
Contact
Email: ScotMER@gov.scot