Development of a novel physiology tag to measure oxygen consumption in free-ranging seabirds: research
This project took initial steps to develop a new type of tag that can measure energy expenditure of seabirds. To do this, the project adapted a Near-infrared spectroscopy system for humans, that can measure muscle oxygen saturation, and deployed the new tags on European shags.
Methods
NIRS tag
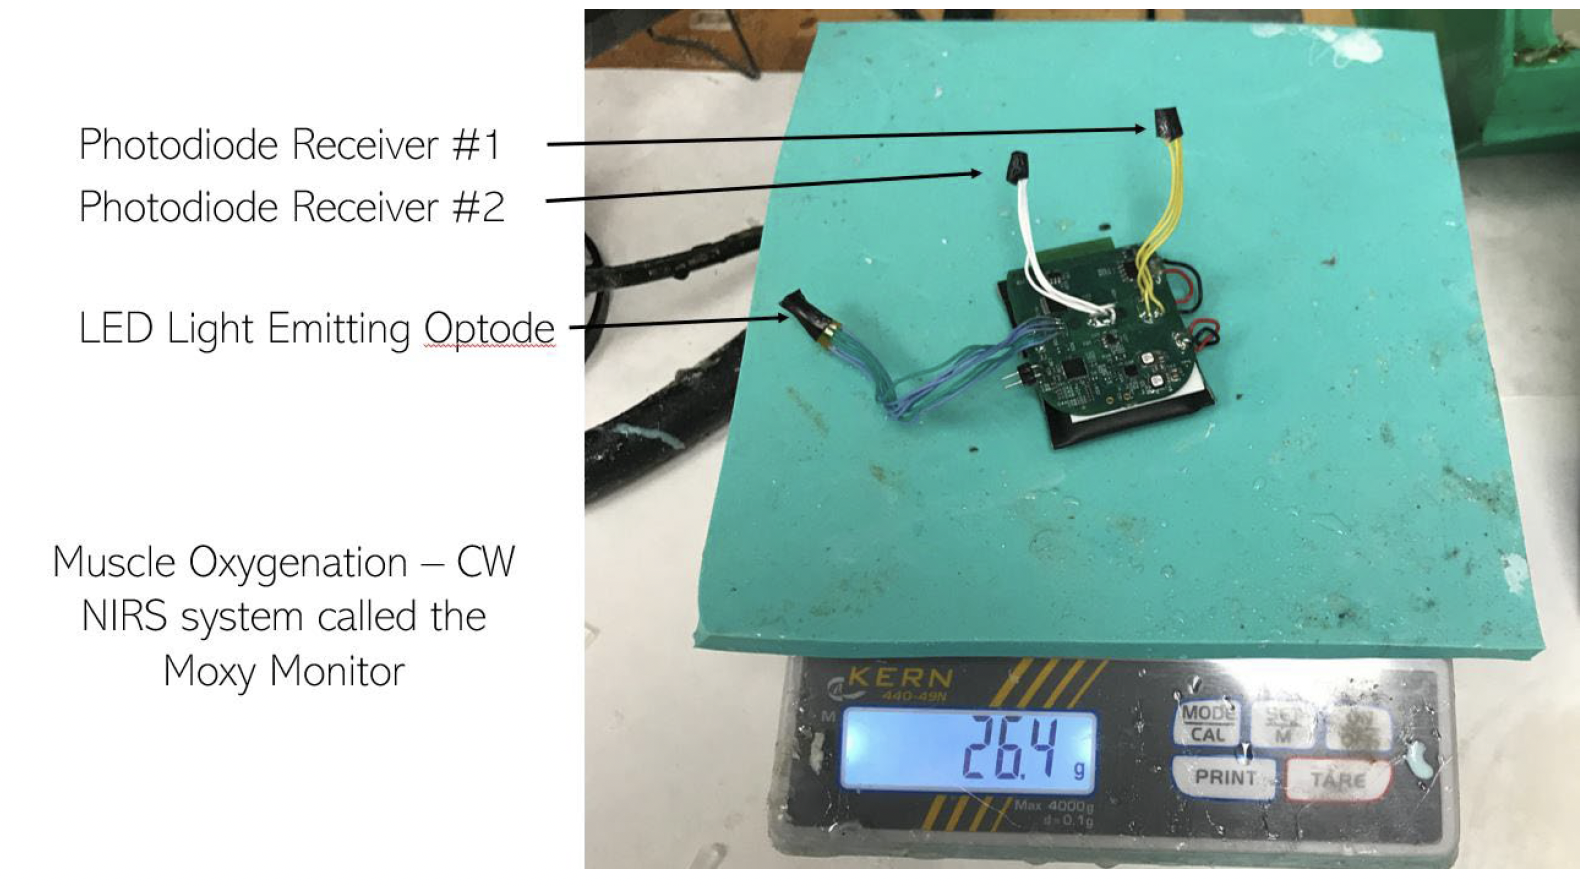
To measure the oxygen consumption and heart rate of free-ranging European shags, an animal-borne archival NIRS sensor was developed from an existing wearable dual-wavelength continuous wave NIRS system for humans (Moxy Monitor, Hutchison, Minnesota, USA). The Moxy Monitor is an autonomous data logger that consists of a light emitting optode (LEO) and two receiver photodiodes (RPD), and a microprocessor recording system. These were housed in a plastic case which is relatively small (61 x 44 x 21 mm) and weighs approximately 48 g in air (Figure 1). Muscle O2 saturation (SmO2) measurements were made at sampling rates up to 2 Hz and it can store approximately 10,800 measurements onboard the device. Importantly for applications on free ranging animals, the Moxy Monitor is designed for use in human exercise physiology, so the measurements are relatively insensitive to potential motion artefacts if contact with the skin surface can be maintained.

To ensure that the sensor was suitable for deployment on free-ranging birds, a series of hardware modifications were carried out; specifically, NIRS sensors were appropriately adapted to make skin contact between the feathers, and data logging technology were effectively miniaturised and ruggedized, and adapted to ensure attachment to the bird was safe and secure.
To waterproof the sensor head, the LEO and RPDs, and printed circuit boards (PCBs) of the sensor head were first removed from the plastic case. The LEO and RPDs were then removed from the PCBs and fitted with short extension leads (approximately 50 mm in length) (
Figure 2). To ensure that the whole system was waterproof, the PCBs were covered with a thin coating of spectrally transparent epoxy (EPO-TEK 301, Epoxy Technology, Billerica, MA, United States). To ensure that epoxy encapsulated the electronics but did not cover the optical window on the optodes, the sensor head was cradled in a custom-built silicone mould. This allowed the internal components to be waterproofed by epoxy but ensured the external surface and LEDs remained exposed.
For the purposes of the study, it was assumed that bird Hb and myoglobin have the same optical properties as human ones given the previous application of NIRS in other bird species (Williams, Meir & Ponganis 2011; Williams & Ponganis 2013).
Deployment on free-ranging birds
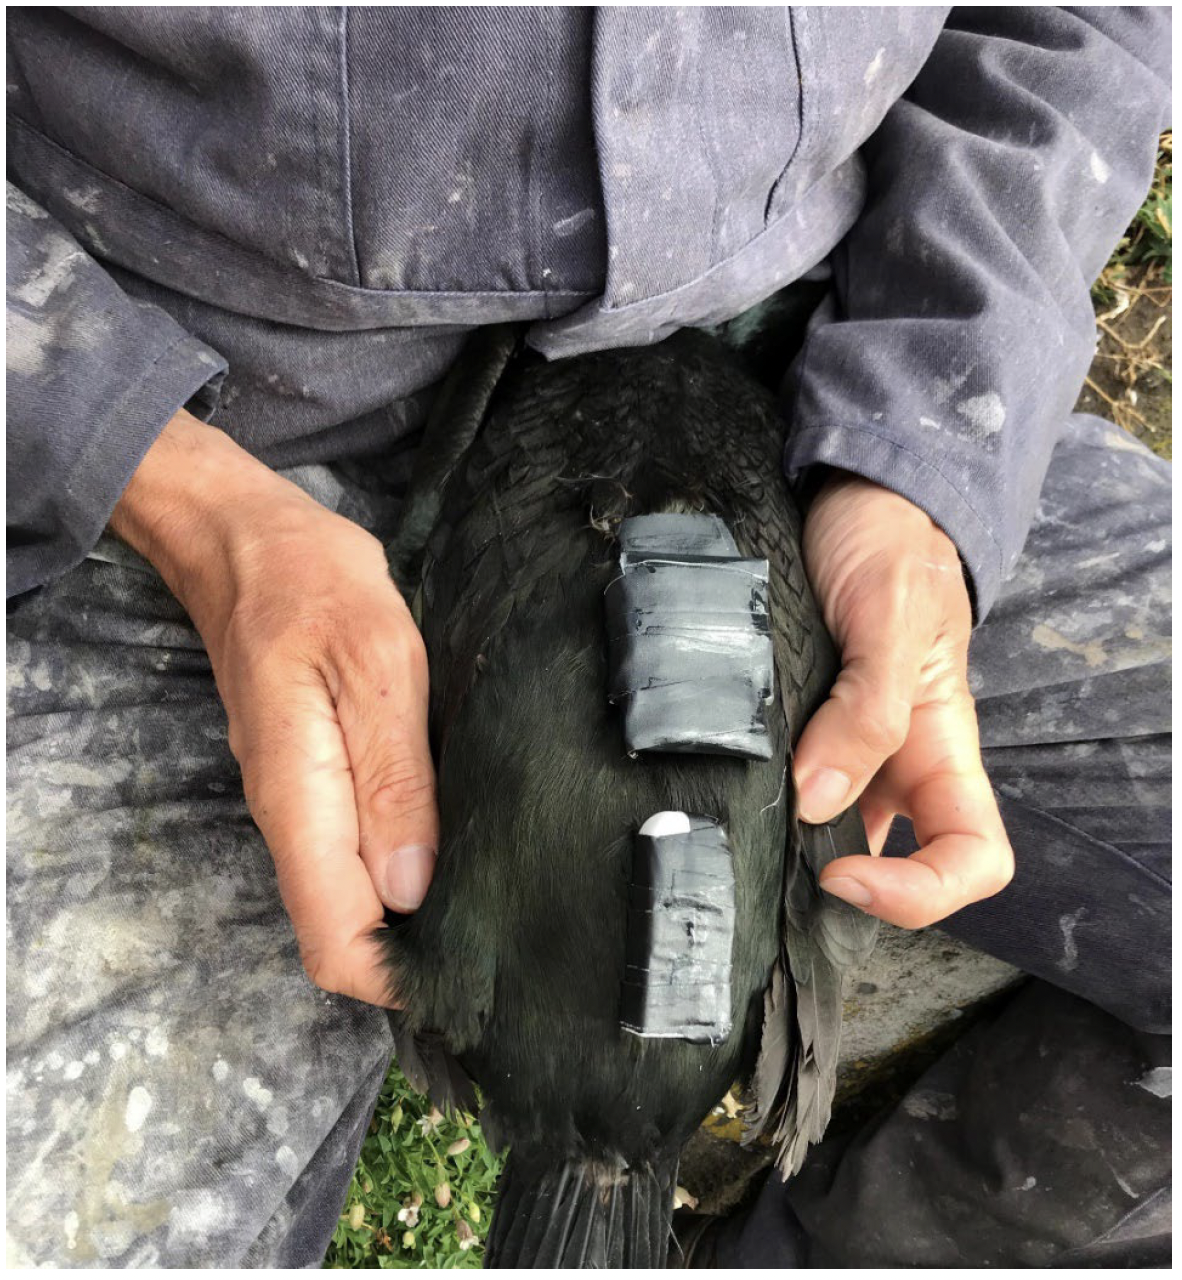
To determine the efficiency of the NIRS loggers, and to estimate activity-specific (e.g. diving, flying, resting) energy expenditure in free-ranging seabirds, the NIRS loggers were deployed on European shags breeding on the Isle of May, Scotland (56°11′N, 2°33′W) during the summer of 2019; this was carried out as part of a long-term life history and behavioural study of this species (Daunt et al. 2007; Bogdanova et al. 2014). European shags are medium-sized diving seabirds that feed largely benthically on small fish (Watanuki et al. 2008). During chick rearing, they typically make 1-4 foraging trips a day (Wanless & Harris 1992; Sato et al. 2008). Two adult male shags (aged 7 and 10 years) were caught at their nests using a standard British Trust for Ornithology (BTO) catching method (a pole with a crook at the end) and were fitted with loggers. The LEO and RPDs were affixed to the down feathers using a small amount of Loctite® 422 Instant Adhesive and were mounted in a line laterally (approximately 15 mm apart) across the back of the shag. This aimed to ensure that the LEO and RPDs maintained contact with the skin and maximised the likelihood of measuring SmO2 in the latissimus dorsi wing muscles. The logger was attached immediately caudal to the LEO and RPD locations to the lower back using Tesa™ tape (Figure 3).
In combination with the NIRS loggers, a Technosmart Axy-Trek Marine tags (Technosmart Europe srl, Rome, Italy) combining GPS, tri-axial accelerometry and time depth recorder (TDR) (weight 25 g, dimensions 53x23x10 mm) was deployed on each of the birds. This was attached to the lower back immediately to the rear of the NIRS logger using Tesa™ tape (Figure 3). The raw data recorded acceleration in three axes (x - surge, y - sway, z - heave) and pressure at 25Hz (i.e. 25 records per second). GPS locations were recorded at a nominal sampling frequency of 0.05Hz (i.e. one record every 20 seconds). In total the combined weight of the two tags (in air) for the deployment was 51.4 g. The deployment of the dual tag system (NIRS and GPS/accelerometer/TDR) was similar in scope to the attachment of other more commonly used tags such as GPS, and the time taken between capture and release of the birds was approximately 25 minutes
All procedures involving shags were approved by the University of St Andrews School of Biology Ethics Committee (Reference number SEC19014) and were carried out under a British Trust for Ornithology Schedule 1 Ringing and Special Methods Licence (C / 4671; Ref 19/39), and a Scottish Natural Heritage National Nature Reserve Licence (RP 19_1).
Classification of behaviour
To determine whether the NIRS measurements were robust to activity type in the shags, and to provide activity-specific estimates of SmO2, accelerometry and time depth data from the Technosmart tags were used to classify the behaviour of the two birds. The classification was performed using the semi-automated approach described below where 1) behaviour was classified into activity states using a series of predetermined metrics and thresholds; 2) the results were sense-checked by experts in shag behaviour; and 3) the metrics and thresholds were refined based on their feedback.
Pressure data
We initially converted "pressure" (recorded in millibars) into "depth" (in metres) using Equation 1.
Equation 1
depth = 10 ∗ (pressure − atm)/atm
where atm is standard atmospheric pressure (1013.25mb).
However, air pressure can vary markedly over time as a result of changes in weather conditions; we corrected for this by smoothing and zero-correcting the resulting depth values following the approach used in the 'diveMove' package (Luque 2007) in the software 'R' (R Core Team 2017). Smoothing involved taking a running median over blocks of 3 records; zero-correction involved taking a running 2% quantile over blocks of 30 minutes (45,000 records) and deducting this from the depth values. The rationale behind the second step was that (a) within any 30 minute period at least 2% of the time will be spent not diving, (b) for this 2% of time the depth must be zero and (c) any variations in air pressure within a 30 minute are likely to be negligible.
Accelerometer data
We first separated each accelerometer axis into "static" and "dynamic" components using a moving window of two seconds. The two-second moving average of each component forms the "static" component, and the difference between these averages and the raw data values forms the "dynamic" component (Collins et al. 2015). From the static acceleration values for the three axes we calculated static pitch using Equation 2.

Two sets of metrics relating to dynamic acceleration were then calculated as: 1) the standard deviation, , of dynamic acceleration over a 60-second moving window for each axis (Collins et al. 2015); and 2) the percentage of variation (RSQɑ) in 10-second range that is explained by the 2-second range, for each of the three axes (Equation 3)
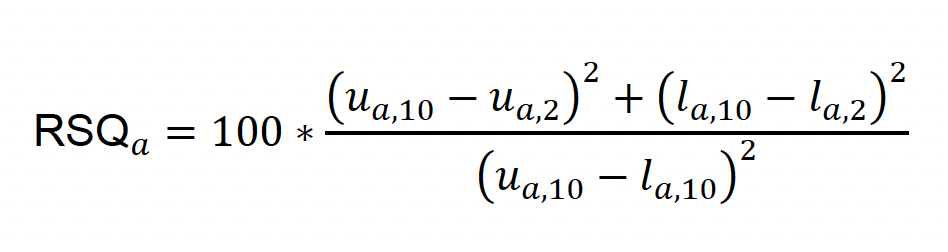
where and denote the ranges over 2-second and 10-second moving windows respectively for each axis. The resulting percentage, for each axis, is then smoothed over a 30-second moving window.
The former metric (RSDɑ) provides a measure of variability in each axis, and the latter (RSQɑ) provides a measure of predictability (i.e. the extent to which variation in time arises from the repetition of a pattern).
Classification of foraging
We first identified periods of foraging behaviour using the depth values we derived from the pressure records, using the approach of Sato, Mori and Yoda (2001). We assumed that all records for which depth is deeper than 1m correspond to dives (i.e. foraging). However, foraging bouts also include gaps between the dives (Wanless et al. 1993). To assess which gaps are associated with foraging, and which are not, we looked at the distribution of the gaps between dives, in terms of (a) the gap in time and (b) the difference in depth (in metres) between the maximum dive depths. For each of these distributions, for each bird, we then calculated the point of inflection in a double exponential model (Sato, Mori & Yoda 2001). For any pair of dives we then assumed that the period between them is a "pause" (i.e. part of a foraging bout) if the gaps in both time and depth between them are lower than the points of inflection. We assumed that the period between dives is not a pause (i.e. is non-foraging behaviour) if the gaps in either time or depth are higher than the corresponding points of inflection.
Classification of other behaviours
Non-foraging records were further classified into behavioural states, using metrics derived from the accelerometer data. We first classified any non-foraging records for which the static pitch exceeds 45 degrees as being "on land", on the basis that this body angle (associated with standing) can only be maintained when birds are on land. For the remaining (non-foraging, non-land) records we classified records that have both high variation and high predictability in heave (the z-axis) as "flying", as these are characteristic of the steady flapping flight performed by shags (Sato et al. 2008). The thresholds (of 0.45 and 95%) were selected visually. Finally, we flagged records with extremely low variability as being "suspect", and classified all remaining records as "resting at sea".
Removal of short behavioural bouts
The next stage was to remove implausibly short behavioural bouts. We did this in two steps:
a) for each 10-second period we classified the behaviour within the period to be the behaviour that occurs most frequently, unless the period contained some records that were classed as "foraging", in which case we defined the entire period as "foraging".
b) whenever a behavioural bout had a duration of less than seconds, where , we looked at the bouts immediately prior to and subsequent to this: if both of these had the same behaviour, and both had a duration longer than seconds, then we reclassified the current behavioural bout as having the same behaviour as the prior and subsequent bouts.
Removal of suspect records
Finally, for each tag, we removed all records after the time at which the first behavioural bout classed as "suspect" occurred. We did this because exploratory data analyses suggested that the "suspect" records related to the period after the tag had been removed from the bird (the exact time of retrieval was not recorded in the field).
Sense-checking
The final classification was evaluated visually, by plotting the behaviour classification in relation to the variation in depth and accelerometry metrics over time. It was also evaluated against the GPS data, which were not used in the construction of the classification, and therefore provide a check on the plausibility of the results.
VO2 estimation using NIRS
The Moxy Monitor data loggers provides continuous measurements of local muscle oxygen saturation (SmO2) as a percentage and total haemoglobin (THb) using NIRS which can be used to measure localised oxygen consumption (VO2) usage during exercise. Here, VO2 was estimated using previous SmO2 calibrations of VO2 from the Moxy Monitor system (Crum et al. 2017). The data on SmO2 (%) and VO2 (ml.min.kg−1) presented in this previous study (Crum et al. 2017) were analyzed within Generalized Linear Models (Gamma error family) using a logit link function (Dobson 1990), and the resultant model parameters were used to convert SmO2 to VO2; these are presented as mean VO2 values over a rolling 10 second window across the dataset.
Contact
Email: ScotMER@gov.scot