Deposit and Return Scheme for Scotland Regulations 2020 (as amended): business and regulatory impact assessment
Full business and regulatory impact assessment for The Deposit and Return Scheme for Scotland Regulations 2020, as amended by the Deposit and Return Scheme for Scotland (Amendment) Regulations 2025; and the Deposit and Return Scheme for Scotland (Designation of Scheme Administrator) Order 2025.
Section 3: Costs, impacts and benefits
Quantified costs to businesses
What are the expected direct costs to business of the baseline option?
145. Unlike Option 1, the costs of the existing system to business – associated with the purchase of Packaging Recovery Notes (PRNs) – do not reflect the full net costs of their packaging waste. This is because the PRN system only covers around 10% of the total cost of managing packaging waste, with most of the costs borne by local authorities and recycling processed at MRFs.[89] Under the new packaging EPR system, producers will be required to pay the full net costs so, in the absence of the DRS, producers’ costs will increase relative to the baseline used in this BRIA.
146. In the baseline, drinks labels do not need to change and retailers and wholesalers do not need to charge the deposit; there are no take back obligations. Additionally, it should be noted that the existing system does not achieve the same results – in terms of recycling rates and litter reduction – as the DRS is expected to achieve. The baseline recycling rates used in the modelling include material sorted from residual waste, whereas the recycling rate in Option 1 only relates to drinks containers collected separately.
147. As the baseline does not involve any change in policy or, consequently, any change in costs, the costs of drinks container waste are not quantified. The cost of PRNs, however, can provide an indication of the current cost to drinks producers, where the producer is above the de minimis threshold for turnover and tonnages placed on the market. Costs of PRNs vary, but the baseline PRN prices for in-scope materials used for Defra’s packaging EPR Impact Assessment are shown in Table 4. The three scenarios reflect the variation in price over the preceding three years.[90]
| Price per Tonne & Material | Low | Central | High |
|---|---|---|---|
| Plastic | £158 | £170 | £280 |
| Aluminium | £132 | £150 | £302 |
| Steel | £16 | £17 | £24 |
Source: Defra, 2022.
148. Producers’ PRN purchases do not represent the cost of managing drinks container waste in the baseline, or the cost to all businesses, so these are not directly comparable to the costs of Option 1. Accordingly, the assessment of Option 1 costs does not indicate the change in costs from the baseline. Conversely, it should be emphasised that the assessment of Option 1 benefits reflects the net impact, taking into account recycling rates and recycling revenues in the baseline.[91]
What are the expected direct costs to business of option 1 (DRS)?
149. The BRIA assesses the costs of setting up and operating the DRS. It identifies the costs and benefits to producers, retailers, HORECA businesses and wider society (including consumers, Local Authorities, and environmental impact). The impacts that are monetised in the BRIA are summarised in Figure 1; the graphic shows the costs, and then the benefits, of a DRS across all identified stakeholders. The final results of the cost modelling are shown in Table 13 (costs), Table 14 (benefits), and at the end of Section 3 in Table 18 (summary of results).[92]
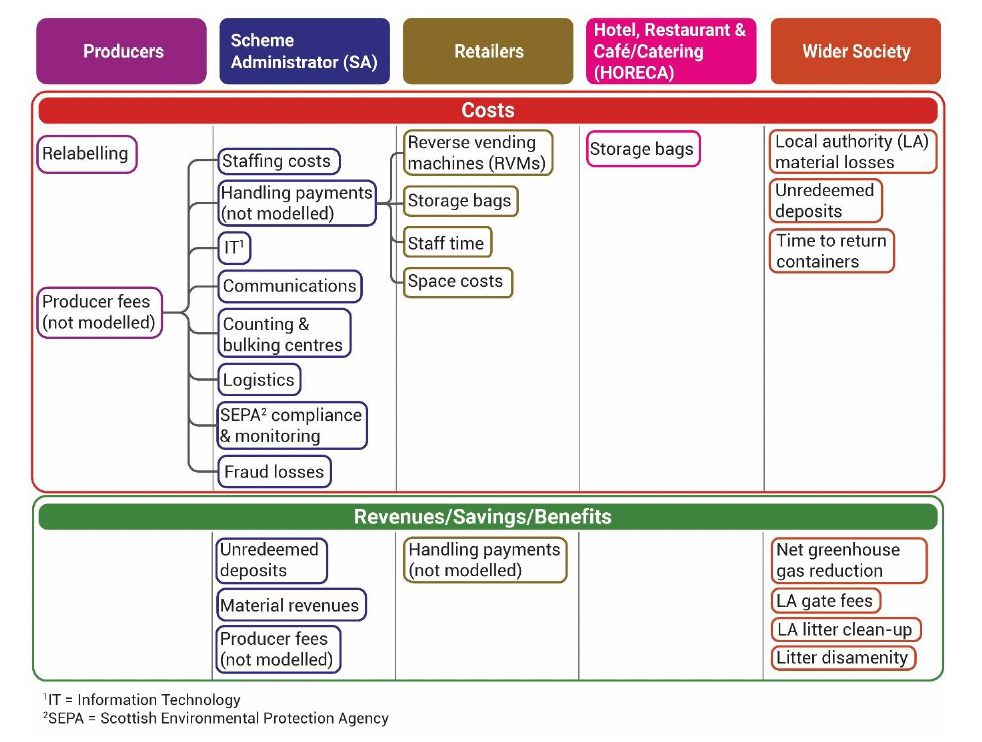
150. Figure 1 presents the summary of costs and benefits of operating a DRS. These are also laid out in the Operating Costs and Revenue/Benefits lists below. They are shown in relation to applicable stakeholder groupings consisting of: Producers; Scheme Administrator (SA); Retailers; HORECA (hotels, restaurants, cafes etc.); and Wider Society. In addition to the direct operating costs listed below, other associated costs will be incurred as a result of the DRS. These include: re-labelling costs for producers; local authorities’ lost material revenue due to fewer containers being collected at the kerbside; the cost to consumers of returning their containers; and the cost of deposits for consumers who do not return their container and redeem their deposit.
Operating Costs
- SA staffing costs (representing the SA’s set-up and ongoing costs; any premises and equipment are not costed in the BRIA).
- IT costs (for the SA database including a member interface).
- Communication campaigns (to promote awareness and understanding of the DRS).
- Logistics (the cost of transporting returned containers from return points).
- Bulking and counting centres (where containers not returned to RVMs are counted and all containers are baled).
- Compliance and monitoring (SEPA’s enforcement costs, which will be charged to the SA).
- Return point costs:
- RVM capital, installation, housing and maintenance costs
- RVM miscellaneous costs (predominantly bags for storing returned containers)
- RVM handling costs (staff time, e.g. to empty the RVMs)
- Manual return point equipment (storage bags; any electronic equipment that may be required is not included in the BRIA)
- Retail rental and opportunity costs (the direct costs of the space used for RVMs/ returned containers and opportunity cost to retailers foregoing retail space)
- Training and familiarisation (for retailer staff at return points)
- HORECA costs (storage bags, which may be provided by the SA, rather than a direct cost to HORECA businesses).
- Any losses resulting from fraud (relating to deposit refunds being issued for containers on which a deposit was not initially paid).
Revenue/Benefits
- Unredeemed deposits (consumers’ unclaimed deposit refunds are a source of revenue for the SA).
- Material revenue (the revenues from the sale of the material are used to part fund the system).
- Producer registration fees (paid by producers to the SA for each scheme article they place on the market to cover the full net costs after the deduction of unredeemed deposits and material revenues).
- Handling payments (set and paid by the SA to return points for each container they take back).
- Reduced greenhouse gas emissions (as a result of the increased recycling and reduced landfilling or incineration of drinks containers. The modelling takes into account the emissions from the operation of the DRS and the transport of the containers).
- LA gate fees (the reduction in the amount of material Local Authorities send to landfill or incineration will reduce the gate fees to be paid).
- LA litter cleansing costs (the reduction in drinks containers that are littered is likely to reduce Local Authorities’ litter clean-up costs).
- Improved litter disamenity (the improved sense of well-being and reduced impact on communities as a result of the reduction in litter).
151. With the exception of return point costs, the direct operating costs are initially borne by the SA. Funding will come from unredeemed deposits (the deposits for the proportion of containers not returned by consumers for a refund); material revenues (from the sale of the returned containers); and producer registration fees paid by producers for each scheme article they place on the market to cover the full net costs.
152. Return point costs are initially incurred by the groceries retailers such as supermarkets and convenience stores that are required to provide a return point. They are compensated for some, or all, of these costs to varying degrees by handling payments from the SA for each container they take back. It will be for the SA to determine the average costs incurred by return points and the level of the handling payments, taking into account the factors specified in the Regulations and after consulting with a range of retailer representatives.
153. In addition to these direct costs of operating the DRS, there are internal costs to businesses, such as relabelling costs, which are discussed below.
154. While the increased recycling under a DRS will reduce greenhouse gas emissions, there is also a carbon impact from operating the DRS and transporting the containers; the monetised cost of the emissions is included in the BRIA. The wider impacts of the policy, including on local authorities and for society (in terms of litter disamenity) are also modelled.
155. The following assessment of the costs and benefits of the Scottish DRS are based on Defra’s Impact Assessment (IA) for England and Northern Ireland, reflecting the joined-up three nation approach. Except where stated otherwise, Defra’s results have been adjusted for Scotland on a population basis, using the figures shown in Table 5. Costs and benefits have been assessed over a 10-year period and are presented in a 2023 price base unless stated otherwise. The core inputs are listed below.
Table 5: Population Data for Modelling
Population (2022)
England: 57,106,398
Northern Ireland: 1,910,543
England + Northern Ireland total used in Defra IA: 59,016,941
Scotland: 5,447,700
Source: ONS (2024) Mid-Year Population Estimates for 2022
156. Table 6Table 6 shows the estimated 2 billion drinks cans and PET bottles within the scope of the DRS in Scotland each year, based on Defra’s population-adjusted figures after they commissioned research from Valpak. In the absence of precise data, the same estimates have been used throughout the 10-year assessment period. Until producers are required to report to the SA the exact number of scheme articles placed on the market and the weight of each container, there is a significant degree of uncertainty. Another study, based on waste data, has estimated that the weight of metal drinks cans in Scotland is higher than the estimates used in this BRIA.[93] If there is more metal – and aluminium in particular – within the scope of the Scottish DRS, the SA’s income from material revenues will be greater than estimated here; conversely, local authorities’ potential lost revenue would be greater. The environmental benefits would also be greater, and the overall Net Present Value for Scotland could be higher than the current modelling indicates.
| Quantity & Material | Units | Tonnes |
|---|---|---|
| PET Bottles | 963,857,436 | 25,012 |
| Metal Cans | 1,124,553,932 | 14,590 |
| Aluminium | N/A | (14,570) |
| Steel | N/A | (20) |
| Total | 2,088,411,368 | 39,602 |
Source: Defra IA. Excludes containers smaller than 150ml.
157. Defra’s research estimated that 1.2% of PET bottles and 0.01% of cans would be excluded from the scope of the DRS after the minimum size of container was increased to 150ml. The estimated numbers of containers below this threshold have accordingly been discounted from the figures in Table 6 used in the modelling.
158. The deposit value(s) will be set by the SA so that they can choose a deposit that is proportionate and supports their return rate targets. For the purposes of the modelling, 20p has been used for all containers, in line with Defra’s IA assumptions and the deposit level set out in the Deposit and Return Scheme for Scotland Regulations 2020 for Scotland.
Table 7: Modelled DRS Return Rates
Return Rate by Year
2027: 70%
2028: 70%
2029: 80%
2030: 90%
2031: 90%
2032: 90%
2033: 90%
2034: 90%
2035: 90%
2036: 90%
The return rates used in the modelling reflect the targets in the regulation. In 2027, the scheme operates from October. Due to the quality of material collected and the SA’s incentive to maximise revenues, it is assumed that all of the material collected by the DRS is recycled. Actual collection rates for in-scope containers will be higher, due to a proportion being collected at the kerbside or in public bins.
Producers
159. For producers, the main external cost will be producer registration fees, which will be determined by the SA and paid per scheme article placed on the market. The fees will vary by material to avoid cross-subsidisation. Producer registration fees will cover the net costs of the scheme, after deducting the SA’s income from unredeemed deposits and material revenues. Producer registration fees will be payable on each scheme article placed on the market in Scotland. This means that the registration fees for each producer will be proportionate to the number of products that producer places on the market.
160. In addition to the scheme costs detailed below, producers will incur internal costs. The agreement on interoperability means that, for producers operating UK-wide, some of the costs are not specific to Scotland.
161. A key cost is changing the container labels to incorporate the scheme logo and any QR or barcode required by the SA. However, producers will not only be changing their labels for containers sold in Scotland and will not have to maintain different SKUs for Scotland. The interoperable nature of the new DRS means that the same label will be valid across the UK. Following the decision to delay the DRS in Wales, the Scottish Government, working with UK and NI Government, is committed to working with the Welsh Government to ensure any interoperability issues are addressed, and will look to learn lessons from international comparators, such as Republic of Ireland with the Northern Ireland border.
162. The Defra IA used a relabelling cost of £2,000 per SKU, with 32,000 SKUs in total across the UK. The removal of glass bottles from the scheme will reduce producers’ relabelling costs by reducing the number of SKUs within the scope of the scheme. The relabelling costs are apportioned to Scotland on a per-capita basis, as a proxy for number of units. Precise costs will vary by producer and by SKU, but advance warning could enable producers to coincide the DRS label changes with any changes to labels planned for business reasons.
163. Additionally, producers will incur some compliance costs. In addition to pre-existing internal monitoring of sales, producers under the DRS will be required to report the following information to the SA – the number of scheme articles marketed, offered for sale, or sold in Scotland; the material which those scheme articles were made from; the size of the scheme packaging; and if any of the scheme articles were sold in multipacks, the size of those multipacks. Deposits will also need to be added to customer invoices. Some staff training may be required for familiarisation and to support compliance. These potential costs are not quantified in the BRIA due to a lack of data, but it is worth noting that there is some familiarisation costs and reporting requirements associated with the new packaging EPR system for other types of packaging waste.
Retailers
164. For groceries retailers operating return points, the most substantial cost is the cost of providing a return service. However, the SA will compensate for this with handling payments for each container they take back. Return point costs are detailed in the Scheme Costs section. As handling payments can be based on average costs incurred by return point operators, it is possible that some retailers will be paid a surplus in handling payments, relative to their actual costs, while some retailers’ costs may not be covered in full. However, the SA will have the option to set different costs for different classes of return points, which could mean handling payments more closely match the costs of return point operators in different circumstances.
165. It is possible that handling payments will be different in Scotland compared to the rest of the UK. This is because the handling payments will be within the control of the SA and there will not be a requirement for the handling payments to be set at the same level across the UK. This will be a decision for the SA to take, having taken account of the criteria set in the DRS legislation.
166. Whether or not a retailer hosts a return point, there will be costs associated with the DRS. For instance, shelf labels and till systems may need to be modified to show the deposit separately and there may be familiarisation costs for staff. While training costs are included in the scheme costs for return points, adaptation costs for retailers selling deposit-bearing containers have not been quantified. Costs are expected to be minimal and retailers in any case often modify their shelf labels, for instance to reflect price changes or promotions.
167. To varying extents, there could also be an effect on retailer cash-flow, if there is a gap between retailers paying the deposit to their suppliers and customers purchasing the drink with the deposit; this will depend on the payment terms for the drinks. For return points, there will be a gap between them refunding the deposit to consumers and being reimbursed by the SA; repayment periods are a contractual arrangement between the SA and return points.
HORECA and wholesalers
168. Businesses in the hospitality and wholesale sector may register to operate a return point voluntarily but are not assumed to do so in this BRIA. The involvement of these businesses is therefore limited to their role as drinks vendors. HORECA businesses are expected to be a “closed-loop” venue, meaning that they do not charge deposits on scheme articles which are sold for consumption on the premises.
169. HORECA businesses will pay the deposit to their suppliers and will have to store the containers safely and securely so that they can claim a deposit refund. While the businesses would in any case be handling drinks container waste and would need to arrange for the waste to be collected and processed, the DRS means the containers will have to be stored intact and are more valuable. It is assumed that HORECA businesses will need one bag per week to store the containers and they will need to arrange a collection with the SA. The time between paying the deposit to suppliers and reclaiming it from the SA could have an impact on some businesses’ cash-flow.
Scheme Costs
170. The paragraphs below detail the scheme costs that will be funded by producer registration fees, unredeemed deposits and material revenues. It is not known whether the same producer registration fees will be charged by the Scottish SA and SA(s) in other parts of the UK – this is a decision for the SA. As discussed below, regulatory costs could vary between the different national regulators. It is also possible that the Scottish islands and remote nature of parts of rural Scotland mean some containers may be transported further than average, or the logistics could be more complex than other parts of the UK; this could increase per-container logistics costs in Scotland compared to other parts of the UK. Other costs, such as wages, land and rents will also vary across the UK. It will ultimately be for the SA(s) to assess whether differences in the various costs balance out. Charging the same producer registration fees across the UK is likely to support interoperability and reduce the scope for fraud.
Scheme administrator set-up and administrative costs
171. The Scheme Administrator will employ staff such as a CEO, a CFO, administrative support and customer service personnel. The precise number will depend on the Scheme Administrator’s decisions about what level of staffing is needed to run an efficient scheme and which services to outsource. Staffing levels could also depend on the degree of overlap between the Scottish Scheme Administrator and the scheme administrators in the other parts of the UK.
172. The Defra IA assumed 50 staff for England and Northern Ireland, based on international examples, which they reduced to 40 after the first year. Some of the positions are not dependent on the size of the country and the 5 staff implied by adjusting Defra’s figures for the Scottish population is not considered sufficient at this stage. For Scotland, Norway is assumed to be an appropriate comparison, given the two countries’ similar populations and Norway is known to have a highly-efficient DRS. Norway’s Scheme Administrator, Infinitum, has 13 staff at its headquarters.[94] It should, however, be noted that Re-turn in the Republic of Ireland planned 30 staff, so there is considerable variation.[95] Actual staffing requirements will be a decision for the SA. Staffing bands and costs are shown in Table 8, with the proportion of staff in each band reflecting Defra’s staffing distributions for England and Northern Ireland.
| ONS Occupation Description | Salary plus non-wage costs | Assumed Number in SA |
|---|---|---|
| Corporate Managers & Directors | £88,976 | 2 |
| Professional Occupations | £58,714 | 6 |
| Administrative and Secretarial Occupations | £35,814 | 1 |
| Customer Service Occupations | £33,154 | 4 |
Source for salaries and costs: Defra IA
173. The Defra IA did not include the costs of running an office or premises, as there is too much uncertainty about decisions the SA will ultimately make. These costs are similarly excluded from the BRIA.
174. The SA is due to be designated in 2025, so will be incurring costs before the scheme is officially launched in 2027 and producers are paying fees. Such initial costs would typically be funded by a loan, with repayments incorporated into the scheme’s annual operating costs and supported in the scheme’s formative period by a lower return rate and the time-lag between deposits being initiated and refunded. Staffing costs for 2025 and 2026 are included in 2027 for the purposes of this BRIA.
IT Costs
175. A DRS relies on a comprehensive database to track the precise details of all the scheme articles placed on the market (e.g. the dimensions and weight of each type of container); the numbers placed on the market; and the number of containers returned. The IT system will include an interface for producers and return points.
176. As the IT system is a significant cost, and will support interoperability, it is assumed that there will be a single IT system across the whole of the UK. The Defra IA assumed a standardised barcode cost-based system, estimated to cost £0.00019 per container. The IA notes that the system could potentially be upgraded to a digital costs system, depending on the SA’s chosen RVM specifications. It is estimated that such a digital system would cost approximately 36% more.
177. Defra has apportioned 87.2% of the cost to England and Northern Ireland, reflecting their share of the UK population. On this basis, Scotland would account for 8.1% of the total IT cost. This equates to approximately £100,000 in the first year and £410,000 in subsequent years. The reduced scope of the interoperable approach should mean that IT costs are lower than previously estimated for the Scottish DRS.
Communication campaign
178. Prior to, and following, the scheme launch, effective communication campaigns are needed to ensure business understand their obligations and to support and maintain a high return rate. This is particularly important in the early stages, to ensure consumers are aware of the system, when it is launching, what containers will be included, and how they can claim their refund. A more consistent approach across the UK could mean that there is less need to raise awareness of differences between the various schemes than if, for instance, there were divergent scopes, deposit values, logos or return systems.
179. Defra took estimates from Scheme Administrators in other countries of €2 million in the first year of the scheme (2027), €1 million in the preceding year (2026) and €100,000 two years before launch (2025). Reflecting the increasing return rate targets, an annual communications budget of €2 million was also assumed for 2028 and 2029, and then €1 million in subsequent years. Defra then scaled these figures for population and converted them to GBP.[96] These estimates will accordingly be adjusted for the Scottish population, but it will be for the Scheme Administrator to determine how much they need to invest in communications and targeted campaigns in order to meet their return rate targets.
Counting and Bulking Centres
180. The SA arranges for returned containers to be collected from return points and transported to bulking and/or counting centres. Typically, all containers returned manually (i.e. not to RVMs) are counted at counting centres, while all containers counted and compacted at RVMs are baled ready for onward transport to the recycler.
181. The number, location and specification of these centres will be determined by the SA, which will balance the capital and operating costs of the centres with logistics costs. Depending on any separate contractual arrangements reached with producers or retailers, it is possible that their distribution centres could be used as bulking points to reduce costs.
182. The exclusion of glass from the scheme could reduce the infrastructure required compared to the previous plans for the Scottish DRS with glass. Excluding glass reduces the average weight of containers to be transported and means there are fewer containers to be counted at counting centres.
183. The Defra IA cites Scottish figures provided by Biffa, putting the annualised cost of a bulking centre at £450,000 and the annualised cost of a counting centre at £5,290,000. These costs are 6% and 13%, respectively, lower than the annualised costs of bulking and counting centres for a system that includes glass.
184. Defra has assumed 14 counting centres and 80 bulking centres for England and Northern Ireland; scaling for population and taking into account previous plans for the Scottish DRS, it is assumed in this BRIA that Scotland will have 2 counting centres and 7 bulking centres.
Logistics
185. The SA is responsible for transporting the containers from return points to bulking centres and counting centres if applicable. The SA could contract an external logistics provider(s) or develop an in-house service. The SA may also reach agreements with larger retailers who are willing and able to provide a backhauling service to transport the containers back to their warehouses or distribution centres, utilising the empty space in their vehicles once they have made a delivery. This can reduce the financial cost and carbon impact of the logistics operation but will not be feasible in all circumstances.
186. The SA will use data from RVMs to develop their collections model, but previous research in Wales and Scotland has indicated a cost of £213 per tonne for a DRS with PET and metal.
Compliance and monitoring
187. SEPA will be the scheme regulator for Scotland and will recoup costs from the SA. At this stage, it has not been possible for SEPA to quantify their staffing requirements relating to the DRS, or the cost of compliance and enforcement activity; the regulatory effort and costs involved will be assessed as part of their business planning prior to the scheme launch in 2027. However, based on historic costings, SEPA’s annual costs have been provisionally estimated for the purposes of this BRIA at around £1.3 million. This cost is likely to change as SEPA undertakes its more detailed preparatory work for the DRS, so there is a significant degree of uncertainty about the costs that will ultimately be charged to the SA.
188. The Environment Agency has estimated that 10-20 staff would be required for England, at a cost of approximately £100,000 each per annum. Due to different regulatory arrangements in Scotland, England, and Northern Ireland, there could be a difference in the regulatory component of the producer fee in Scotland compared to the rest of the UK. For example, in England, the Environment Agency will be the enforcement authority for DRS as it relates to producers and the SA only; Trading Standards will deal with the enforcement of regulations as they relate to retailers. In Scotland, SEPA will be the enforcement authority for producers, the SA, and retailers/return point operators.
Fraud and Leakage
189. Any DRS is susceptible to fraud and the SA will be responsible for cost-effective fraud prevention measures to reduce the costs of the scheme. To ensure that potential losses from fraud are included in the scheme costs, it is assumed that fraud equates to the deposits of 1.25% of containers placed on the market.
190. Defra used this estimate as a midpoint of the advice they received. It is lower than the 1.5% assumed in the 2019 Scottish Full Business Case, but the interoperability with the rest of the UK should help to reduce the potential scope for fraud across the Scottish border.[97] The delay to the Welsh scheme could increase the fraud risk – given that containers with a deposit logo could be sold in Wales but no deposit would have been paid – but the financial impact of this depends on decisions that are yet to be made by the Welsh Government and the SAs. The land border between Wales and England means the fraud risk is likely to be a greater concern for the English SA than for the Scottish SA, but containers could still be relatively easily transported from Wales to Scotland.
Return Points
191. In existing DRSs, the most significant scheme cost is handling fees paid to retailers to compensate for the average costs of taking back containers in an efficient manner. Such fees are often differentiated by material, with a higher rate for containers returned to compacting RVMs (for which fraud losses and logistics costs should be lower). Informed by evidence from existing DRSs on the high proportion of containers returned to RVMs, it is assumed for the cost modelling that 9% of containers placed on the market are returned manually.
192. The SA will determine specifications for the RVMs to ensure compatibility with their IT system. Retailers will then choose whether to install an RVM, which size and how many, which will depend on the size of the retailer and their expected volume of returned containers. Indicative costs and assumptions used in the Defra IA are shown in Table 9. In line with the assumed number of return points, Defra’s return point costs have been scaled by population for Scotland.
| Retailer Type & Operational Factors | Small convenience | Convenience Stores | Medium supermarkets | Large supermarkets |
|---|---|---|---|---|
| RVM | None | 1 small | 2 medium | Large, 4 in-feeds |
| Capital cost per store | N/A | £14,000 | £39,400 | £84,000 |
| Housing costs if outdoor | N/A | N/A | £14,000 | £70,000 |
| Staff time | 4 seconds/ container | 5 minutes/ day | 10 minutes/ day | 30 minutes/ day |
| Space per RVM | N/A | 0.65m2 | 1.4m2 | 10.4m2 |
| Bags per day | 1.2 | 2 | 4 | 6 |
| Cost per bag | 21p | 21p | 21p | 62p |
193. While the Defra IA and the previous Scottish Full BRIA assumed RVMs are bought, retailers can also lease them from RVM manufacturers, paying per container received. While a lease agreement could include maintenance, costs are estimated to be 3% of the initial capital costs in the first three years (when the RVM might be covered by a warranty) and 10% for the remaining years. An RVM lifespan of 8 years has been used, meaning RVMs would be replaced in 2035. Installation costs have been calculated at 6% of the capital cost.
194. The Defra IA takes into account both the rental cost of the space used for the DRS, shown in Table 10, and the opportunity cost of lost retail space, estimated at £426/sqm. It is assumed that all small RVMs are housed internally, while half of medium and large RVMs are housed externally, but this will ultimately be a decision for the individual retailer.
Table 10: Return Point Space Costs
Store and Area rental cost/ sqft
Convenience store - sales area: £24.00
Convenience store - storage area: £6.00
Supermarket - sales area: £18.00
Supermarket - storage area: £4.50
Supermarket car park: £7.00
Source: Defra IA, based on British Retail Consortium estimates
195. Any devices required for manual takeback are not included in the monetised costs due to the level of uncertainty about what could be required and the likelihood that additional costs – beyond equipment retailers already have – will be relatively small.
196. Retailer return points will also incur some training and familiarisation costs; this is expected to take 1 hour for shops with an RVM and 30 minutes for manual shops. Training is assumed to be required annually, to allow for staff turnover. The Defra IA assumptions on the number of staff to be trained are shown in Table 9. Defra used ‘Wholesale and retail trade’ median hourly earnings (excluding overtime) data from the Annual Survey of Hours and Earnings (ASHE) ONS report. This gave a cost of £14.50, plus a 22% additional cost to reflect non-wage elements of staff costs. For consistency, and because it is not known at this stage whether there will be different Handling Payment rates in Scotland and England, the same values are used here. It should, however, be noted that wages vary across the UK. Between 2005 and 2019, nominal pay in Scotland was lower than nominal pay in the UK but, in 2024, gross median weekly earnings for full-time employees in Scotland were 1.5% higher than in the UK.[98] The increase in weekly earnings in Scotland between 2023 and 2024 was lower than in England.[99]
Quantified Costs
197. The breakdown of the modelled costs for Scotland in each of the 10 years (undiscounted) is shown in Table 11. This does not include unquantified costs, or the benefits discussed in later sections.
| Cost (£m) | 2027 | 2028 | 2029 | 2030 | 2031 | 2032 | 2033 | 2034 | 2035 | 2036 |
|---|---|---|---|---|---|---|---|---|---|---|
| SA staff | 1.6 | 0.7 | 0.7 | 0.7 | 0.7 | 0.7 | 0.7 | 0.7 | 0.7 | 0.7 |
| IT | 0.1 | 0.4 | 0.4 | 0.4 | 0.4 | 0.4 | 0.4 | 0.4 | 0.4 | 0.4 |
| Communications | 2.9 | 1.9 | 1.9 | 0.9 | 0.9 | 0.9 | 0.9 | 0.9 | 0.9 | 0.9 |
| Counting & bulking centres | 13.7 | 13.7 | 13.7 | 13.7 | 13.7 | 13.7 | 13.7 | 13.7 | 13.7 | 13.7 |
| Logistics | 1.6 | 6.1 | 6.7 | 7.6 | 7.6 | 7.6 | 7.6 | 7.6 | 7.6 | 7.6 |
| Carbon of additional transport | 0.2 | 0.8 | 0.8 | 0.9 | 0.9 | 0.8 | 0.8 | 0.8 | 0.8 | 0.8 |
| Carbon of operating DRS | 0.1 | 0.2 | 0.2 | 0.3 | 0.3 | 0.2 | 0.2 | 0.2 | 0.2 | 0.2 |
| Compliance and monitoring | 1.3 | 1.3 | 1.3 | 1.3 | 1.3 | 1.3 | 1.3 | 1.3 | 1.3 | 1.3 |
| Fraud & Leakage | 1.3 | 5.2 | 5.2 | 5.2 | 5.2 | 5.2 | 5.2 | 5.2 | 5.2 | 5.2 |
| Relabelling | 4.1 | 0.0 | 0.0 | 0.0 | 0.0 | 0.0 | 0.0 | 0.0 | 0.0 | 0.0 |
| RVM Capital | 53.0 | 0.0 | 0.0 | 0.0 | 0.0 | 0.0 | 0.0 | 0.0 | 53.0 | -39.7 |
| RVM installation | 3.2 | 0.0 | 0.0 | 0.0 | 0.0 | 0.0 | 0.0 | 0.0 | 3.2 | 0.0 |
| RVM housing | 20.0 | 0.0 | 0.0 | 0.0 | 0.0 | 0.0 | 0.0 | 0.0 | 0.0 | 0.0 |
| RVM maintenance | 0.4 | 1.6 | 1.6 | 5.3 | 5.3 | 5.3 | 5.3 | 5.3 | 1.6 | 1.6 |
| RVM bags | 0.2 | 0.6 | 0.6 | 0.6 | 0.6 | 0.6 | 0.6 | 0.6 | 0.6 | 0.6 |
| RVM handling costs | 0.5 | 1.8 | 1.8 | 1.8 | 1.8 | 1.8 | 1.8 | 1.8 | 1.8 | 1.8 |
| Manual return point equipment | 0.1 | 0.2 | 0.2 | 0.2 | 0.2 | 0.2 | 0.2 | 0.2 | 0.2 | 0.2 |
| Manual return point labour costs | 0.6 | 2.4 | 2.8 | 3.1 | 3.1 | 3.1 | 3.1 | 3.1 | 3.1 | 3.1 |
| Retail rental & opportunity | 0.6 | 2.3 | 2.3 | 2.3 | 2.3 | 2.3 | 2.3 | 2.3 | 2.3 | 2.3 |
| Training | 0.2 | 0.2 | 0.2 | 0.2 | 0.2 | 0.2 | 0.2 | 0.2 | 0.2 | 0.2 |
| HORECA costs | 0.0 | 0.1 | 0.1 | 0.1 | 0.1 | 0.1 | 0.1 | 0.1 | 0.1 | 0.1 |
| Indirect Consumer Impact | 6.4 | 25.8 | 29.5 | 33.2 | 33.2 | 33.2 | 33.2 | 33.2 | 33.2 | 33.2 |
| Unredeemed deposits from consumers | 31.3 | 125.3 | 83.5 | 41.8 | 41.8 | 41.8 | 41.8 | 41.8 | 41.8 | 41.8 |
| LA Material revenue losses | 5.9 | 23.5 | 24.2 | 24.2 | 24.2 | 24.2 | 24.2 | 24.2 | 24.2 | 24.2 |
| Indicative Totals | 149.1 | 214.3 | 177.9 | 143.8 | 143.8 | 143.8 | 143.8 | 143.8 | 196.2 | 100.3 |
SA Income
198. The scheme costs above are offset by unredeemed deposits and material revenues, which the SA will retain to reinvest in the scheme’s operating costs. While VAT is not charged on deposits, the SA will be charged VAT on unredeemed deposits.[100] With 30% of containers assumed to be un-returned in the first scheme year, falling to 10% by the third year, the SA’s annual income from unredeemed deposits with a £0.20 deposit would be approximately £42 million – £125 million. This in turn is the value of consumers’ lost deposits for the estimated number of containers placed on the market. VAT is not included in the BRIA, because it is a transfer from business to the Government, but it should be noted that the value of unredeemed deposits to the SA will be reduced by 20%, and this in turn affects the net costs paid by producers.
199. The value of aluminium and PET collected in a DRS is assumed to be higher than if the material is collected at the kerbside due to differences in quality and contamination evidenced in other countries with a DRS. The assumed DRS material prices (paid to the SA) and baseline material prices (paid to local authorities) are shown in Table 12. These values and the estimated tonnages placed on the market (shown in Table 6) would mean the DRS at a 90% return rate would collect £33 million; this compares to £24 million estimated to be collected by local authorities for in-scope drinks containers in the baseline – a 36% increase[101].
| Material & Costs | DRS £ per tonne | Baseline £ per tonne |
|---|---|---|
| PET | 742 | 709 |
| Aluminium | 1,237 | 1,185 |
| Steel | 174 | 174 |
Source: Defra IA
Local Authorities
200. Local authorities across Scotland will be affected by the reduction in material to be collected at the kerbside or public litter bins, and by the reduced littering. Depending on existing recycling volumes and collection schedules, there will be efficiency savings for kerbside collections.[102] These are not quantified here. At the same time, local authorities’ material revenues will be reduced due to the diversion of a proportion of aluminium and PET to the DRS. From 2028 onwards, it is assumed that local authorities lose all revenues from containers within the scope of the DRS, however this is a conservative estimate, as it is likely that some consumers will still recycle their containers at the kerbside. If the containers are intact, it is possible that local authorities could claim the deposit, rather than selling the material. The lost material revenue is estimated here using the baseline values in Table 12; with the assumed tonnage in the BRIA and the estimated baseline recycling rates, this equates to a loss of £24 million each year. Once the DRS is introduced, this will ultimately affect the packaging EPR system, which is responsible for the full net costs of packaging waste.
201. As there will be a reduction in material going to landfill or incineration/ energy from waste (EfW) facilities, the estimated reduction in gate fees is included in the BRIA. It should be noted that there may be other potential savings to local authorities, i.e. through reduced waste collections, however these have not been included in the modelling. The reduction in tonnages sent to EfW and to landfill has been estimated by applying the current disposal split for residual waste in Scotland to the additional tonnage recycled under a DRS.[103] The gate fees per tonne are shown in Table 13; this uses the same source as the Defra IA, but the EfW fee is lower and the landfill fee is higher than the UK median used by Defra for England and Northern Ireland.[104]
Table 13: Local Authority Gate Fees
Scotland median fee per tonne
Energy from Waste: £96
Landfill: £37
Source: WRAP, 2023.
202. Defra estimated the potential litter clean-up savings using previous research, which apportioned total litter clean-up costs in the UK to drinks containers (£172 million).[105] To estimate the potential savings as a result of the DRS, Defra reduced this total cost to £47 million, reflecting a survey in which just 48% of respondents stated cost reductions would occur as a result of reduced littering, and which further indicated that 57% of litter costs related to bin or ground litter removal, while other costs are fixed. The potential savings were further reduced to reflect an assumed 85% reduction in drinks container litter, the modelled return rate and the proportion of drinks containers in the scope of the DRS. This was then scaled by population, so the same values will be scaled for the Scottish population.
Quantified DRS Savings and Benefits
203. Table 14 shows the estimated, undiscounted revenues for the SA, reduced gate fees for local authorities, and the calculated environmental benefits of the DRS.
| Benefit (£m) | 2027 | 2028 | 2029 | 2030 | 2031 | 2032 | 2033 | 2034 | 2035 | 2036 |
|---|---|---|---|---|---|---|---|---|---|---|
| Reduction in litter disamenity | 32.6 | 130.3 | 148.9 | 158.2 | 158.2 | 158.2 | 158.2 | 158.2 | 158.2 | 158.2 |
| LA litter cleanup | 0.6 | 2.3 | 2.7 | 2.9 | 2.9 | 2.9 | 2.9 | 2.9 | 2.9 | 2.9 |
| SA Material revenue | 6.4 | 25.6 | 29.3 | 32.9 | 32.9 | 32.9 | 32.9 | 32.9 | 32.9 | 32.9 |
| Recycling GHG savings | 0.3 | 1.2 | 5.4 | 10.9 | 11.1 | 11.3 | 11.4 | 11.6 | 11.8 | 12.0 |
| LA Gate fee savings | 0.0 | 0.1 | 0.3 | 0.6 | 0.6 | 0.6 | 0.6 | 0.6 | 0.6 | 0.6 |
| Unredeemed deposits to SA | 31.3 | 125.3 | 83.5 | 41.8 | 41.8 | 41.8 | 41.8 | 41.8 | 41.8 | 41.8 |
| Indicative Totals | 71.2 | 284.8 | 270.1 | 247.2 | 247.4 | 247.6 | 247.8 | 247.9 | 248.1 | 248.3 |
Other impacts
204. It is possible that the exclusion of glass could encourage producers to switch from PET or cans to glass bottles, it could also affect consumer choices given that there will be no deposit attached to the glass bottles. However, producers will be paying fees for glass under the packaging EPR scheme, which may minimise any incentive. If there were such an impact, this would affect container manufacturers and waste recyclers, as there would be an increase in glass bottles, and affect the product lines sold by retailers. However, a DRS seems unlikely to significantly distort packaging trends or existing consumer preferences for glass, PET, or cans. This is in part because the relative weight of glass bottles and their fragility means they are unlikely to be considered a direct substitute for cans and plastic bottles, either by distributors or consumers.
205. The exclusion of glass bottles will mean more glass to collect at the kerbside and bring banks, compared to a DRS with glass. This means the costs of the packaging EPR system will not be reduced as much as might be the case if glass bottles were included in the DRS, but existing economies of scale would be maintained.
206. Increasing the minimum threshold from 100ml to 150ml could potentially provide an incentive for producers to reduce the size of any 150ml packaging to avoid the scope of the DRS, but there would be several commercial and financial considerations to take into account before making such a decision.
Scottish firms’ international competitiveness
207. The DRS is not expected to affect Scottish businesses’ ability to compete internationally. Labelling requirements may mean that drinks sold outside the UK could require different labels, without the scheme logo and code. However, exporters may already maintain separate SKUs and may have to comply with different labelling requirements in the importing country. Food products, beverages and tobacco products accounted for 53% of Scotland’s exports in 2021, however 20% of this was spirits, which, if sold in glass bottles, are excluded from the DRS.[106]
208. Defra’s IA does not expect any significant impact on trade and investment. It is possible, though, that the reliable supply of high-quality, food-grade material could stimulate domestic processing markets.
209. The draft set of Amendment Regulations, the Designation Order, and partial Business and Regulatory Impact Assessment (BRIA) were notified to World Trade Organisation (WTO) on 8 January for a statutory 60 day laying period, which ended on the 9 March. No comments were received on the notification.
Benefits to business
210. For environmental and/or commercial reasons, many producers selling drinks in Scotland have voluntary recycled content targets. Additionally, producers have a financial incentive to increase the recycled content of their plastic packaging, with a 30% recycled content exempting the packaging from the Plastic Packaging Tax. According to the Ellen MacArthur Foundation, a 27% annual growth in the share of post-consumer recycled content is needed between 2021 and 2025 to meet brand and retail signatories’ plastic packaging targets.[107] International research relating to five global brands’ voluntary commitments indicated that 2.57 million tonnes of additional PET bottles need to be collected each year, globally, to meet increased demand for recycled plastic.[108]
211. The DRS will increase the supply of food-grade rPET, providing producers with another potential source to help meet their internal voluntary targets and/ or reduce their liability under the Plastic Packaging Tax.
212. Scottish producers selling scheme articles to other parts of the UK will be required to comply with the DRS regulations in that country; the Joint Policy Statement and increased interoperability will mean it should be a more straightforward and streamlined process for Scottish producers because they will already be complying with the Scottish regulations and including Scottish containers will support economies of scale with re-labelling costs.
213. For HORECA businesses paying commercial waste management costs, a proportion of their waste will now be managed by the DRS. Any potential reduction in costs has not been quantified, as this will vary according to the individual contractual arrangements.
214. For retailers, there is anecdotal evidence from other countries, and studies cited by RVM manufacturers, that hosting a return point can be good for business, by providing customers with another reason to visit a retailer and deposit refunds that could be spent in the shop. A survey of RVM users in Sweden indicated that 93% shopped in store when they returned their containers; another study across four countries found that shoppers spent more when they returned a container, compared to shoppers not returning containers.[109]
215. The DRS presents opportunities for charities and community groups to raise funds, either by collecting unwanted deposit-bearing containers, or by inviting consumers to donate their refunds, including via RVMs.
216. It cannot be known whether containers collected in Scotland will be reprocessed in Scotland. However, the DRS will provide a reliable, increased supply of material that could support increased recycling capacity, and this domestic reprocessing could reduce transport costs.
Small business impacts
217. Producers selling 5000 (6250 in the first year of operation) or fewer units of an individual product line across the UK will be able to register those products as Low Volume Products. This is different to the baseline, where the de minimis threshold is based on whole business activity, rather than individual product lines. Producers of low volume products will have to register with the SA and report their sales, but they will not incur any registration fees for the product line and will not have to change their containers or labels; nor will they be required to charge a deposit on these low volume products. The cross-nation approach could make monitoring and enforcement more straightforward. Containers filled at the point of sale (e.g. “Crowlers”) will be included as low volume products if the producer (the premises where the container is filled) sells 5000 (6250 in the first year of operation) or fewer units. Producers’ individual sales are not known at this stage – it will only be possible for the eventual SA to obtain this data, but Table 15 shows the distribution of drinks producers in Scotland by beverage type and turnover band. This indicates that 30% of beverage manufacturers (120, including distillers) are in the lowest turnover band.
| Manufacturers & Turnover Size Bands | Spirits | Cider & other fruit wines | Beer | Soft drinks & Bottled waters | Manufacture of beverages |
|---|---|---|---|---|---|
| 0-49 | 75 | 35 | 10 | 120 | |
| 50-99 | 35 | 15 | 5 | 60 | |
| 100-249 | 45 | 30 | 10 | 85 | |
| 250-499 | 25 | 10 | 0 | 40 | |
| 500-999 | 15 | 10 | 5 | 30 | |
| 1,000-1,999 | 10 | 10 | 5 | 25 | |
| 2,000-4,999 | 10 | 5 | 0 | 15 | |
| 5,000-9,999 | 5 | 0 | 0 | 5 | |
| 10,000-49,999 | 10 | 0 | 0 | 10 | |
| 50,000+ | 15 | 5 | 0 | 20 | |
| Total | 245 | 5 | 125 | 30 | 405 |
Source: ONS. SIC Codes: 1101; 1103; 1105; 1107; 11. Manufacture of wine from grape, manufacture of malt and manufacture of non-distilled fermented beverages not shown as 0 enterprises listed. Totals do not always add up as figures have been rounded to avoid disclosure; this includes rounding down to zero, so all zeros are not necessarily true zeros. Totals across tables may differ due to the disclosure methods used.
218. Groceries retailers will have the choice of providing a manual service or installing an RVM, depending on what is most appropriate for their shop and expected returns volumes. Groceries retailers in urban areas will qualify for an exemption if their retail space is less than 100m2. Using the Defra methodology in Table 3, 965 retailers in Scotland, representing 20% of the total, will be exempt. While this may be preferable for some small groceries retailers, others could be concerned that redeeming a deposit could give potential customers a reason to choose a nearby larger competitor; any exempt groceries retailers wanting to provide a returns service could apply to the SA to operate a voluntary return point.
219. There are no automatic exemptions for smaller groceries retailers in rural areas. This is to protect accessibility for consumers. While there are additional social and equalities considerations for the accessibility of return points in more remote areas of Scotland, the storage space required for returned containers will be a particular concern for very small groceries retailers on the Scottish Islands. They could apply to the SA for an exemption, particularly if there is a larger groceries retailer that would be a more appropriate return point for the island. The SA would typically take into account convenience for the consumer, but also whether or not it is efficient to have two return points in close proximity – exempting the smaller groceries retailer would mean fewer collection points for the logistics operation and could mean a higher proportion of containers are returned to an RVM, which will ultimately reduce fraud and transport costs. As part of the application process to be SA, the Scottish Government assessed the SA candidate’s proposed approach to return points in rural and island communities.
Investment
220. It is not expected that there will be significant measurable impacts on investment, and therefore make Scotland a more, or less, attractive place for global investment. Defra’s impact assessment does not expect any impacts on international trade and investment.
221. There are however several areas in which a DRS may incentivise further investment in the recycling and circular economy sectors in Scotland. For example, in the 2021 second consultation published by the UK and Welsh Government, and DAERA in Northern Ireland, some responses noted that a benefit of DRS may be increased economic stimulation and the creation of jobs from the scheme.[110] A study in 2015 estimated that a DRS in Scotland (covering glass bottles as well as plastic and cans) could create between 250 and 360 FTE jobs.[111]
222. A DRS is expected to have a positive impact on local amenity through the reduction of littering. Poor local environmental quality has been shown to discourage inward investment and may suppress property prices, damaging local economic growth.[112] Therefore, in an indirect manner, a DRS may serve to create a more conducive environment to inward investment for Scotland’s communities. Perhaps particularly in the tourism and recreation sectors.
223. A DRS will require investment in capital to allow for the efficient operation of the scheme, such as RVMs, and will necessitate inward investment from businesses which provide these assets. Furthermore, a guaranteed supply of high-quality DRS materials should incentivise investment in the industry. There are some risks that will be identified in terms of high-quality DRS material being exported which could undermine this secondary benefits.
Workforce and Fair Work
224. There are no expected impacts on supporting inclusive recruitment or job satisfaction. Nor are there expected to be impacts that would affect businesses’ ability to meet the Fair Work First Principles.
225. It is not known at this stage if Handling Payments will reflect average retail wages in Scotland or across the UK. The level of the Handling Payments will be set by the SA and this process would usually involve negotiations with representatives of the retail industry. In terms of retail staff, the DRS will only account for a small proportion of an employee’s time, as indicated by the assumptions in Table 9.
226. It is possible that there may be indirect impacts on businesses from increased costs from DRS implementation and operation that may impact some businesses’ ability to pay workers at least the Real Living Wage. Impacts on producers should be minimised by the inherent incentive of an industry-led SA to minimise producer fees where possible.
Climate change/ Circular Economy
227. As outlined in previous sections, a DRS will directly align with the Scottish Government objectives surrounding climate change and the circular economy. As a DRS allows for the more circular management of drinks containers through reducing litter and residual waste disposal; reducing negative environmental externalities; providing a greater quantity and quality of recyclate; and creating greater investment in domestic reprocessing capacity, the proposed policy will greatly help businesses to contribute to climate and circular economy targets.
228. The DRS will contribute to the recycling of resources by businesses. One of the primary objectives of DRS is to provide a high-quality stream of recyclate. It is not directly intended to provide for the reduction or reuse of drinks containers. There is however a more indirect impact on overall material use from the reduction of littering, which should serve to offset the production of drinks containers from virgin material sources.
229. Analysis of the environmental impacts, using the estimated tonnages placed on the market, indicates that a DRS with a 90% return rate could recycle an additional 2,400 tonnes of aluminium and steel and 6,400 tonnes of PET per year, compared to the baseline. Taking into account the additional reduction in emissions from avoided landfill and incineration, the increased recycling is estimated to produce annual carbon savings of 36,000 tonnes CO2e. This has been calculated for the BRIA using 2022 emission factors.[113]
230. Transporting waste will generate greenhouse gas emissions, so these are calculated using the Department for Energy Security and Net Zero’s road fuel emissions factors, and monetised using carbon prices uprated by Defra for 2023 prices, as shown in Table 16. Actual transport emissions will depend on the number and locations of bulking and counting centres, whether the SA utilises backhauling, and on the extent to which electric vehicles are used.
231. In addition to the logistics, there is a carbon cost associated with operating the DRS, with embodied, operational and end of life emissions from the return points and counting and bulking centres. These have been estimated using the same methodology as the Defra IA and monetised using the carbon values in Table 16. Actual emissions could be reduced if, for instance, existing facilities are utilised, or the lifetime of RVMs extends beyond the eight years assumed in the modelling.
Table 16: Carbon Values (£2023)
Year & Carbon values in £ per tonne
2027: 289
2028: 293
2029: 298
2030: 302
2031: 307
2032: 312
2033: 316
2034: 321
2035: 326
2036: 331
Source: Valuing greenhouse gas emissions in policy. Adjusted in Defra IA for 2023 prices.
232. At a 90% return rate, the emissions estimated in this BRIA to arise from the DRS are 9% of the emissions savings resulting from the increased recycling, meaning the annual net impact is a reduction in emissions of 33,000 tonnes CO2e. This would be valued at £11million by the DRS’s tenth year.
233. The monetary incentive provided by DRS will help to build the financial foundation for the circular economy in Scotland. Placing a financial value on a previously unvalued resource, at least in the eyes of consumers, will increase the likelihood that containers are not littered and recycled. The increase in the quantity and quality of recyclate may have additional benefits to the macroeconomy of Scotland. A higher domestic supply of secondary materials provides the opportunity to either offset the need to utilise primary resources which are often provided by global supply chains that can be vulnerable to economic shocks, or to be used as a revenue source for Scottish businesses exporting recyclate to the rest of the UK or abroad.
234. There are also benefits in terms of energy consumption, as recycling materials often requires less energy than producing new ones. For example, recycled aluminium generally uses 95% less energy than aluminium produced from virgin materials[114], and recycling various plastics can reduce energy consumption in manufacturing by between 30-80%.[115] A greater stock of high-quality recyclate provided by a DRS may contribute to fewer environmental impacts of domestic and foreign energy production and manufacture of containers. This may also help Scotland’s world-leading low carbon grid powered by renewable energy to be used more efficiently.
235. Through moving containers higher up the waste hierarchy, a DRS may also contribute towards the preservation and enhancement of Scotland’s natural capital resources. Natural capital refers to the stock of natural resources, including soil, air, water, and biodiversity, that provide ecosystem services essential for human well-being and economic activity.[116] As a significant impact of a DRS is the reduction of litter, this prevents potentially hazardous materials polluting terrestrial and marine environments. Generally, cleaner environments contribute toward effective ecosystem functioning and the provision of various services such as water purification and pollination, which are vital for the functioning of human society too. Scotland in particular benefits from extensive coastline that harbours many of these vital ecosystem services, as well as supporting a major tourism industry.
236. Climate change is a global issue, and although Scotland’s total carbon emissions are small relative to the rest of the world[117], implementing circular economy practices such as a DRS may provide the incentive for other nations and regions to follow suit, thereby creating an overall more conducive environment for the circular economy. Scotland is a modern and open economy that is an attractive market to drinks producers worldwide. The more incentives there are in place to enable responsible consumption, the more producers domestically and globally are likely to change their practices to align with these dynamics.
Competition Assessment
237. Will the measure directly or indirectly limit the number or range of suppliers?
- The DRS legislation will not directly limit the number or range of suppliers in relation to the beverage and retail industry, or the SA. The Scottish Ministers, subject to approval by the Scottish Parliament, will designate an SA for Scotland; the Governments of the UK recognise the benefits of having the same organisation to run the DRSs across the UK, but this is not a mandatory requirement.
- It is possible that the SA will restrict potential suppliers – for instance RVM manufacturers due to the SA’s chosen RVM specification – but this will be a decision for the SA. They will need to consider factors such as fraud prevention measures and compatibility with the IT system.
238. Will the measure limit the ability of suppliers to compete?
- The Scottish Government worked with other UK nations to ensure that the SA application process was joined up with the application process in England and Northern Ireland. This included applicants demonstrating how they would work with DRSs in other parts of the UK.
- The Scottish Government advised industry on the application process and how to obtain the application form through existing sector-specific communications and by sending information to industry bodies. Scottish Ministers will consider the applications received. Once a candidate has been agreed by Scottish Ministers, a designation order will be laid before the Scottish Parliament to formally designate the Scheme Administrator.
- For producers and retailers, interoperability supports a more level-playing field as any differences in the application or level of the deposit could potentially advantage one side of the border over the other.
239. Will the measure limit suppliers’ incentives to compete?
- No, as there is a level playing field in relation to the deposit which must be charged on scheme articles.
240. Will the measure affect consumers’ ability to engage with the market and make choices that align with their preferences?
- No. It is possible that changes, or perceived changes, in price influence decisions, but this BRIA and the Defra IA assume there will not be changes in consumption in response to the deposit. A study by Reloop and the Container Recycling Institute concluded “None of the case studies presented in the report provides definitive evidence to suggest that the implementation (or expansion) of a DRS or an increase in deposit levels caused observed sales declines.”[118]
- Theoretically, excluding materials such as HDPE and glass could incentivise producers to switch to containers outside the scope of the DRS, or encourage consumers to buy beverages in other formats. Similarly, material-based producer fees could potentially affect producer packaging choices (PET fees are usually higher than aluminium fees due to differences in processing costs and material values). However, there are a variety of market dynamics at play, including consumer preferences, material prices and distribution costs, so this IA assumes the DRS will not lead to material-switching.
- The deposit will affect consumer cash-flow, increasing the money needed to buy a drink, but not the actual price of the drink. This will be a concern for some consumers but, as noted above, DRSs elsewhere are not thought to have affected sales. A UK survey found that 60% of respondents said that being able to reclaim a deposit would make them more likely to purchase products included in the scheme.[119]
- Separate to the deposit, producers could choose to pass on all, or some, of the producer registration fee to consumers in the retailer price. However, this is a commercial decision for producers and, as the SA will be industry-owned, it will have an inherent incentive to minimise producer registration fees as far as possible. Additionally, in the absence of the DRS, they would still incur costs through the packaging EPR system and it is not expected that DRS items will increase in price significantly out of line with natural fluctuations or increases seen in EPR items.
- The deposit will mean that littered drinks containers are more valuable, providing an incentive for some people to pick-up the containers to redeem the deposit. This therefore creates a new market.
- The SA will sell the returned containers to generate an income stream for the DRS. SAs in other countries typically invite bids from reprocessors. The quality and quantity of material means the SA could be in a position of market dominance in the recyclate market, but there will be constraints in any quasi-monopolistic power – not least the existence of materials outside the scope of the DRS, and DRS materials returned via the existing waste management system, such as at the kerbside, which will provide additional sources for recyclate.
241. Will the measure affect suppliers’ ability and/or incentive to introduce new technologies, products or business models?
- No.
Consumer Duty
242. The DRS aims to reduce the littering and increase the recycling of deposit-bearing drinks containers. This means consumers will pay a deposit on scheme articles and will have to return the used container to registered return points in order to claim a full refund of the deposit. The DRS has a target return rate of 90% by its third year. Comparable schemes in other countries achieve return rates in excess of this, meaning that the vast majority of containers are returned either by the original consumer or by another individual, but a percentage of deposits will be unredeemed, and this represents a cost to consumers (as well as a source of funding for the SA). For some consumers it will be more difficult to return their container. For example, in rural locations the designated SA will undertake further work to consider the distribution and planning of return points, including consideration of access needs in rural and island areas. Return point obligations will be kept under review as the scheme becomes more established, to ensure the network is appropriate and accessible.
243. This BRIA focuses on the two policy options, no policy change, meaning all drinks containers are managed in the existing waste management system or the introduction of DRS for aluminium and steel drinks cans and PET drinks bottles. As noted earlier the Scottish Government policy which was given effect to in the Deposit and Return Scheme for Scotland Regulations 2020 was to require retailers selling scheme articles online to provide a takeback service. The Amendment Regulations removes this statutory obligation for large retailers to provide a tack-back service. However, those interested in providing takeback services, i.e. retailers or community groups, can apply to the SA and register to provide this service.
244. The Scottish Government, alongside the UK Government and DAERA, will work with the designated Scheme Administrator (SA) to investigate options to support accessibility, including voluntary solutions to takeback. The three nations have committed to keeping this obligation under review.
245. Irrespective of how consumers purchase scheme articles, access to returns points should be as broad as possible. The Designation Order requires the SA to undertake a review of the operation of all of its return points in Scotland at such intervals as it considers appropriate. The SA must consider, amongst other considerations, the location of the return points, in particular whether consumers have reasonable access to at least one return point; and whether there is sufficient access to return points for persons living in villages and rural and areas and on islands. The SA may take steps to either increase or reduce the number of return points based on the outcome of such a review. .
246. The SA will determine the deposit level based on relevant evidence and research. The deposit level may be a fixed or variable rate per container type and size. The chosen deposit level ,may be aligned across Scotland, England and Northern Ireland. The SA will be required to consider the purposes of the DRS, the collection targets, the likely impact of the amount of the deposit on the affordability of scheme articles, the likely impact of the amount of the deposit on the use of scheme packaging by registered producers, the likely impact on the purchase of scheme articles by consumers, the likely impact of if the amount of the deposit were different in Scotland compared to DRS in other parts of the UK, and the likely impact of the amount of the deposit on the operation of DRS in other parts of the UK.
247. Scotland’s DRS will not include glass containers; a decision was agreed to exclude glass containers in line with the English and Northern Irish schemes in order that the scheme may proceed in Scotland. Concerns have previously been raised by industry about the inclusion of glass, with suggestions that consumers may prefer to not take glass bottles to return points.[120] The scheme without glass included could, therefore, be preferable for some consumers. On the other hand, the DRS may not reduce the littering of glass bottles to the same extent as had been previously expected, and other consumers may be concerned by littered, broken glass.
248. The size of DRS scheme articles across the UK will be between 150ml and 3 litres. This is not expected to have any impact on consumers.
249. In addition to the financial value of unredeemed deposits, the BRIA takes into account the indirect consumer impact to acknowledge the time consumers will give to return their used containers and claim their deposit refund. There is considerable uncertainty in estimating this, not least because not all consumers will regard returning their containers as a burden – as evidenced by the high levels of support for DRS in other countries and indicated in opinion polls. Additionally, some containers will be positively returned by people who are not the original consumer but who feel – for financial, environmental and/ or civic reasons – that it is worthwhile to return the container/ redeem the deposit. The previous Full Business Case for Scotland valued the consumer time at £10 million.[121] However, the Defra IA adopted a more conservative approach that will be replicated here. This assumes that consumers return 15 containers in one visit, and that this takes 1 minute per visit. A value is then put on this time using the ONS ASHE median hourly wage of £15.88. For the assumed number of containers in Scotland, this equates to £33 million per year at a 90% return rate.
Costs & Benefits Summary
250. The total results of the costs and impacts modelling are shown in Table 17. These are modelled costs and benefits, reflecting the assumptions used by Defra and in this BRIA; the SA will determine the precise operating and capital costs of the DRS. In its first full year of operation (2028), the DRS is estimated to deliver a net benefit of £71 million. The net benefit falls in 2035 due to the assumed investment in replacement RVMs. Over 10 years, the DRS is estimated to generate savings and benefits of £2.4 billion, meaning a net benefit of £800 million after the deduction of costs. These values have not been discounted for future years; discounted results are shown in Table 18. The results include transfers (such as unredeemed deposits, which are a cost to consumers and a benefit for the SA).
| Year & Annual Cost/Benefit | 2027 | 2028 | 2029 | 2030 | 2031 | 2032 | 2033 | 2034 | 2035 | 2036 | Total |
|---|---|---|---|---|---|---|---|---|---|---|---|
| Costs | 149 | 214 | 178 | 144 | 144 | 144 | 144 | 144 | 196 | 100 | 1,557 |
| Benefit | 71 | 285 | 270 | 247 | 247 | 248 | 248 | 248 | 248 | 248 | 2,361 |
| Net Benefit | -78 | 71 | 92 | 103 | 104 | 104 | 104 | 104 | 52 | 148 | 804 |
251. For consistency with the methodology in England and Northern Ireland, Defra’s overall results have been scaled by population to produce the overall results shown in Table 18. These are discounted costs and benefits over the 10 years, calculated in 2019 prices and 2020 present value. This indicates that a DRS in Scotland will cost £904 million but generate benefits of £1.27 billion. This gives an NPV of £366 million over a 10-year period and a Benefit Cost Ratio of 1.4.
252. While the environmental impacts calculated in the BRIA represent the net benefit of the DRS, taking into account baseline recycling rates, the estimate of gross costs does not take into account existing costs to local authorities of managing drinks container waste, or costs to producers of either PRNs or future EPR fees under packaging EPR. More information on the costs of packaging EPR is included in the Extended Producer Responsibility for Packaging BRIA.[122]
Table 18: Summary of Impacts
2019 prices, 2020 PV, £m
Net Present Value: 365.9
Total Cost: 904.2
Total Benefit: 1,270.1
Source: Defra IA for England and Northern Ireland, adjusted by population for Scotland.