Deep decarbonisation pathways for Scottish industries: research report
The following report is a research piece outlining the potential pathways for decarbonisation of Scottish Industries. Two main pathways are considered, hydrogen and electrification, with both resulting in similar costs and levels of carbon reduction.
2 Introduction
2.1 Background
The Climate Change (Emissions Reduction Targets) (Scotland) Act 2019 sets economy-wide targets for reducing emissions of all greenhouse gases to net zero by 2045 at the latest, with interim targets for 2030 and 2040 mandating emissions reductions of 75% and 90% against 1990 levels respectively.[1] These targets reflect Scotland's increased ambition for climate action and represent a divergence from the UK-wide net-zero target by 2050. This increased ambition could introduce an imbalance between industrial sites in Scotland and those in the rest of the UK. Accordingly, Scotland's updated Climate Change Plan (CCP), expected by the end of 2020, will set out a number of actions to support achievement of the net-zero vision within the context of a Just Transition.[2]
Substantial work has already been carried out in the UK and in Scotland specifically to assess decarbonisation options for industry, including:
- Roadmap development work that led to the 'Net Zero Technical Report' by the Committee on Climate Change (CCC),[3] the UK-wide 'Industrial Decarbonisation & Energy Efficiency Roadmaps to 2050' for UK Department for Business, Energy, and Industry Strategy (BEIS),[4] and the 'Industrial Decarbonisation and Energy Efficiency Roadmaps: Scottish Assessment' summarised in the report by Zero Waste Scotland.[5]
- Sector-specific analyses investigating how individual industry subsectors can best decarbonise, which includes ongoing work on the review of the Scotch Whisky Industry Environmental Strategy, first launched in 2009 by the Scotch Whisky Association.[6]
- Multiple projects investigating ways to deploy low-carbon hydrogen (e.g. H2 Aberdeen)[7] and carbon capture and storage (e.g. Acorn project)[8] in Scotland.
- Work by the UK Government to establish suitable business models for CCUS.[9]
Such work has shown that it would be technically feasible to meet a net-zero target in Scotland by 2045 and possibly sooner, provided that the UK adopts an equivalent target for 2050.[10] This will require deep decarbonisation within all sectors, including industry.
Within this context, the Scottish Government commissioned Element Energy to assess viable pathways to reduce emissions from Scotland's industrial subsectors in line with the accelerated net-zero targets and interim milestones. The results are presented in this report. In parallel, the Scottish Government also commissioned Element Energy to establish and develop an understanding of industrial energy efficiency and decarbonisation projects that are currently in the pipeline, and to develop a database of such projects. That study focuses on the shorter-term development pathways of these projects, and how Scottish Government can aid and influence project sequencing.
2.2 Scope
Industries in scope
The analysis focuses on emissions from existing energy-intensive industries arising either from the on-site combustion of fossil fuels or directly from industrial processes, collectively defined as 'scope 1' emissions.[11] According to the Scottish Greenhouse Gas Inventory, emissions from all Scottish industries combined accounted for 28% of overall Scottish emissions in 2018, or 11.5 MtCO2e out of 41.6 MtCO2e (million tonnes of carbon dioxide equivalent).[12] Within this total, the scope of the quantitative analysis presented below refers to two sets of industrial sites for which site- or sector-specific emissions data could be accessed:
- Large sites required to report their emissions on a yearly basis and whose emissions can be found on the National Atmospheric Emissions Inventory (NAEI) on large point sources,[13] which features 63 large sites operating in industrial sectors within scope (sectoral focus defined below)thatcollectively emitted 6.4 MtCO2e in 2018.
- Members of the Scotch Whisky Association (SWA) (127 sites), whose emissions are analysed within a recent publication by Ricardo for SWA.[14] Net of the 11 large distilleries already included in the NAEI data, the other SWA member sites emitted an additional 0.3 MtCO2e in 2018.
Carbon emissions from industries in scope thus amounted to 6.7 MtCO2e in 2018, which represents 58% of all greenhouse gas (GHG) emissions from Scottish industries in the same year.
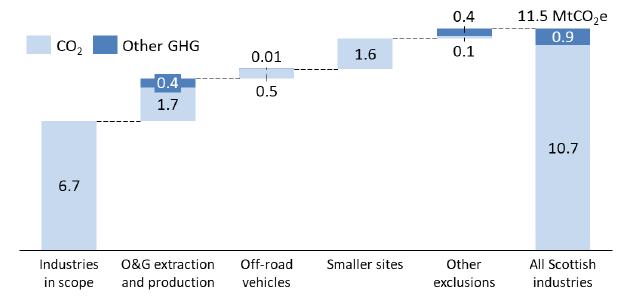
As detailed in Figure 1, the remaining out-of-scope emissions relate to oil and gas extraction and production,[15] off-road vehicles, a multitude of smaller sites for which emissions data is unavailable, and other subsectors which are not in scope for this study. It is worth noting that a small portion (0.02 MtCO2e) of the emissions of GHGs other than CO2 actually originates from sites in scope.[16] However, these were excluded from the scope since they represent a very small portion of the overall emissions in scope (0.3%) and the available evidence does not allow detailed assessment of the corresponding emissions sources. Further detail on out-of-scope emissions and, when relevant, how they were estimated is provided in Appendix 8.3.
Sectoral focus
This study groups Scotland's most energy-intensive industries into the eight sector categories and 22 subsectors reported in Table 1. This categorisation clearly shows that emissions are highly concentrated within a handful of sites and sectors: 75% of all emissions from industries in scope occur within the seven highest-emitting sites which themselves are found in just three sectors, i.e. chemicals, oil and gas, and cement.[17] Combined, these sites accounted for about 12% of all Scottish emissions in 2018.
| Industry sector | Subsector | # sites | 2018 emissions[18] (ktCO2e) |
|---|---|---|---|
| Cement | Cement | 1 | 574 |
| Chemicals and pharmaceuticals | Petrochemicals[19] | 2 | 1,470 |
| CHP[20] | 3 | 727 | |
| Other chemical products | 5 | 204 | |
| Pharmaceuticals | 2 | 42 | |
| Other non-metallic mineral products[21] | 1 | 5 | |
| Food and drink | Distilleries and breweries[22] | 129 | 529 |
| Food products | 9 | 100 | |
| Glass | Glass | 4 | 230 |
| Metals | Aluminium | 1 | 67 |
| Steel finishing | 2 | 16 | |
| Forged products | 1 | 13 | |
| Oil and gas | Refining | 1 | 1,638 |
| CHP | 1 | 465 | |
| Gas terminal | 1 | 357 | |
| Paper and pulp | Paper | 4 | 115 |
| CHP | 1 | 15 | |
| Other energy-intensive industries | Veneer sheets and wood-based panels | 3 | 112 |
| Computers, electronics and optical products | 1 | 17 | |
| Other non-metallic mineral products | 4 | 14 | |
| Rubber products | 1 | 13 | |
| Newspapers, magazines, & other publications | 2 | <1 | |
| Total | 179 | 6,721 ktCO2e |
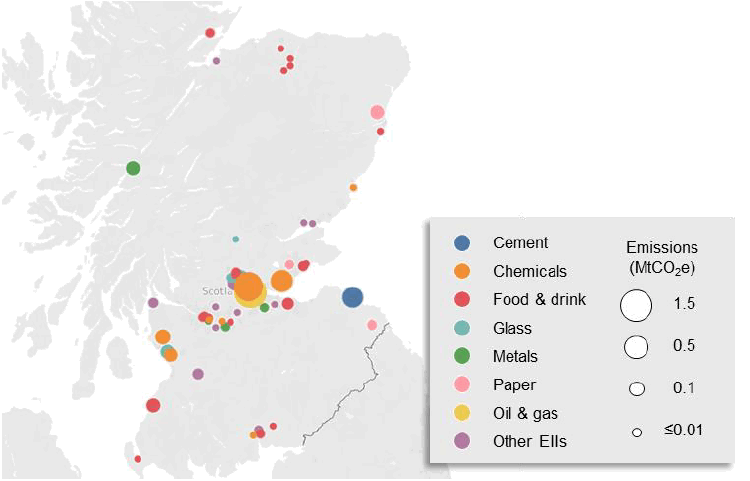
Geographical focus
Industrial emissions are highly concentrated not just sectorally but also geographically, as visually outlined in the map below. Six out of the seven largest industrial emitters as well a multitude of smaller sites are located within 50 km of Grangemouth[23] – the geographical heart of the refining and chemical industries – where approximately 75% of all emissions from the industries in scope arise. Such geographical concentration of industrial activity and emissions carries three main implications:
- It provides a clear geographical priority for future decarbonisation efforts in Scotland since all pathways to net zero must substantially rely on the decarbonisation of the Grangemouth cluster.
- It offers an early insight into potential synergies between neighbouring industries, which could pool their demand for low-carbon energy and the corresponding infrastructure and thus spearhead the early development of low-carbon infrastructure at scale.
- It suggests that decarbonisation options that may be economically viable for clustered sites may not be equally viable for more isolated sites with more limited – and likely more expensive – access to the relevant infrastructure.
2.3 Approach
Assessment of emissions, energy, and fuel use
As a first step, each industrial subsector was represented via simplified archetypes whichenabled a close representation of the energy and fuel use across different industrial processes. Publicly available datasets and literature were used to inform the creation of each archetype. Specifically, site-level emissions of fossil CO2 were obtained from the National Atmospheric Emissions Inventory (NAEI) on large point sources,[25] to which sector-level data from the Scotch Whisky Association was added.[26] Biogenic emissions were then estimated through the comparison of multiple datasets including the NAEI and the Scottish Pollutant Release Inventory (SPRI),[27] and complemented by information provided by industrial stakeholders.
The breakdown of energy and fuel use across different industrial subsectors wasinitially obtained from BEIS' 'Energy consumption in the UK' end-use tables.[28] These tables provide a UK-wide breakdown of energy and fuel use by process type for each subsector (as defined by its Standard Industrial Classification, or SIC), but do not offer a view around possible regional differences. In this study it was initially assumed that UK average values also apply at the Scottish level, but this assumption was later improved based on a previous model of industrial processes by Element Energy, and finally by validating the breakdown with industry stakeholders. Following this approach, all emissions from the industries in scope were mapped against sector-specific and cross-sectoral processes (see Appendix 8.4). The results from this analysis are presented in Chapter 3.
Analysis of relevant decarbonisation options
Relevant decarbonisation options for each emission source were defined via a review of publicly available literature.[29] Three options were found to be pivotal to the deep decarbonisation of energy-intensive industries and represent the core of the quantitative analysis proposed in this study:
- Energy efficiency measures to reduce energy use and hence abate emissions.
- Fuel switching, i.e. replacing fossil fuels with electrification, low-carbon hydrogen,[30] or, in selected cases, bioenergy (including waste biomass).
- Carbon capture, utilisation, and storage (CCUS) applied on combustion and process emissions from industrial sites as well as to decarbonise hydrogen production.
Other decarbonisation options which are only applicable to selected emission sources were reviewed in the context of addressing residual emissions from sources which cannot be decarbonised through the options introduced above. The applicability of each option within each sector was also reviewed with industry stakeholders, and their technical and economic characteristics are discussed in Chapter 4.
Design of viable decarbonisation pathways
Three decarbonisation pathways were designed by combining the above options:
- The first pathway relies on extensive deployment of energy efficiency measures but no fuel switching or CCUS. Accordingly, it is named the Efficiency pathway.
- The other pathways see progressive deployment of fuel-switching technologies and CCUS but a lower uptake of energy efficiency improvements. These pathways are solely differentiated by the deployment of either electrification or hydrogen fuel switching technologies.[31] For this reason, they are named the Electrification and Hydrogen pathways, respectively, and are jointly referred to as the deep decarbonisation pathways.
Since this study seeks to identify the potential impact of the decarbonisation pathways on the current industrial base, rather than to project what emissions will be like as a result of changes to their markets, a core assumption underpinning all pathways is that the scale and type of industrial activity remains steady until 2050. Further detail for each pathway is provided in Chapter 5.
Stakeholder engagement
Stakeholder engagement played a central role in this study. Eight representatives[32] from some of the largest emitting sites within each sector were consulted via telephone interviews to validate the relevance and impact of each decarbonisation option and to understand the challenges they face on the way to implementing any deep decarbonisation pathway. These interviews helped increase the accuracy of the representation of industrial sites responsible for over 90% of in-scope emissions,[33] and were also instrumental to obtain information around the investment cycles and investment criteria that underpin all decarbonisation pathways outlined in this report. The insights gained through these interviews are included throughout the report where relevant, and they are also summarised in Section 6.4.
Contact
Email: Michael.Cairns2@gov.scot