Council Tax Reduction in Scotland: 2021-2022
Council Tax Reduction (CTR) awarded by age, household structure, income sources and employment status, deprivation index, and Council Tax band in the financial year from April 2021 to March 2022. It makes references to the previously published March 2021 for comparative purposes.
4. Chargeable Dwellings and Council Tax Bands
Each chargeable dwelling in Scotland is placed in a Council Tax Band between A and H, depending on the market value of the property as at 1 April 1991. Band A properties are liable for the lowest rate of Council Tax and Band H attracts the highest rate.
Chart 19 shows the proportion of CTR recipients by Council Tax Band in March 2022, with local authority level figures provided in the supplementary tables. There are more CTR recipients in the lower bands, with 40 per cent in Band A compared to just 5 per cent in Bands E to H. This will, in part, be attributable to the spread of dwellings across Council Tax Bands – around three-quarters of chargeable dwellings are in Bands A to D.
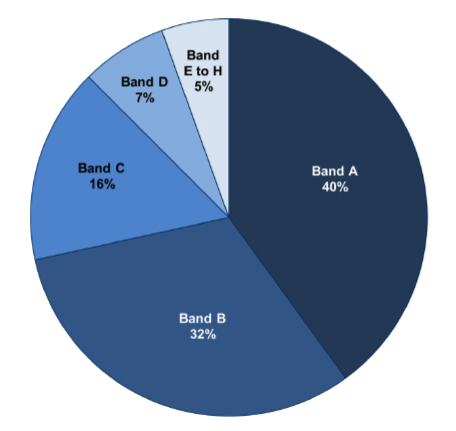
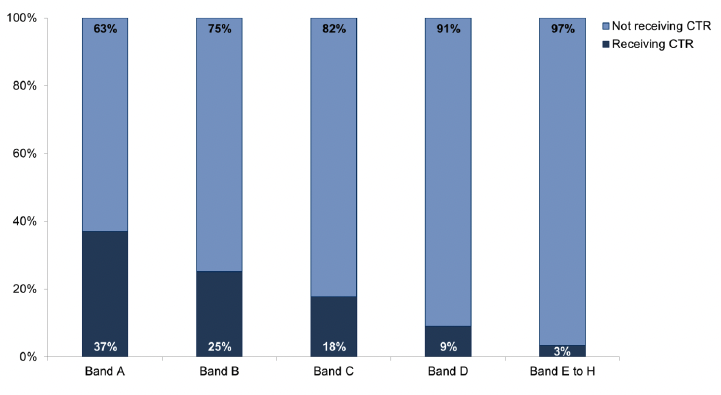
Chart 20 shows the proportion of chargeable dwellings in receipt of CTR by Council Tax band. Band A has the highest proportion of dwellings in receipt of CTR at 37 per cent. The proportion decreases as the Council Tax band increases to only 3 per cent for Bands E to H.
In March 2022, around one-fifth (18 per cent) of chargeable dwellings in Scotland were in receipt of CTR. This figure varied between local authorities, reflecting differences in the household characteristics of the population, Council Tax levels and household incomes. Glasgow City had the highest proportion of their chargeable dwellings in receipt of CTR (30 per cent) and Shetland Islands the lowest (10 per cent). The map in Figure 4 illustrates the proportion of dwellings in each local authority in receipt of CTR, with the relevant data found in the supplementary tables.
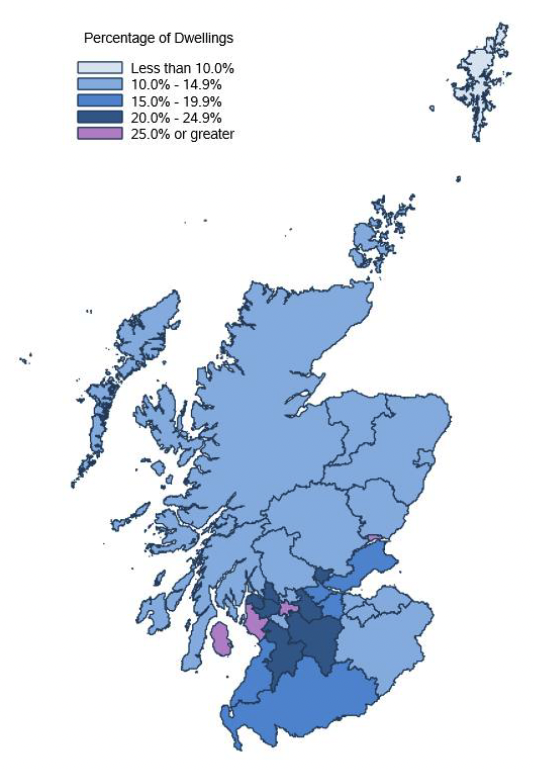
© Crown copyright and database right (2013). All rights reserved.
Ordnance Survey Licence number 100024655. Map generated in SAS Enterprise Guide.
Contact
Email: eddie.chan@gov.scot