Coronavirus (COVID-19): state of the epidemic - 10 September 2021
This report brings together the different sources of evidence and data about the Covid epidemic to summarise the current situation, why we are at that place, and what is likely to happen next.
State of the Epidemic in Scotland – 10th September 2021
Background
This report summarises the current situation on the Covid-19 epidemic in Scotland. It brings together the different sources of evidence and data about the epidemic in Scotland at this point in time, why we are at that place, and what is likely to happen next. This summarises the data up to and including 9 September 2021 on Covid-19 in Scotland. This updates the previous publication published on 3 September 2021[1]. The information in this document helps the Scottish Government, the health service and the wider public sector respond to the epidemic and put in place what is needed to keep us safe and treat people who have the virus.
This edition of the State of the Epidemic summarises current data on Covid-19 at a national and local level, and how Scotland currently compares to the rest of the UK. It looks at the vaccination program in Scotland and the effects that are beginning to be seen from this. Information is provided about variants of concern and what impact these may have. Bringing this information together in one place gives the opportunity to better understand the current state of the epidemic in Scotland.
Key Points
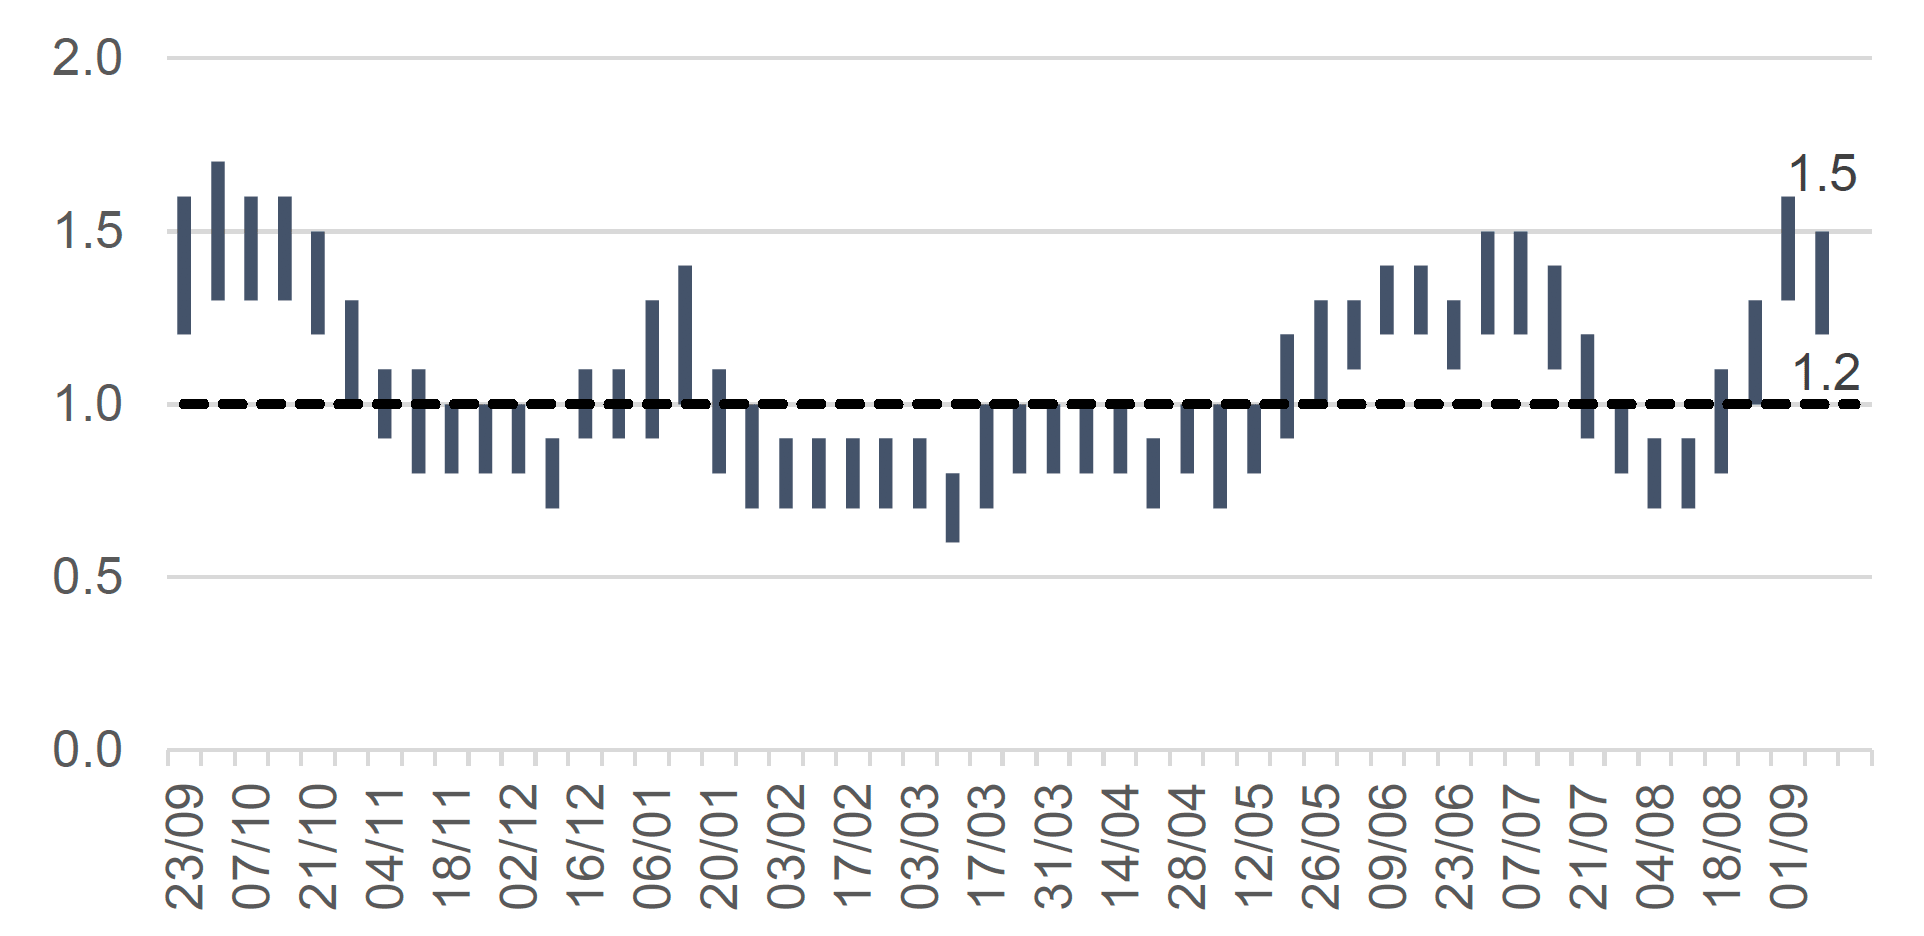
- The reproduction rate R in Scotland, as of 24 August, is estimated as being between 1.2 and 1.5. This is a decrease in the lower and upper limits from last week.
- An average of 6,376 cases were reported per day in the 7 days to 9 September, which is a 6% increase in reported cases since 2 September.
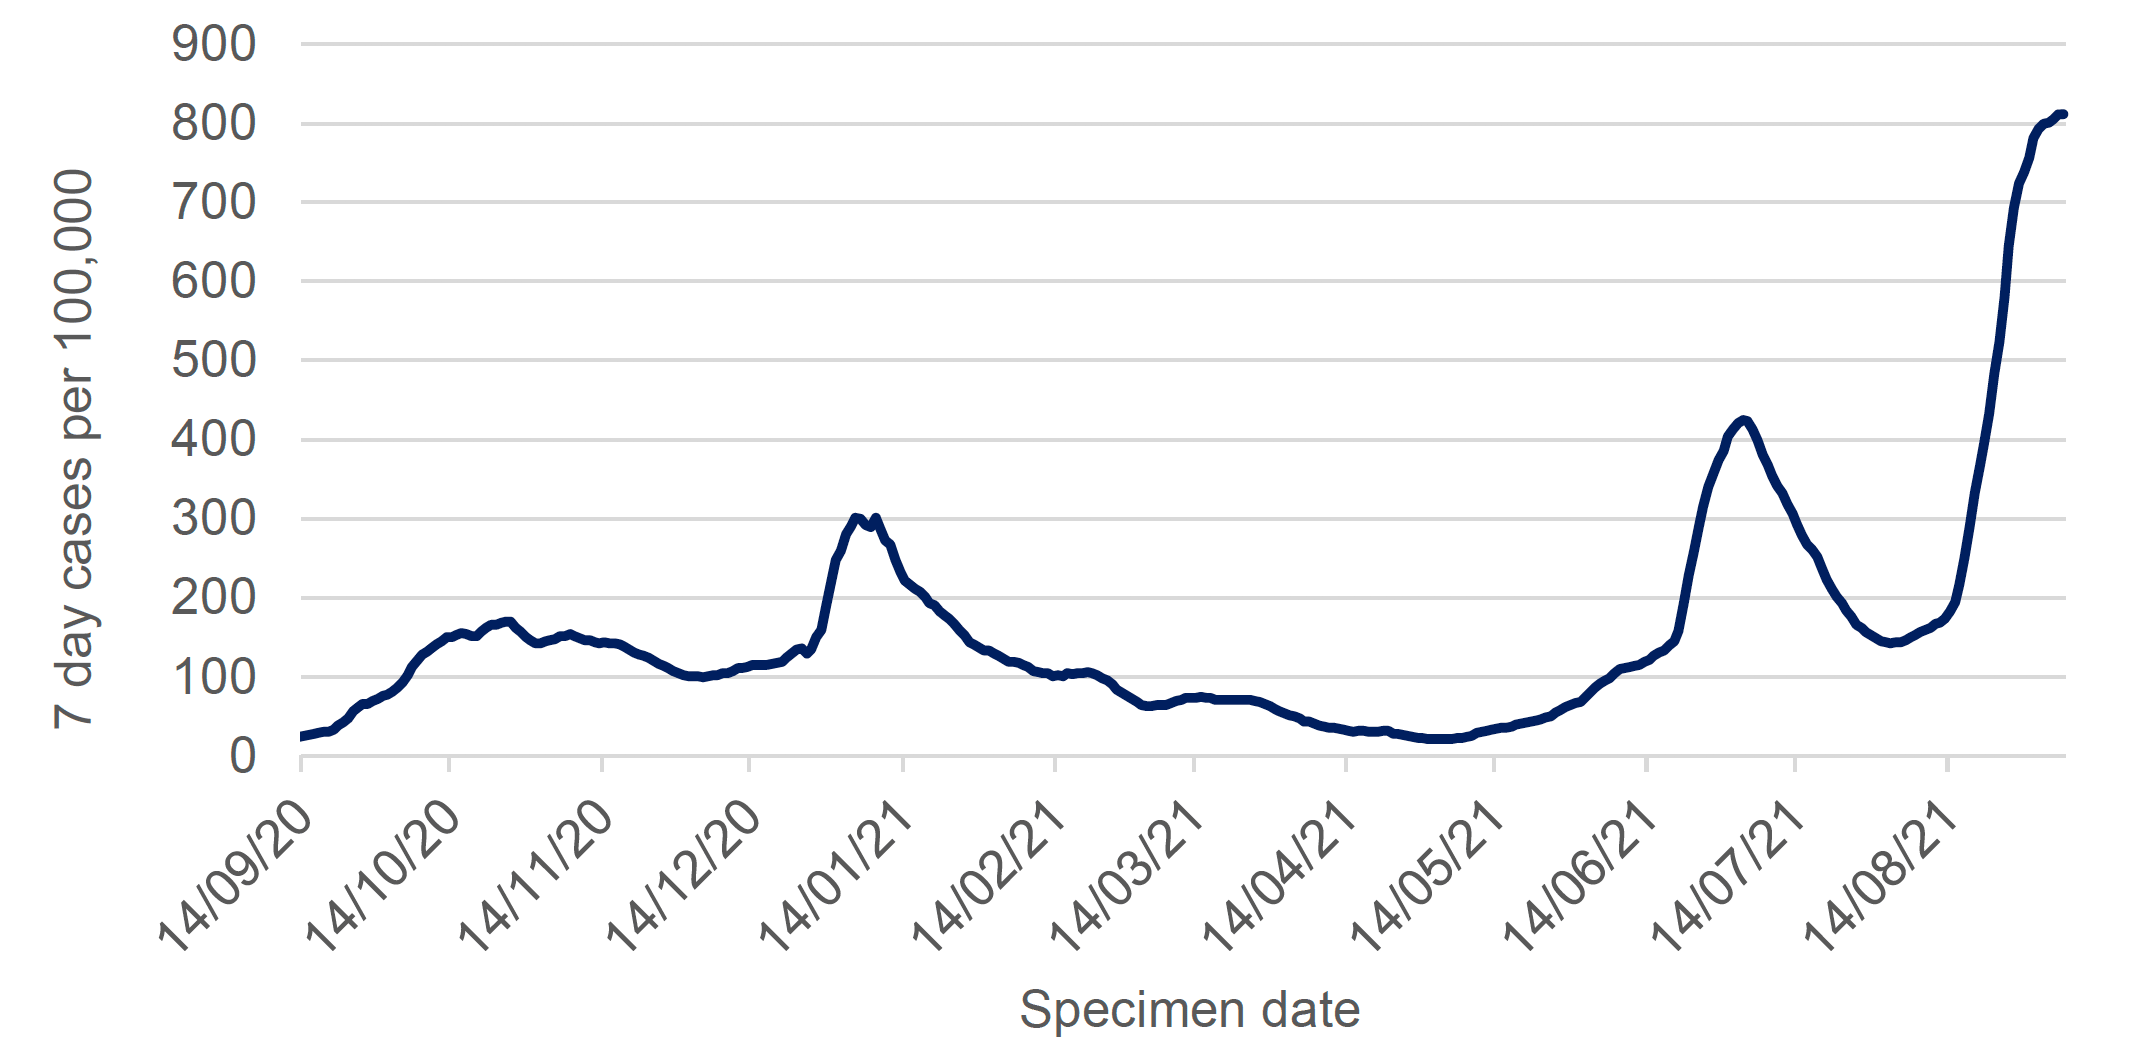
- There were 811 weekly cases per 100,000 in the week to 6 September (by specimen date), which is an increase since last week and the highest since the epidemic began. The previous peak was recorded on 3 July with 425 weekly cases per 100,000.
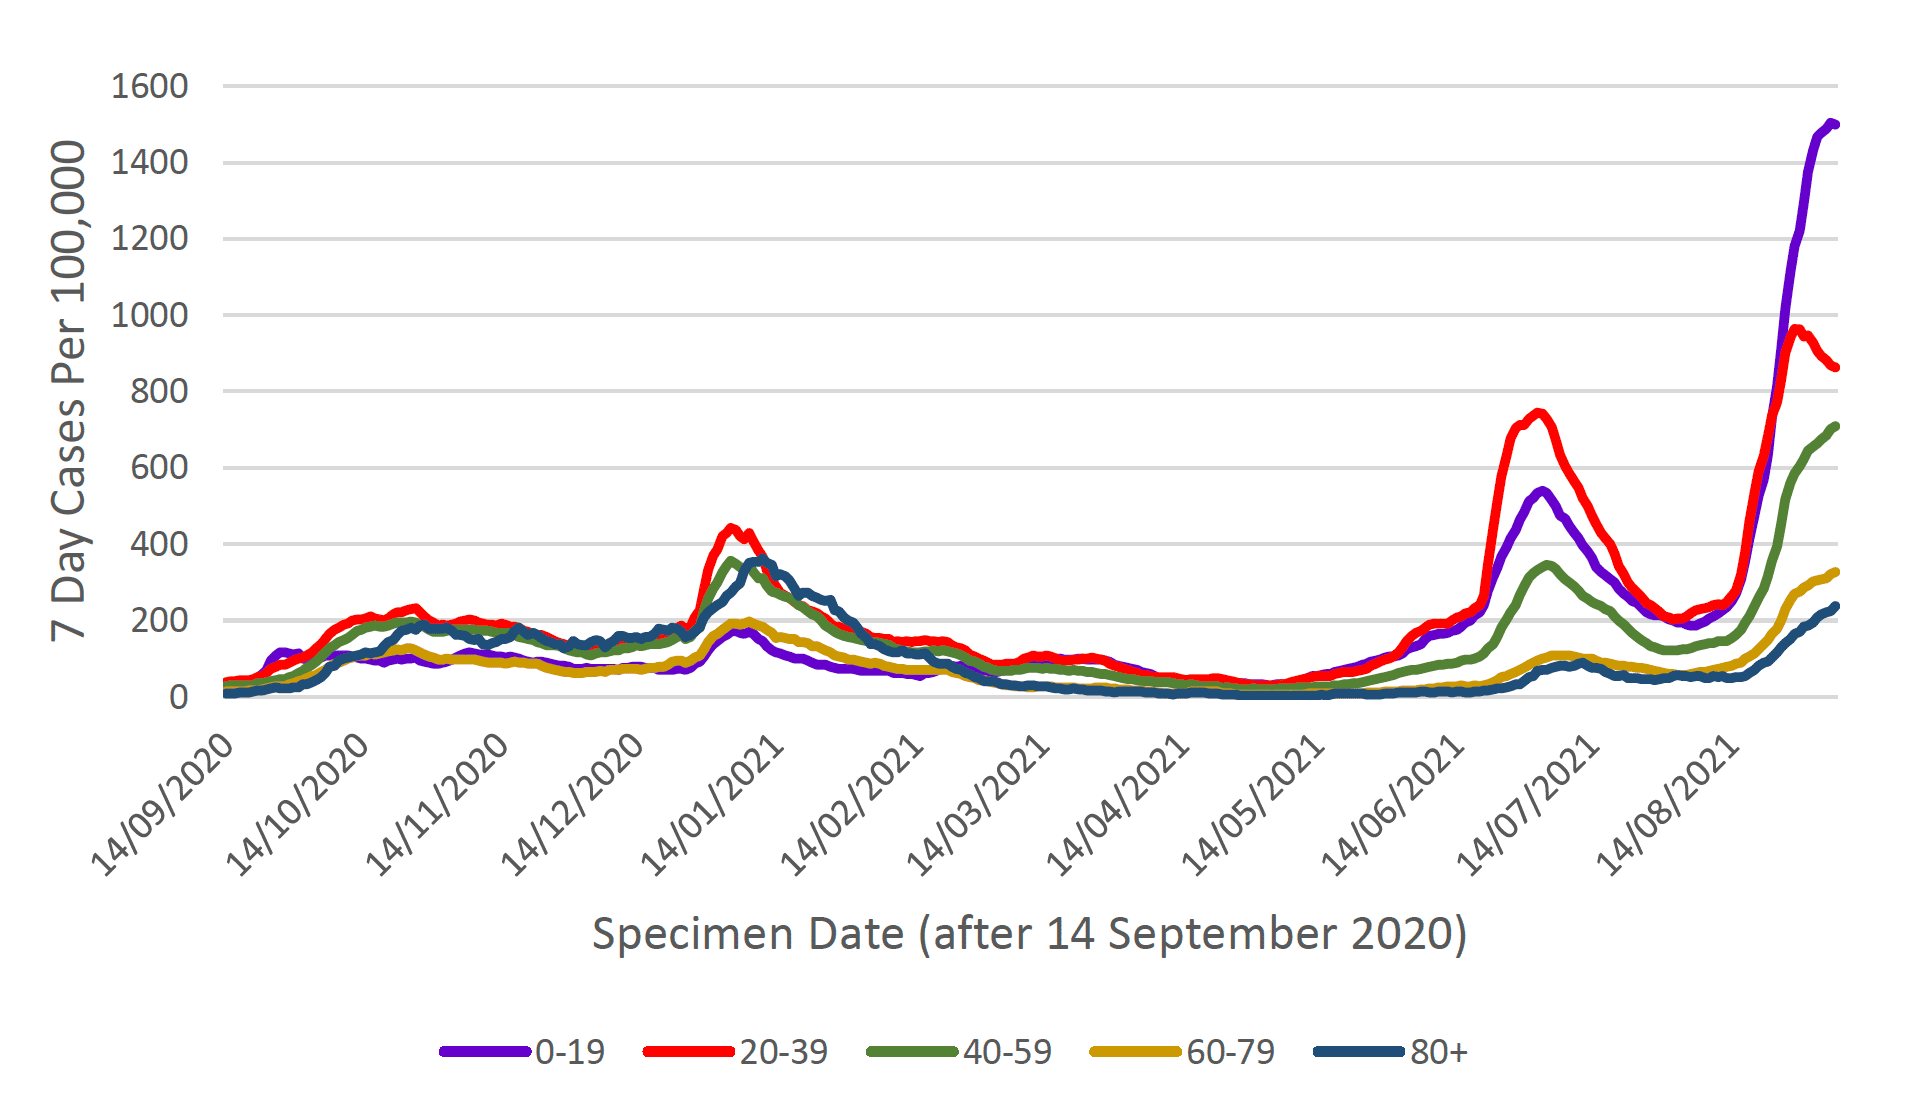
- Case rates have gone up across all age bands over the last week, except for the 20-39 year olds. The highest case rates were observed amongst under 20s, followed by 20-39, 40-59, 60-79 and 80+.
- As determined through the latest weekly ONS survey, the estimated proportion of people becoming infected with SARS-CoV-2 in the community in Scotland increased in the last week (week ending 3 September 2021).
- Latest modelled estimates suggest that as of 24 August there were between 118 and 214 new daily infections per 100,000 people in Scotland.
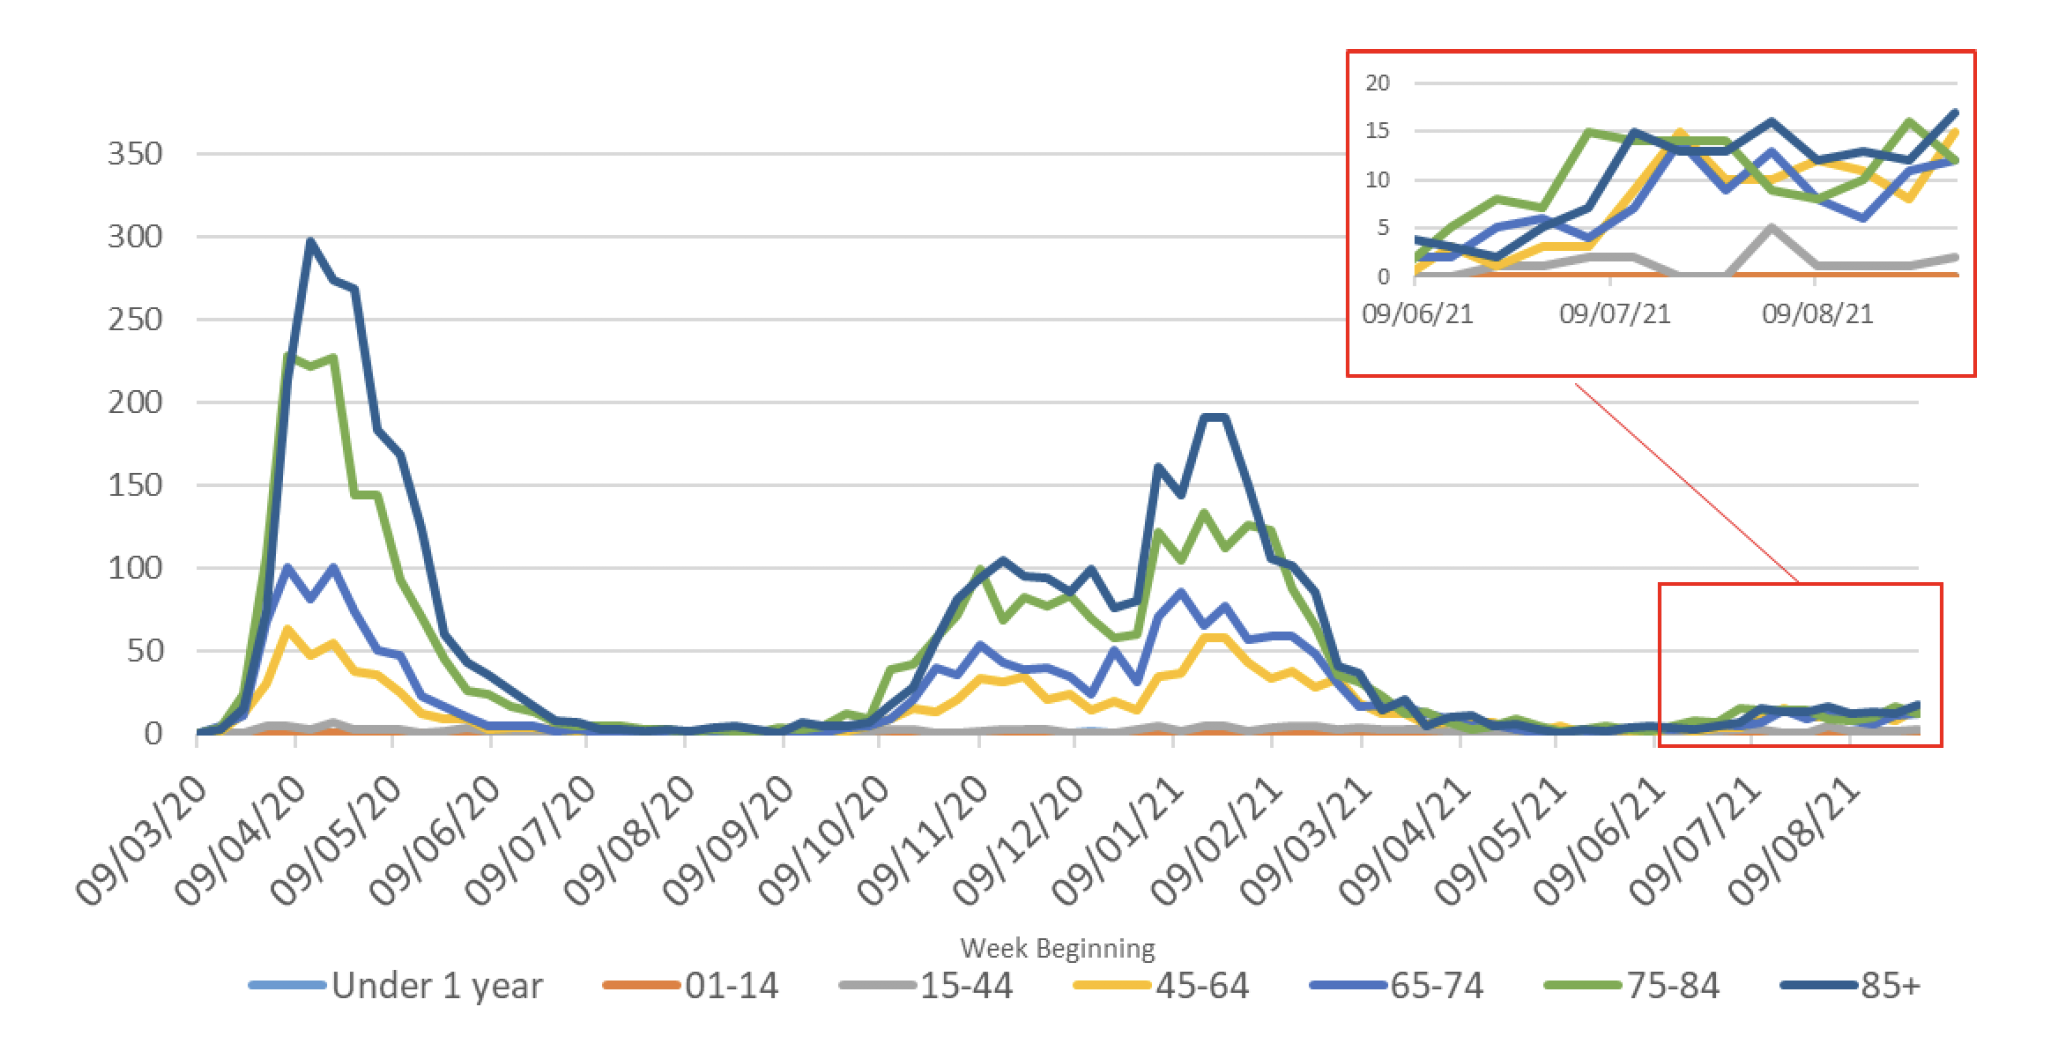
- There were 58 deaths registered in Scotland where coronavirus was mentioned on the death certificate in the week ending 5 September.
- Hospital admissions related to Covid-19 in children are now the highest since the start of the pandemic.
- West Dunbartonshire currently has the highest weekly case rate in Scotland reporting 1,259 cases per 100,000 in the week to 6 September, followed by North Lanarkshire with 1,228 weekly cases per 100,000, and Inverclyde with 1,177 weekly cases per 100,000. All local authorities reported over 100 weekly cases per 100,000 population in the last week. Orkney Islands reported the lowest case rate with 134 weekly cases per 100,000 in the same period.
- Nationwide, levels of Covid-19 in wastewater have risen by around 64% since the previous week. In the week prior, levels increased by 30%.
- As a result Covid-19 levels in wastewater this week are at the highest reported since the start of the pandemic.
- Hospitalisations are rising. Future hospital occupancy and intensive care use are likely to continue rising.
- Over 4.1 million people in Scotland have been given a first vaccine against SARS-CoV-2, and over 3.7 million have now received a second dose.
- The Delta variant of concern (VOC-21APR-02, first identified in India), remains the dominant strain in Scotland.
Method
This report brings together a wide range of publically available figures from a range of data sources. These include publications by Scottish Government, Public Heath Scotland, National Records of Scotland and Office for National Statistics along with scientific publications and SAGE summaries where appropriate to summarise the state of the epidemic in Scotland in a given week. We also provide information on public attitudes to the virus from weekly YouGov polling surveys.
The national picture
The latest R value for Scotland, as of 24 August (published on 9 September)[2], was between 1.2 and 1.5 (Figure 1), with a growth rate of between 3% and 7%. This is a decrease in the lower and upper limits from last week.
An average of 6,376 cases were reported per day in the 7 days to 9 September. This is a 6% increase from the daily average cases recorded a week earlier to 2 September[3]. In the week from 28 August to 3 September 2021, there were 2,063 cases (PCR testing only) per 100,000 amongst the unvaccinated individuals, compared to 476 cases per 100,000 for those that had been vaccinated with two doses[4]. Our current position is 811 weekly cases per 100,000 in the week to 6 September[5] (by specimen date). This compares to the previous peak of 425 weekly cases per 100,000 on 3 July and is the highest since the epidemic began (see Figure 2).
The number of locations where the levels of SARS-CoV-2 in wastewater are monitored has increased to 110 sites around Scotland. In contrast to Covid-19 case records, virus shedding into wastewater is a biological process. This means that wastewater data is unaffected by factors that impact whether testing is done. Nationwide, levels of Covid-19 in wastewater have risen by around 64% since the previous week. In the week prior, levels increased by 30%.
As a result Covid-19 levels in wastewater this week are at the highest reported since the start of the pandemic.
Case rates have gone up across all age bands this week, except for 20-39 year olds. The highest case rates are currently being reported in those aged under 20 followed by 20-39, 40-59, 60-79 and 80+ (Figure 3).
Not everyone who has the virus will be tested, as many people do not realise they have Covid-19, or they have mild symptoms and do not come forward. Latest modelled estimates suggest that, as at 24 August, the incidence of new daily infections in Scotland was between 118 and 214 new infections per 100,000[7]. This equates to between 6,400 and 11,700 people becoming infected each day in Scotland.
The number of people in hospital with confirmed Covid-19 for less than 28 days peaked at 2,053 on 22 January and decreased to a low of 58 on 6 May[8]. This has since increased and as of 9 September there were 928 patients in hospital with Covid-19. This compares to 624 people in hospital on 2 September. Daily hospital admissions for people with Covid-19 have increased from a low of 6 on 5 May and are now at 102 on 5 September[9]. In the 4 weeks to 3 September 37.6% of acute Covid-19 hospital admissions were in unvaccinated individuals[10].
There were 58 deaths registered where Covid-19 was mentioned on the death certificate in the week to 5 September. This is an increase of 10 in the number of deaths from the previous week, and 91% lower than the peak in April 2020 (663 deaths). The proportion of deaths in care homes decreased from 60% in April 2020 to 14% in the week to 5 September, with 8 deaths occurring in care homes[11]. In the week ending 5 September, deaths involving coronavirus have increased in those aged 15-44 (from 1 to 2 deaths), 45-64 (from 12 to 15 deaths), 65-74 (from 8 to 12 deaths), 75-84 (from 8 to 12 deaths) and among those aged 85+ (from 12 to 17) compared to week ending 15 August. Deaths remained at 0 in those aged under 15 in the same period11(Figure 4). From 29 December 2020 to 26 August 2021, 84.3% of Covid-19 deaths were in unvaccinated individuals[12].
How Scotland compares with the rest of the UK
The ONS COVID-19 Infection Survey estimates that the percentage of the community population testing positive for COVID-19 in Scotland increased in the week 28 August to 3 September to 2.23% (95% CI: 1.87% to 2.61%). Estimates for the same week in the other UK nations are as follows: 1.38% for England (95% CI: 1.29% to 1.48%), 1.74% for Northern Ireland (95% CI: 1.26% to 2.28%) and 1.54% for Wales (95% CI: 1.17% to 1.96%). This equates to around 1 in 45 people in Scotland, 1 in 70 in England, 1 in 60 in Northern Ireland and 1 in 65 in Wales.[13]
The ONS COVID-19 Infection Survey estimated that in the week beginning 9 August 2021, 93.6% (95% CI: 92.3% to 94.7%) of the adult community population in Scotland would have tested positive for antibodies against SARS-CoV-2, as a result of having the infection in the past or being vaccinated. This compares to 94.1% in England (95% CI: 93.1% to 95.0%), 92.0% in Wales (95% CI: 90.3% to 93.4%) and 90.4% in Northern Ireland (95% CI: 86.7% to 92.9%)[14].
An estimated 1.5% of the community population in the UK were experiencing self-reported long Covid symptoms (symptoms persisting for more than four weeks after the first suspected coronavirus (Covid-19) infection that were not explained by something else) in the 4 weeks ending 1 August 2021. In Scotland, 74,000 people (1.41% of the respective population) living in private households self-reported long Covid symptoms for this period. This compares to 1.43% in Wales, 1.53% in England and 1.03% in Northern Ireland.[15]
Average daily deaths in Scotland (2 per 1,000,000 population) in the week to 9 September are in line with England and Wales (2 per 1,000,000 each), but below Northern Ireland (4 per 1,000,000). Average daily cases in Scotland (1,167 per 1,000,000) in the week to 9 September are above Northern Ireland (817 per 1,000,000), Wales (785 per 1,000,000) and England(504 per 1,000,000)[16].
Situation by local authority within Scotland
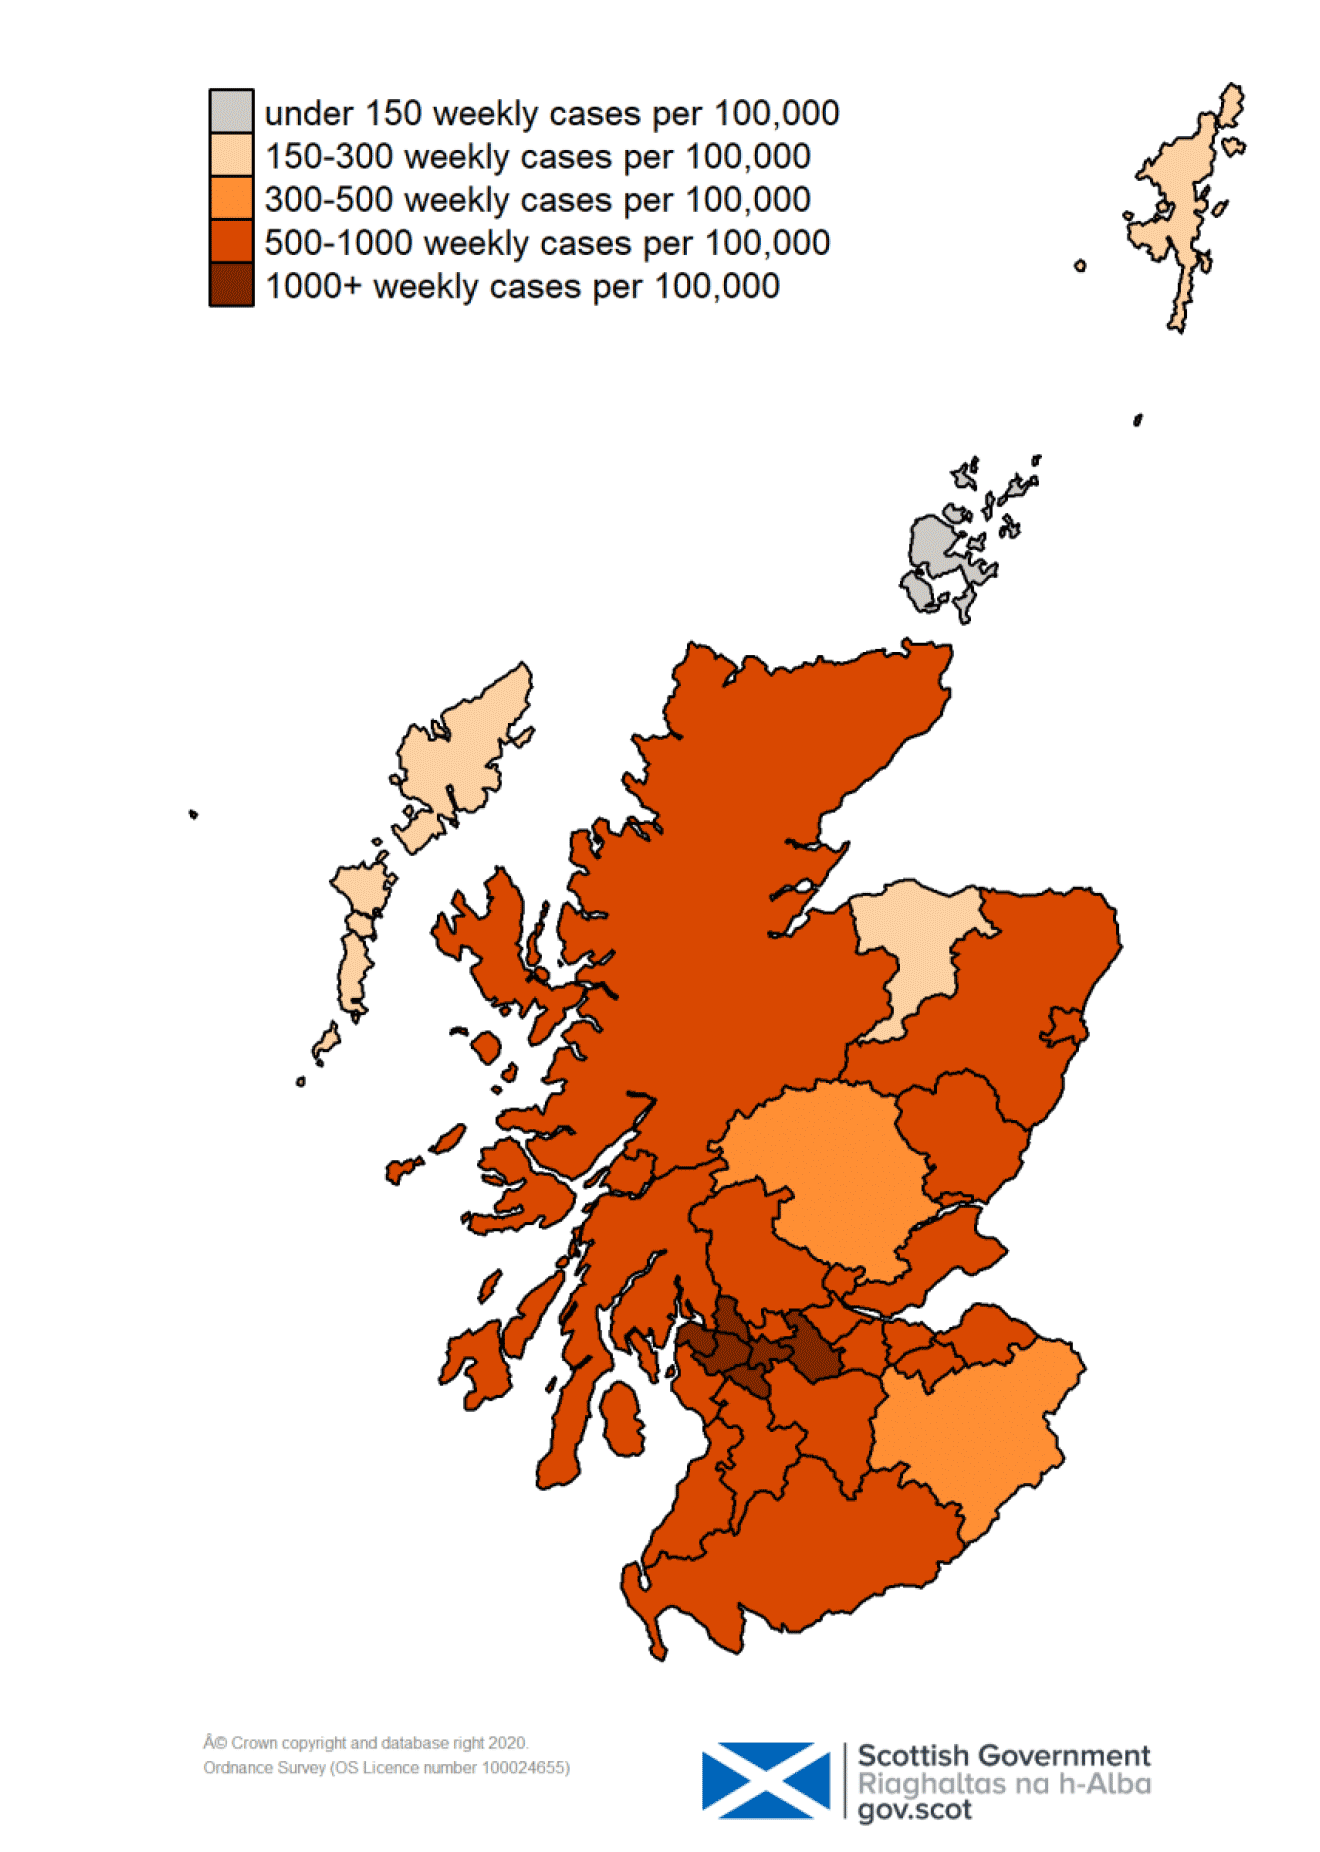
West Dunbartonshire currently has the highest weekly case rate in Scotland reporting 1,259 cases per 100,000 in the week to 6 September, followed by North Lanarkshire with 1,228 weekly cases per 100,000, Inverclyde with 1,177 weekly cases per 100,000, Renfrewshire with 1,129 weekly cases per 100,000, East Renfrewshire with 1,085 weekly cases per 100,000, and Glasgow with 1,027 weekly cases per 100,000 population. All local authorities reported over 100 weekly cases per 100,000 population in the last week (Table 1). Case rates have increased across most local authorities over the last week and there are very high levels of case rates across Scotland (Figure 5). The Orkney Islands have the lowest case rate in Scotland, reporting 134 weekly cases per 100,000 in the week to 6 September.[17]
| Local authority | Total new cases in the week, per 100,000 population | Change since previous week |
|---|---|---|
| West Dunbartonshire | 1,259 | +154 |
| North Lanarkshire | 1,228 | -38 |
| Inverclyde | 1,177 | -70 |
| Renfrewshire | 1,129 | +70 |
| East Renfrewshire | 1,085 | -2 |
| Glasgow City | 1,027 | +22 |
| Clackmannanshire | 998 | +283 |
| East Dunbartonshire | 993 | -169 |
| South Lanarkshire | 992 | -22 |
| Midlothian | 895 | +131 |
| North Ayrshire | 843 | +54 |
| Dundee City | 838 | +134 |
| Falkirk | 835 | +135 |
| Fife | 807 | +199 |
| Argyll and Bute | 797 | +68 |
| West Lothian | 779 | +79 |
| East Ayrshire | 738 | +100 |
| City of Edinburgh | 727 | -6 |
| South Ayrshire | 697 | +11 |
| Stirling | 670 | +40 |
| East Lothian | 619 | -12 |
| Highland | 610 | +86 |
| Aberdeenshire | 579 | +153 |
| Angus | 561 | +123 |
| Dumfries and Galloway | 561 | -59 |
| Aberdeen City | 543 | +125 |
| Scottish Borders | 485 | +48 |
| Perth and Kinross | 371 | +70 |
| Shetland Islands | 289 | +57 |
| Moray | 261 | +84 |
| Na h-Eileanan Siar | 208 | +26 |
| Orkney Islands | 134 | +80 |
| Scotland | 811 | +55 |
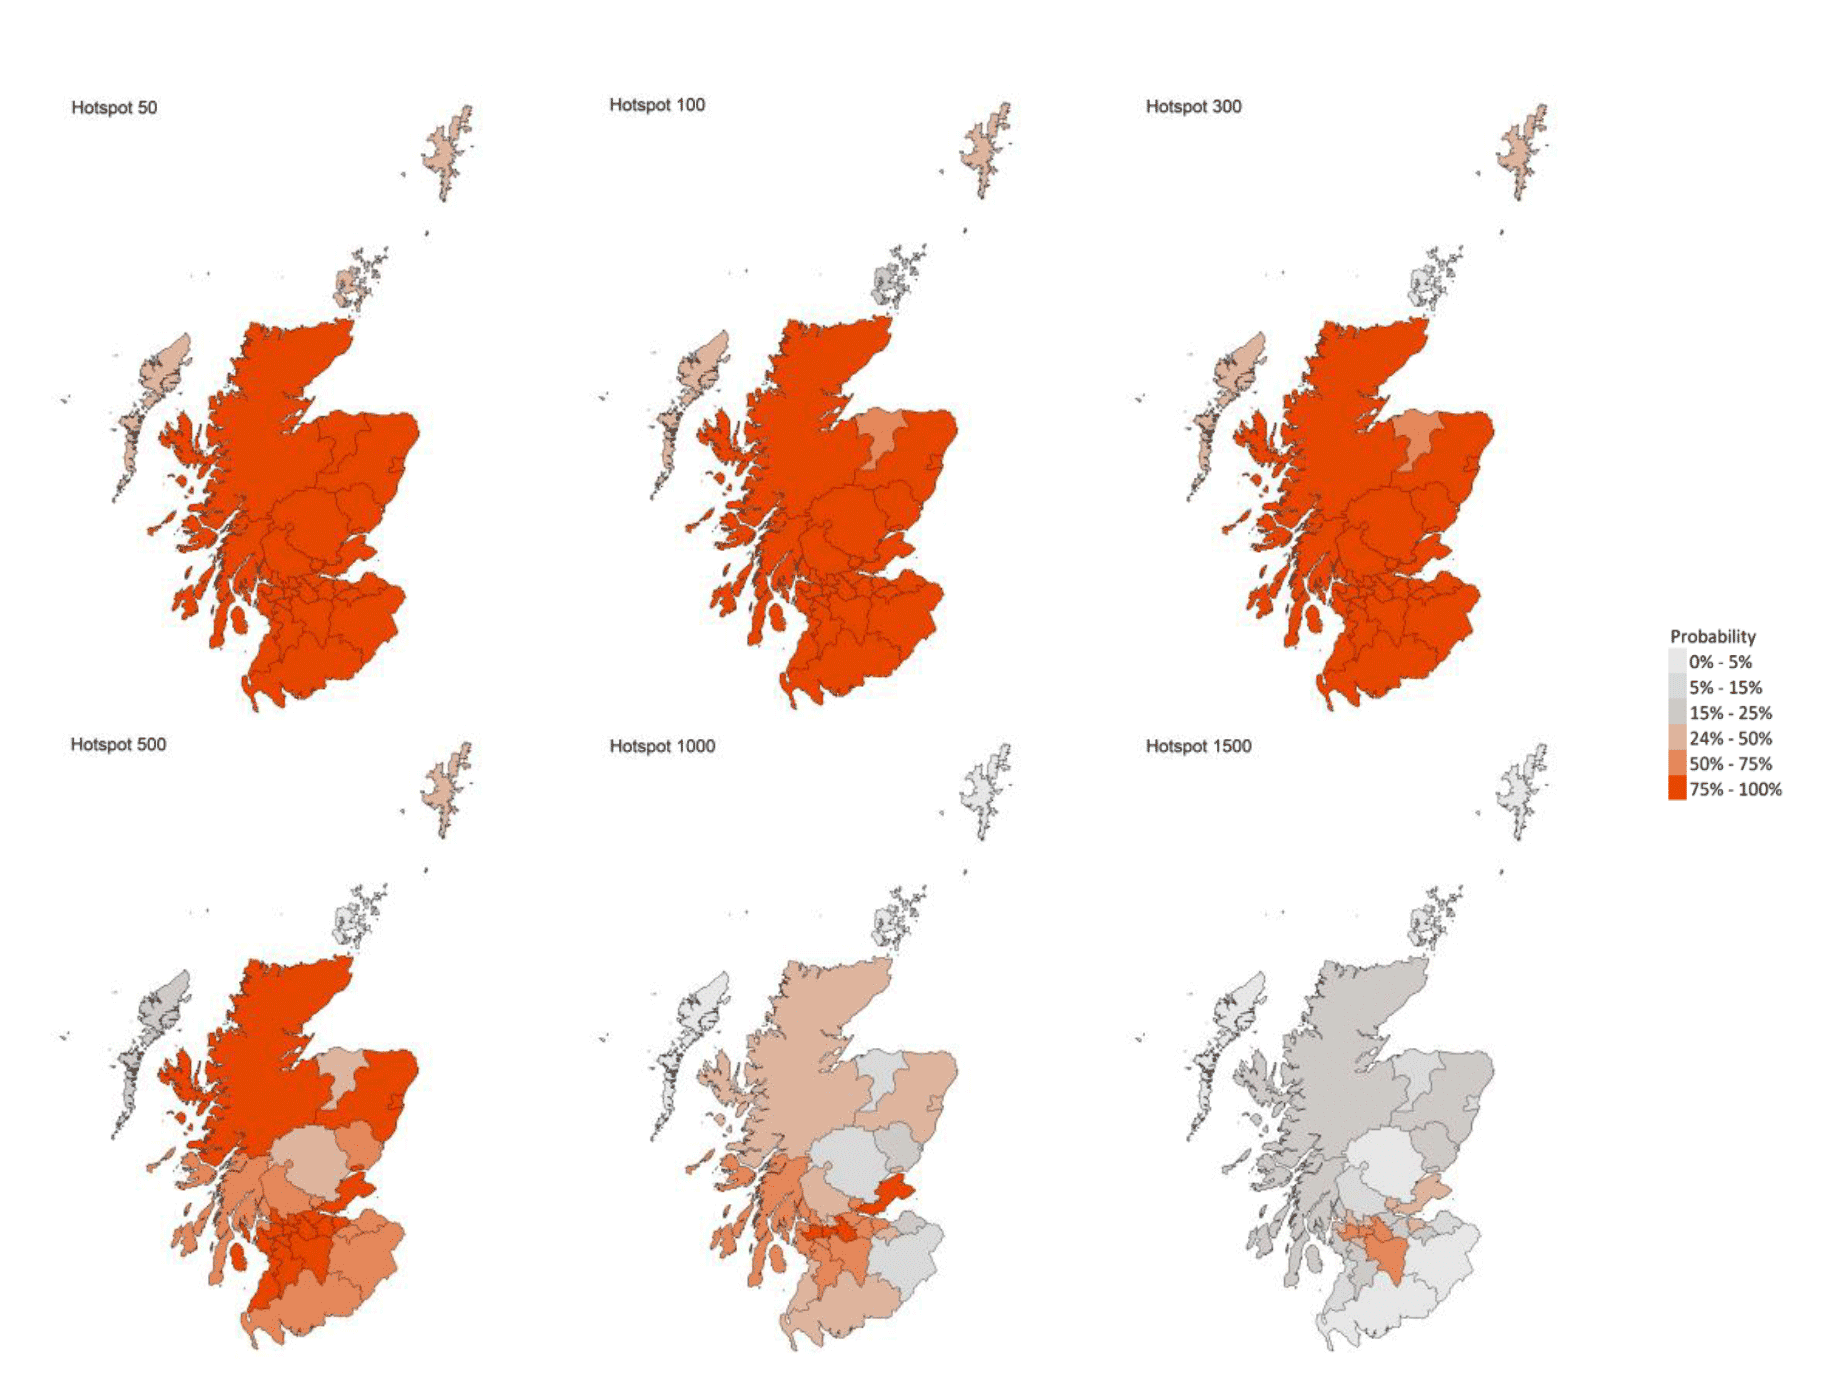
The most recent modelling predicts, based on data up to 3 September, that for the week commencing 19 September 2021, there are 29 local authorities which are expected to exceed 50 cases per 100,000 population with at least 75% probability. Of these, 18 local authorities are expected to exceed 500 cases per 100,000 with at least 75% probability. These are Aberdeen City, Aberdeenshire, City of Edinburgh, Dundee City, East Ayrshire, East Dunbartonshire, East Renfrewshire, Falkirk, Fife, Glasgow City, Highland, North Ayrshire, North Lanarkshire, Renfrewshire, South Ayrshire, South Lanarkshire, West Dunbartonshire and West Lothian. Fife, Glasgow, North Lanarkshire and Renfrewshire are expected to exceed 1,000 cases per 100,000 population with at least 75% probability (Figure 6).[18]
Children and Education
Schools have resumed in Scotland and the majority of children and young people had returned to full time education by the week ending 20th August.
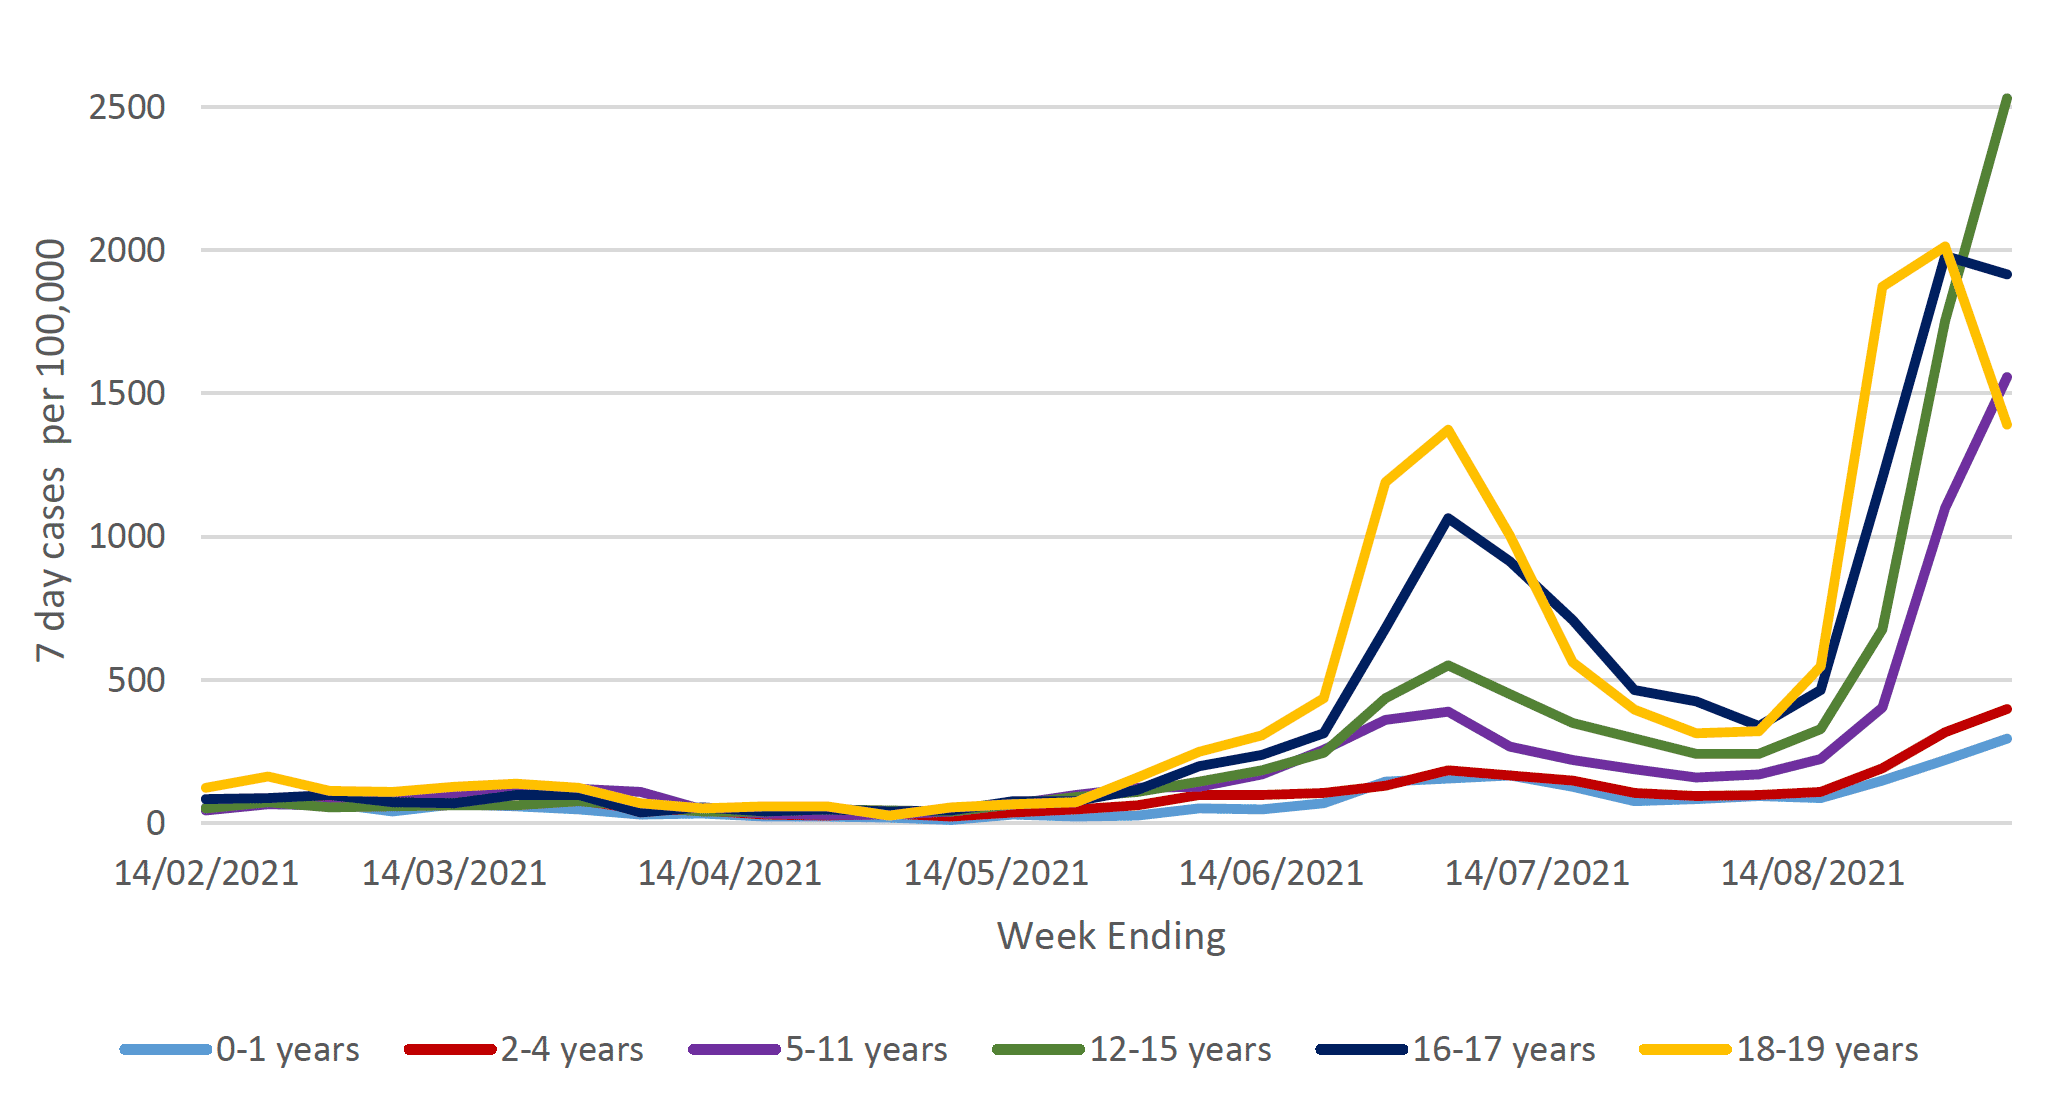
Over the last week there was a further increase in the total number of Covid-19 cases in young people aged under 20, which has gone up from 13,941 cases in the week to 29 August to 17,091 cases in the week ending 5 September. 7 day cases per 100,000 have also increased in all age groups in the week ending 5 September, except for the 16-17 and 18-19 year olds (Figure 7). The percentage of cases made up of children under 12 was just over 43% (7,462 cases) compared to just over 38% (5,344 cases) in the previous week[19].
The rate of testing increased amongst all age groups in the week ending 5 September. Test positivity rates have decreased in all age groups except for 0-1 and 12-15 year olds. The proportion of positive cases who report having been in an education setting in the 7 day period prior to the onset of symptoms has decreased to 16.2% in week ending 5 September, from 16.6% of positive cases in the previous week. Hospital admissions in children increased across all age groups in the period 12 August to 1 September compared to the previous three-week period (5 – 25 August). Hospital admissions related to Covid-19 in children are now the highest since the start of the pandemic.
Looking ahead
Changes in patterns of mixing and adherence to restrictions will impact on future case numbers. The Scottish Contact Survey measures times and settings that people mix where they could potentially spread Covid-19. Average contacts have increased by approximately 14% in the last two weeks (comparing surveys pertaining to 19th August - 25th August and 2nd September - 8th September) with a current level of 5.3 daily contacts.
Contacts within the work setting have increased by 63% in the last two weeks whereas contacts within the home and other setting (contacts outside home, school and work) have remained at a similar level. Mean contacts have increased in the 18-29 and 30-39 age groups by approximately 29% and 20% respectively. Increases across the age groups are largely driven by a rise in contacts within the work setting.
The proportion of individuals using public transport has decreased from approximately 25% to 21% with individuals visiting a pub or restaurant also decreasing, from 49% to 46%, in the last two weeks.
Self-reported compliance with the current regulations and guidance has decreased since January but remains at a high level. On 7-8 September, 65% of people reported 'complete' or 'almost complete' compliance.[20]
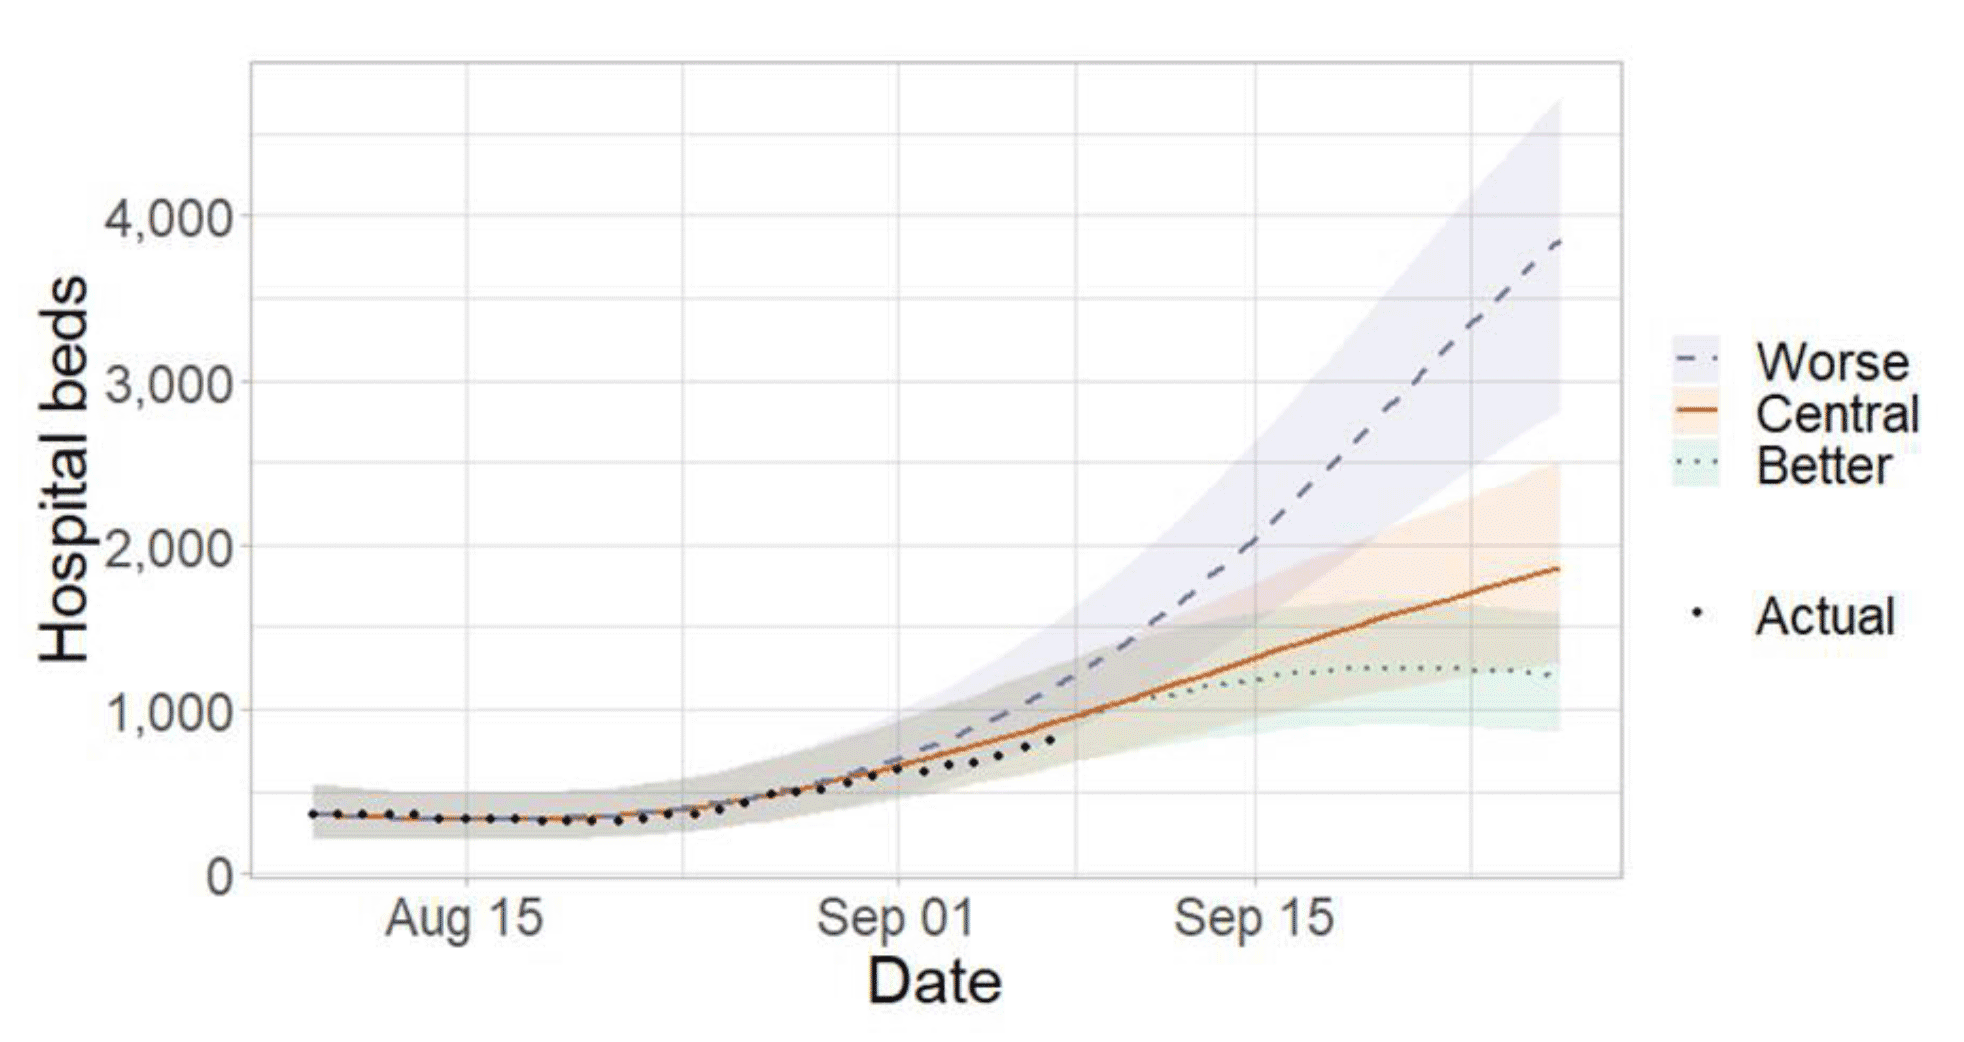
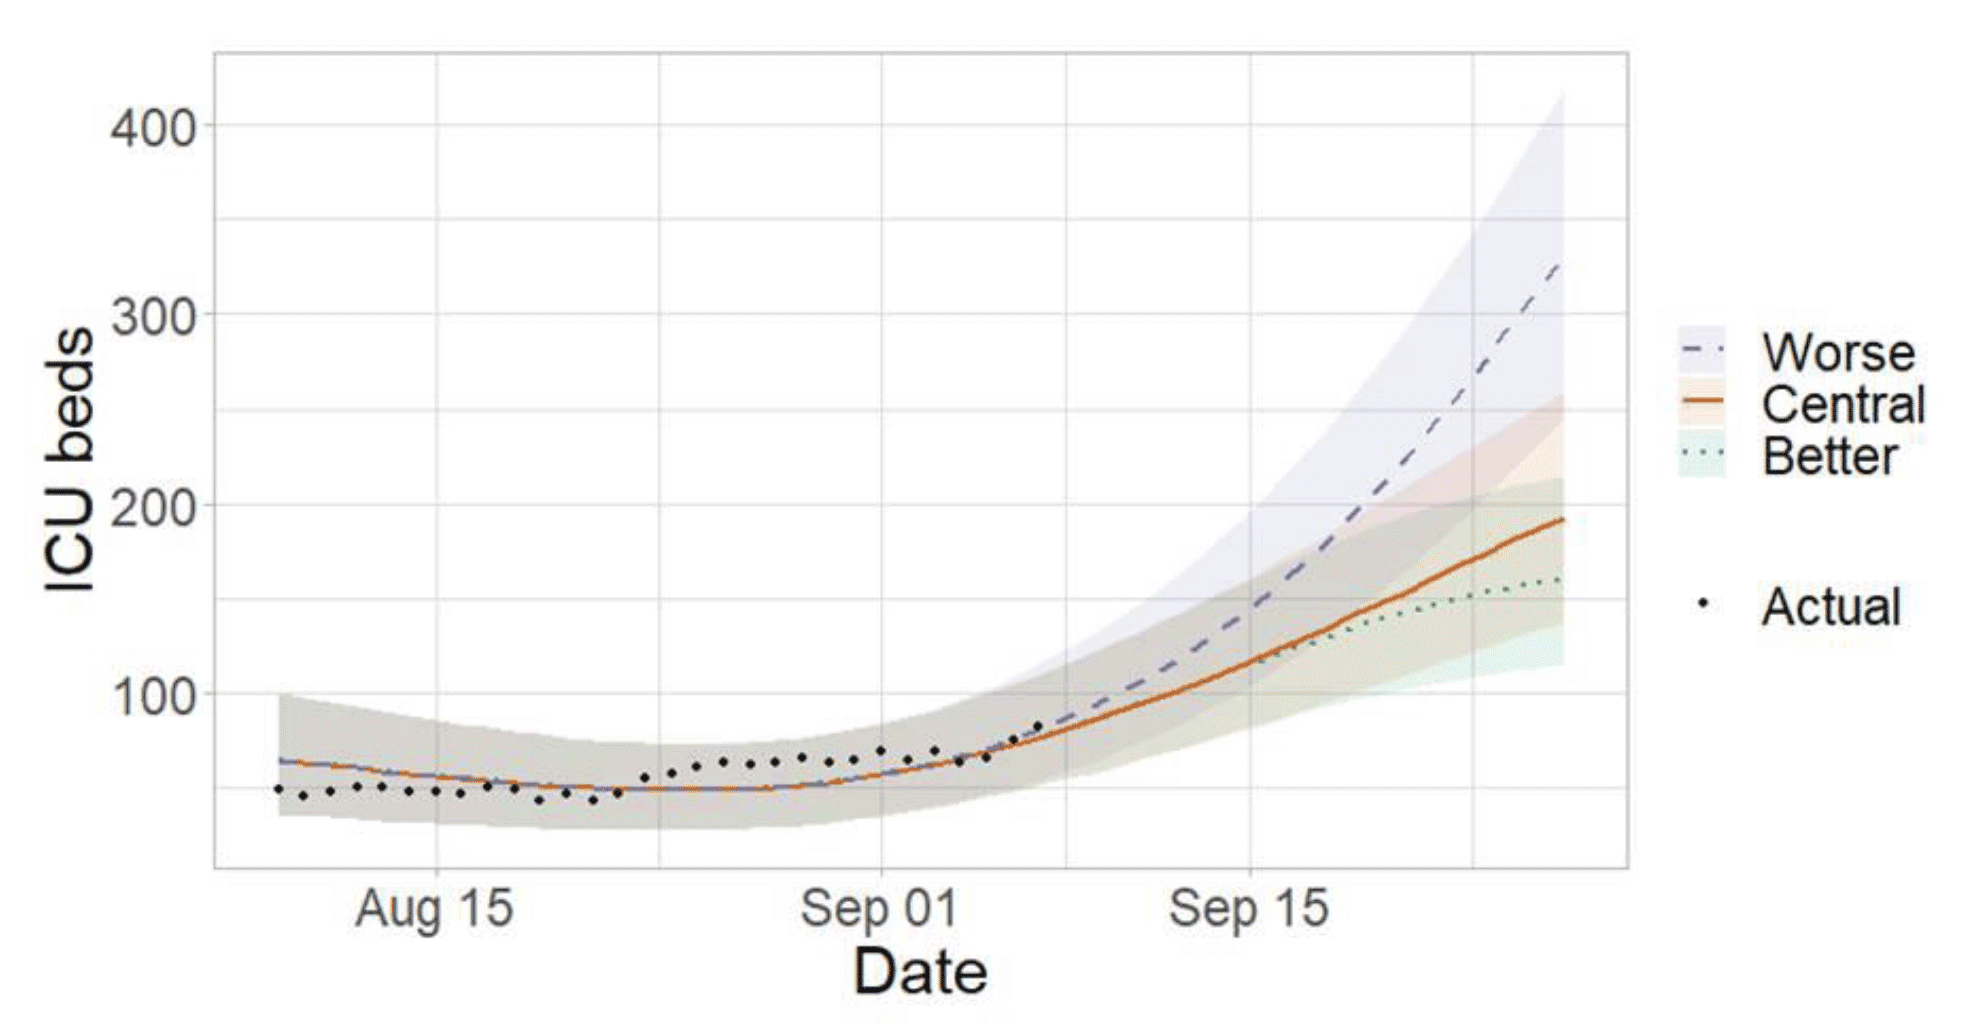
Hospitalisations are rising. Future hospital occupancy and intensive care use are likely to continue rising. The scale of any future increase in hospital occupancy and intensive care use is highly uncertain, and depends on the number of infections (Figures 8 and 9).[21]
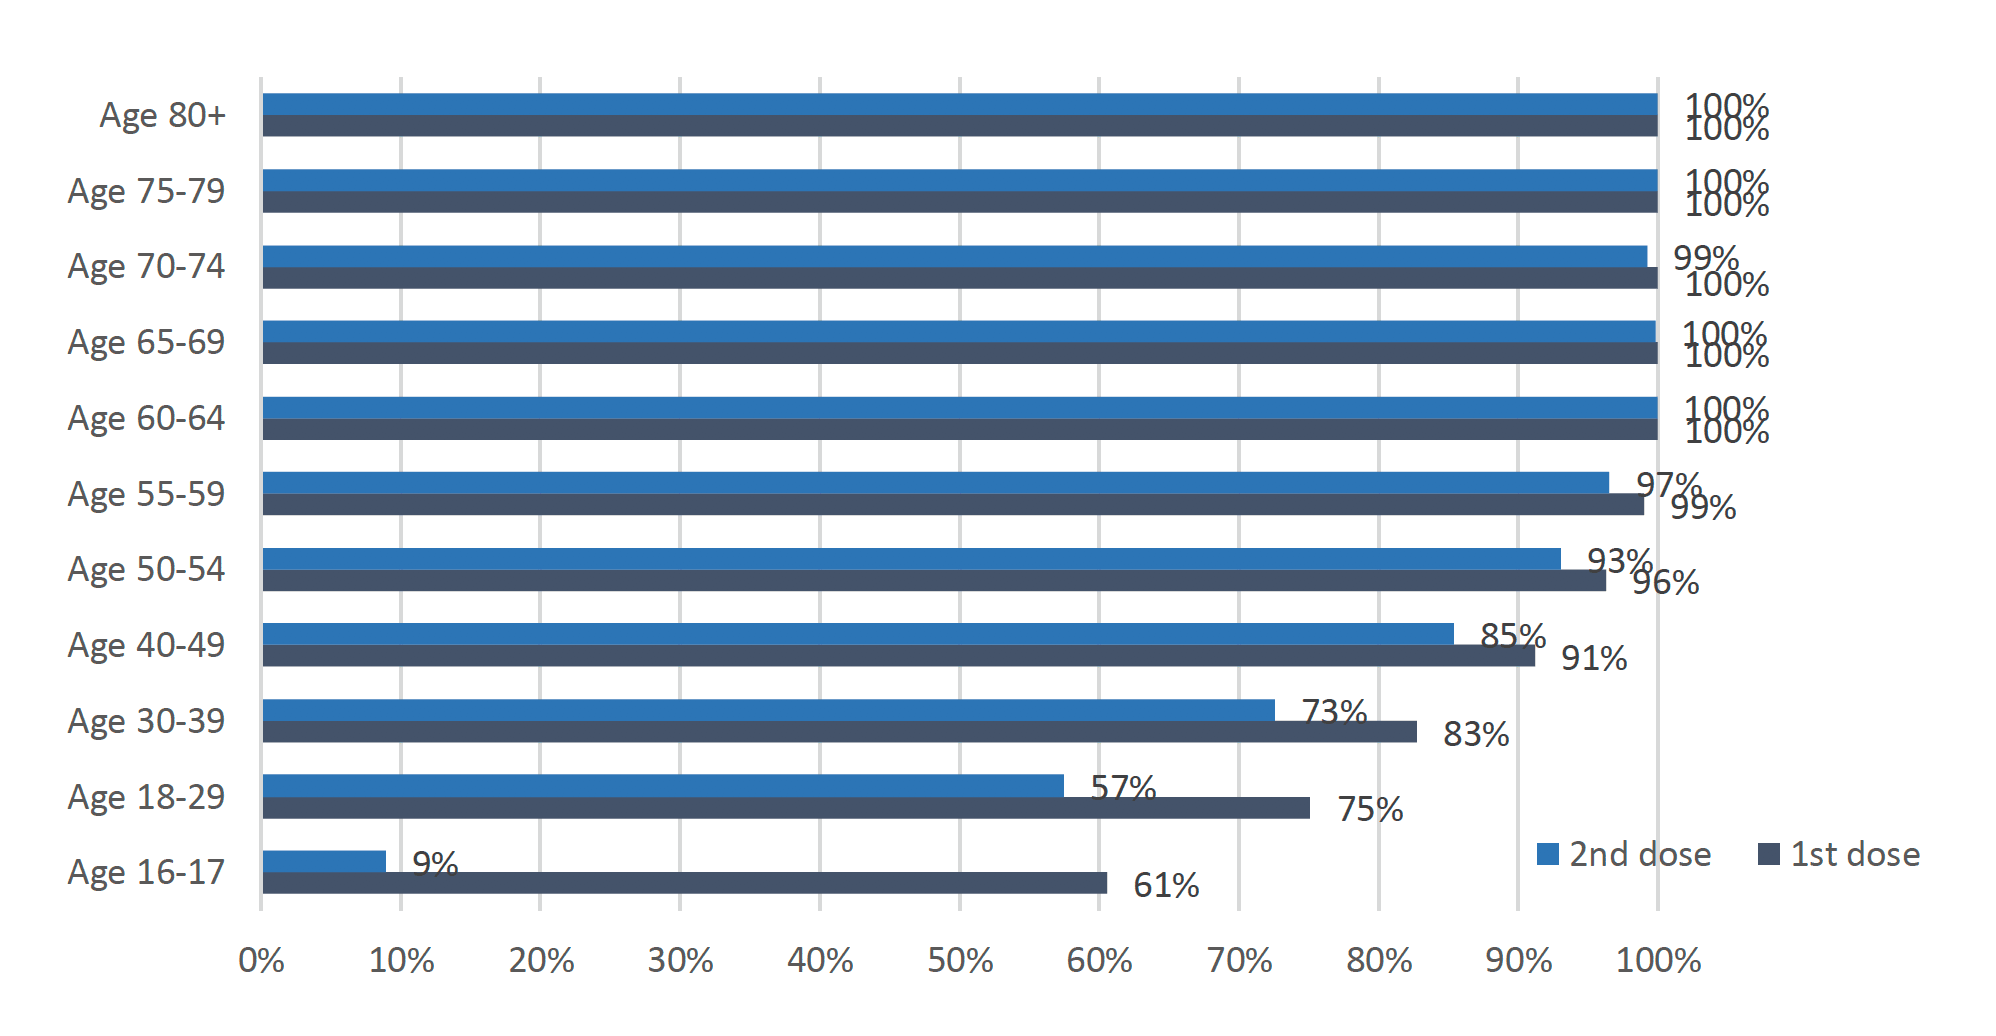
Vaccinations are continuing across the priority groups and 91.4% of the 18+ population in Scotland has now been vaccinated with the first dose[23]. The first vaccines were administered on Tuesday 8 December and 4,133,606 people had received their first dose by 9 September 2021[24]. By age group, almost 100% of individuals aged 55+, 96% of those aged 50-54, 91% of those aged 40-49, 83% of those aged 30-39, 75% of those aged 18-29 and 61% of those aged 16-17 have received their first vaccination (Figure 10). Almost 100% of individuals aged 60+, 97% of those aged 55-59, 93% of those aged 50-54, 85% of those aged 40-49, 73% of those aged 30-39, 57% of those aged 18-29 and 9% of those aged 16-17 have received their second dose. Overall, 3,757,337 people (84.4% of those aged 18 and over) had received their second dose by 9 September[25]. There remains a low level of deaths among those groups vaccinated first (Figure 4).
The proportion of people surveyed who said they have been vaccinated for Covid-19 is high. 90% of all respondents have already received at least their first vaccine dose. Of those not vaccinated (and small base must be noted), 5% report they are likely to be vaccinated when a vaccine becomes available to them.
How the virus is changing
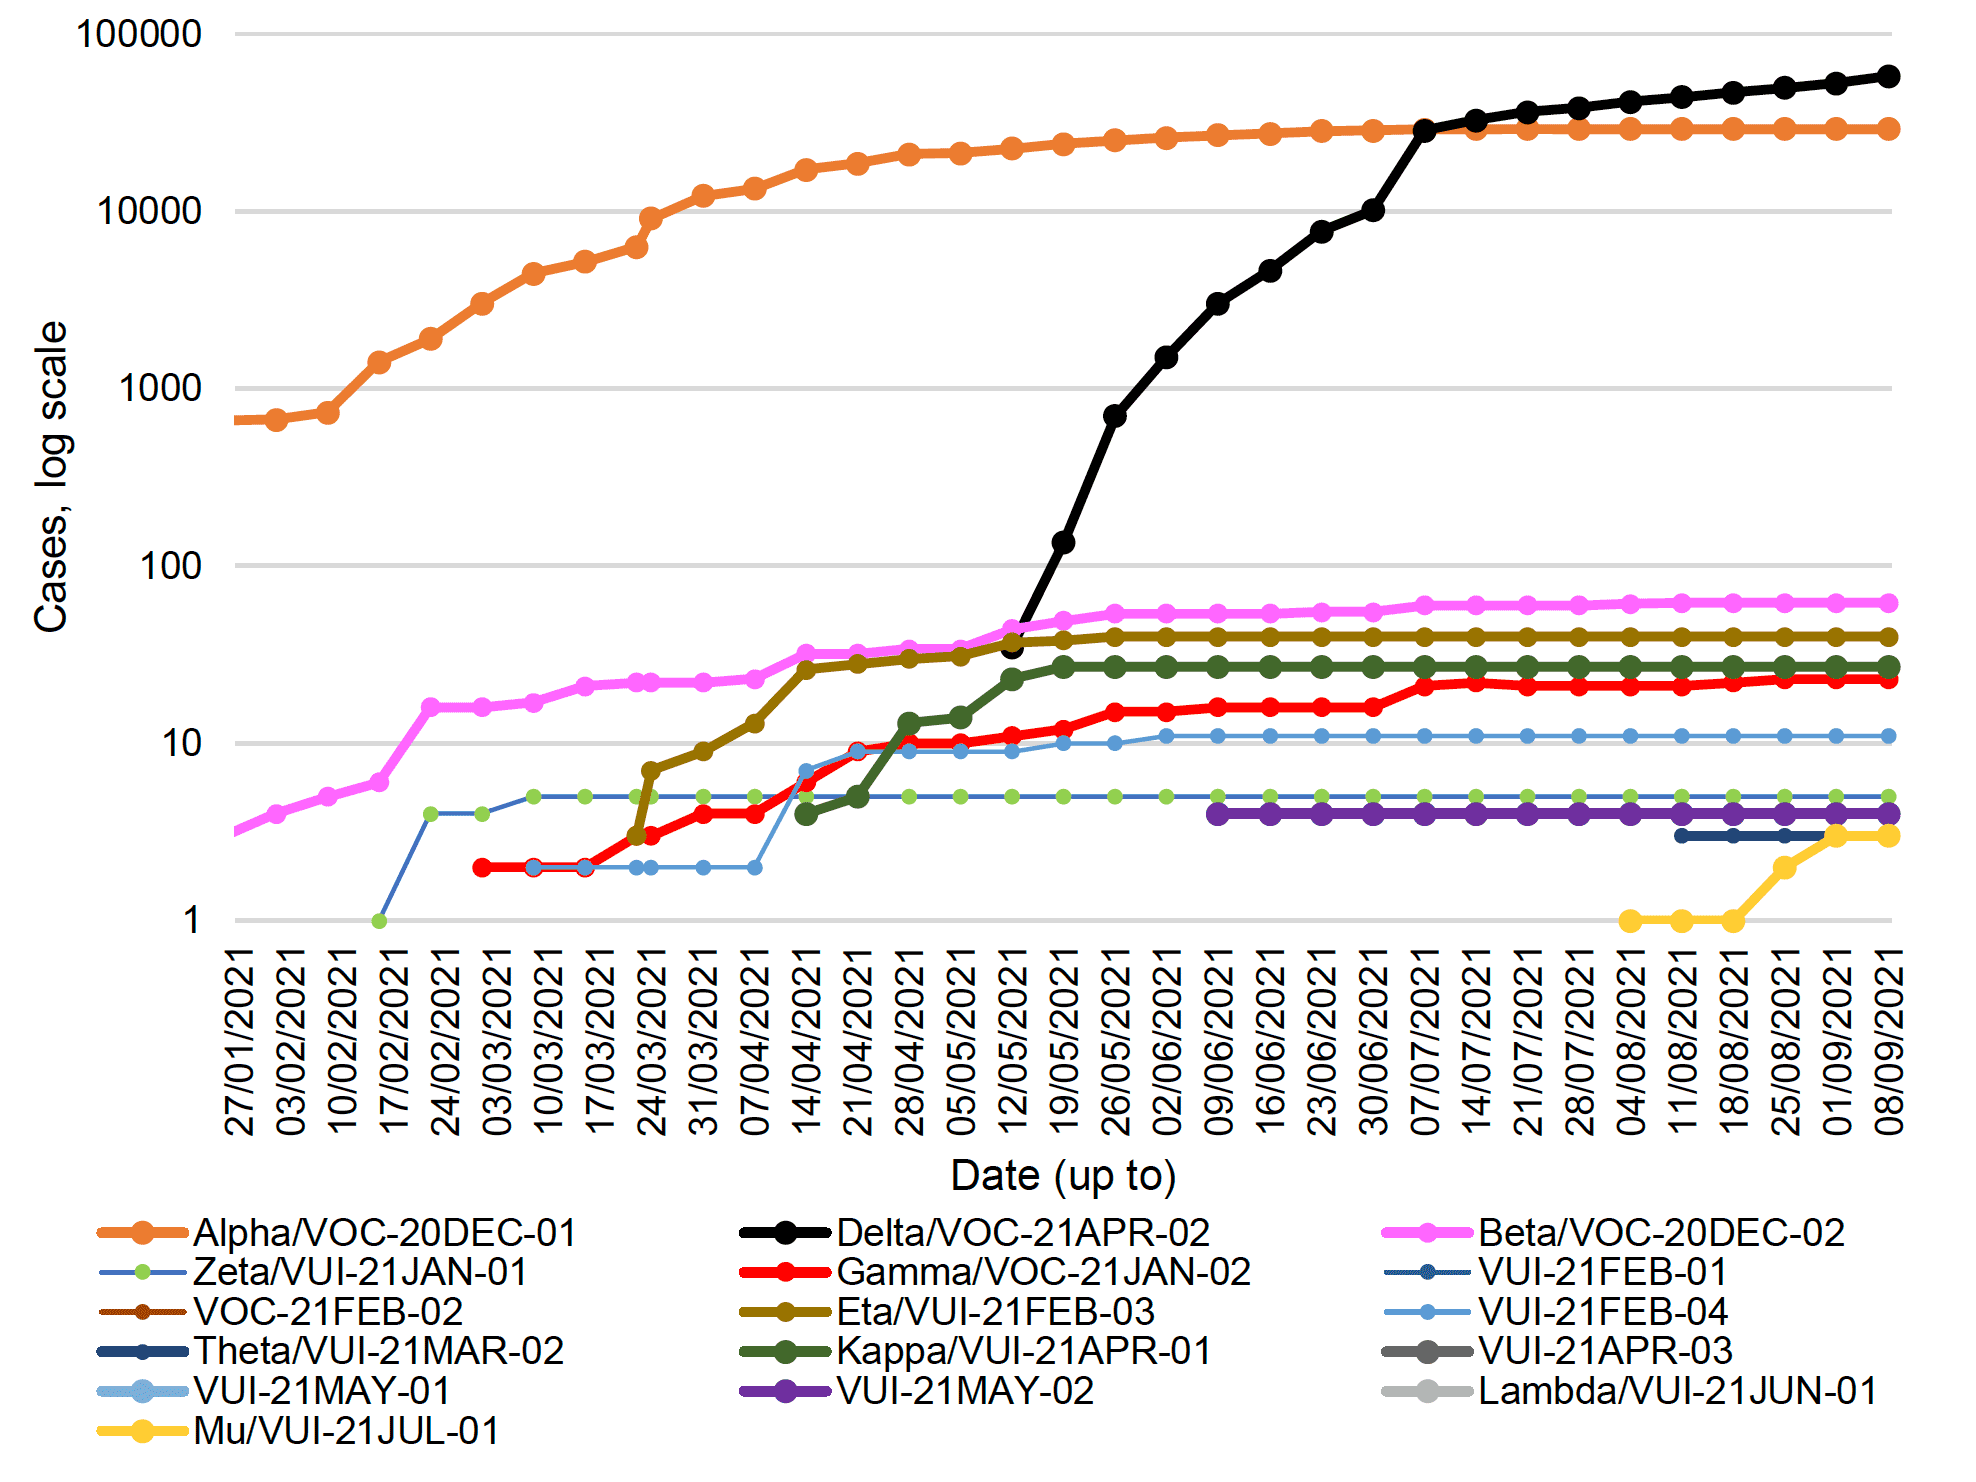
The variant of concern Delta, also referred to as VOC-21APR-02 (first identified in India) is more transmissible than Alpha variant[27,28,29]. It quickly replaced Alpha (VOC-20DEC-01), first identified in the UK, as the dominant strain in Scotland, and 58,022 cases have now been identified as Delta to 8 September 2021.
To date there are four 'variants of concern' (VOCs) and eight 'variants under investigation' (VUIs)[30]. There is a concern that some of these new variants may partially escape immunity, from both natural infection and from vaccines currently being deployed and we are monitoring the evidence on this[31,32,33]. Up to 8 September there have been 62 genomically confirmed cases of the variant Beta/VOC-20DEC-02 (first detected in South Africa), and 23 cases of Gamma in Scotland. Genomically confirmed cases of other VOCs and VUIs remain low, there have been no new cases of other VOCs or VUIs in the last week (Figure 11).
A large study from the University of Oxford and Office of National Statistics shows that with Delta, Pfizer-BioNTech and Oxford-AstraZeneca vaccines still offer good protection against new infections, but effectiveness is reduced compared with Alpha[35]. Public Health England analysis shows that vaccines are highly effective against hospitalisation from Delta variant with similar vaccine effectiveness against hospitalisation seen with the Alpha and Delta variants at 93% and 96% respectively after two doses of vaccine. There was a 14% absolute reduction in vaccine effectiveness against symptomatic disease after a single vaccine dose with Delta compared to Alpha, and a smaller 10% reduction in effectiveness after 2 doses. Vaccine effectiveness against symptomatic disease is high for both Alpha (89%) and Delta after two doses (79%)[36]. EAVE II data from Scotland also shows that both the Oxford–AstraZeneca and Pfizer–BioNTech Covid-19 vaccines are effective in reducing the risk of SARS-CoV-2 infection and Covid-19 hospitalisation in people with the Delta variant, but effectiveness against infection appeared to be diminished when compared to those with Alpha[37].
There remains uncertainty regarding the impact of the Delta variant on severity of illness, treatment or reinfections. As more data is analysed we shall become more certain of the impact of Delta on infections, hospitalisations and disease severity and long term vaccine protection effects.
Next steps
The Scottish Government continues to work closely with Public Health Scotland and modelling groups to monitor what happens following the high number of cases in Scotland this week and how this effects the course of the epidemic.
Each week this report will provide an overview of the current Covid-19 situation in Scotland. This will include real time data on case rates, hospitalisations and deaths and how Scotland's figures compare to those from the rest of the UK.
Modelling can tell us where the epidemic is likely to be heading. Local data and data by age group can highlight where problems arise, which can help in addressing some of these issues. In the coming weeks the roll out of the vaccine will continue to be monitored along with the impact of this on case rates and deaths among different age cohorts. Investigations are ongoing by NERVTAG, SPI-M, SAGE, Public Health England and Public Health Scotland regarding the impact of new variants and of vaccination; this will be reflected here as work is undertaken.