Coronavirus (COVID-19) state of the epidemic 10 December 2021
This report brings together the different sources of evidence and data about the Covid epidemic to summarise the current situation, why we are at that place, and what is likely to happen next.
State of the Epidemic in Scotland – 10 December 2021
Background
This report summarises the current situation on the Covid-19 epidemic in Scotland. It brings together the different sources of evidence and data about the epidemic in Scotland at this point in time, why we are at that place, and what is likely to happen next. This summarises the data up to and including 9 December 2021 on Covid-19 in Scotland. This updates the previous publication published on 3 December[1]. The information in this document helps the Scottish Government, the health service and the wider public sector respond to the epidemic and put in place what is needed to keep us safe and treat people who have the virus.
This edition of the State of the Epidemic summarises current data on Covid-19 at a national and local level, and how Scotland currently compares to the rest of the UK. It looks at the vaccination program in Scotland and its impact. Information is provided about variants of concern and what impact these may have. Bringing this information together in one place gives the opportunity to better understand the current state of the epidemic in Scotland.
Please note that recent processing issues at labs have impacted turnaround times resulting in delays between specimens being taken and results being received and reported. Moreover, due to an outage at Western Isles, there was no data received for them since 7 December. PHS continue to monitor the situation.
There was also a lower number of confirmed Omicron cases reported on 9 December due to a move from interim reports to routine reports via the Cloud Infrastructure for Microbial Bioinformatics (CLIMB) pipeline, which are lagged by approximately 2 days. This lag is due to additional quality control and processing.
Key Points
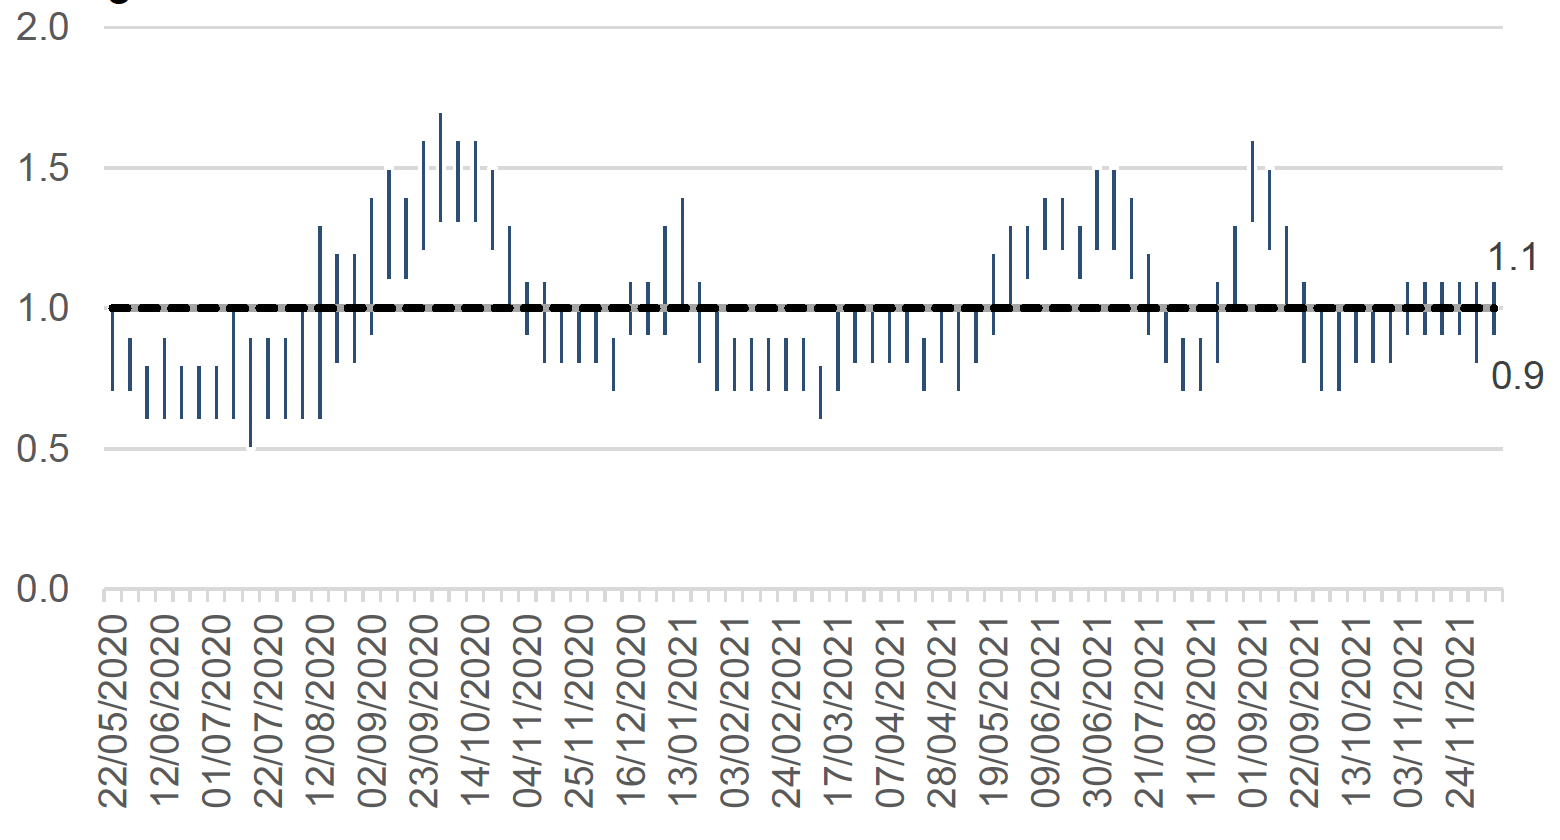
- The latest R value for Scotland, as of 23 November (using data to 6 December), was between 0.9 and 1.1, with a growth rate of between -3% and 0%. The lower limit of R value has increased, whereas the upper limit of growth rate has decreased since last week. This is based on Delta variant making up the majority of cases.
- Latest modelled estimates suggest that, as at 23 November, based on data to 6 December, the incidence of new daily infections in Scotland was between 104 and 142 new infections per 100,000. This is based on Delta variant making up the majority of cases.
- An average of 2,789 cases were reported per day in the 7 days to 9 December. This is a 9% increase from the daily average of 2,566 recorded on 2 December.
- In the last week, 7 day case rates have increased in Scotland. The wastewater trend still remains higher than cases for the same period.
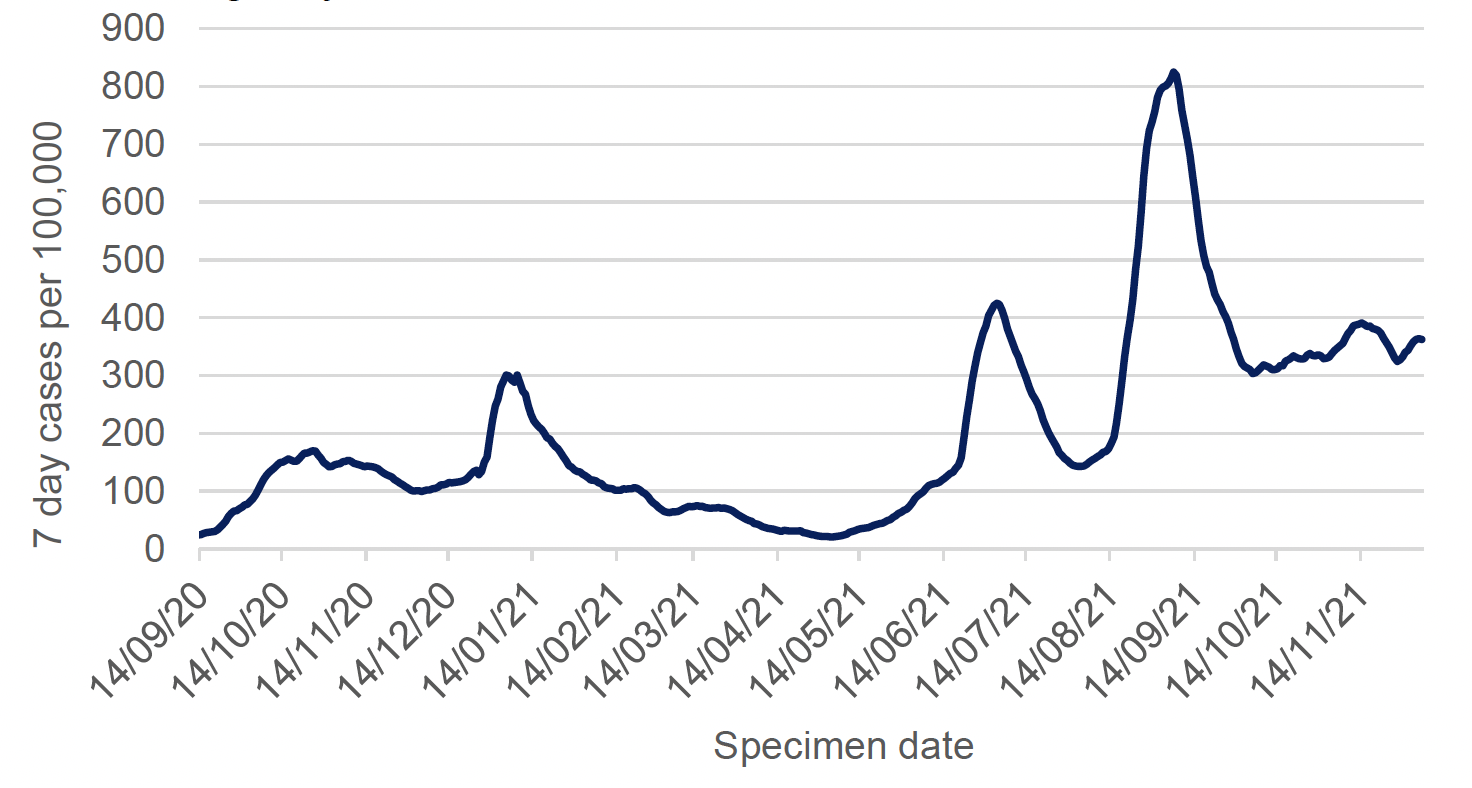
- There were 362 weekly cases per 100,000 population in the week to 6 December (by specimen date). This is a 9% increase from 332 weekly cases per 100,000 on 29 November. This is lower than the most recent peak (825 weekly cases per 100,000 on 6 September) and lower than the peak in July (425 weekly cases per 100,000 recorded on 3 July).
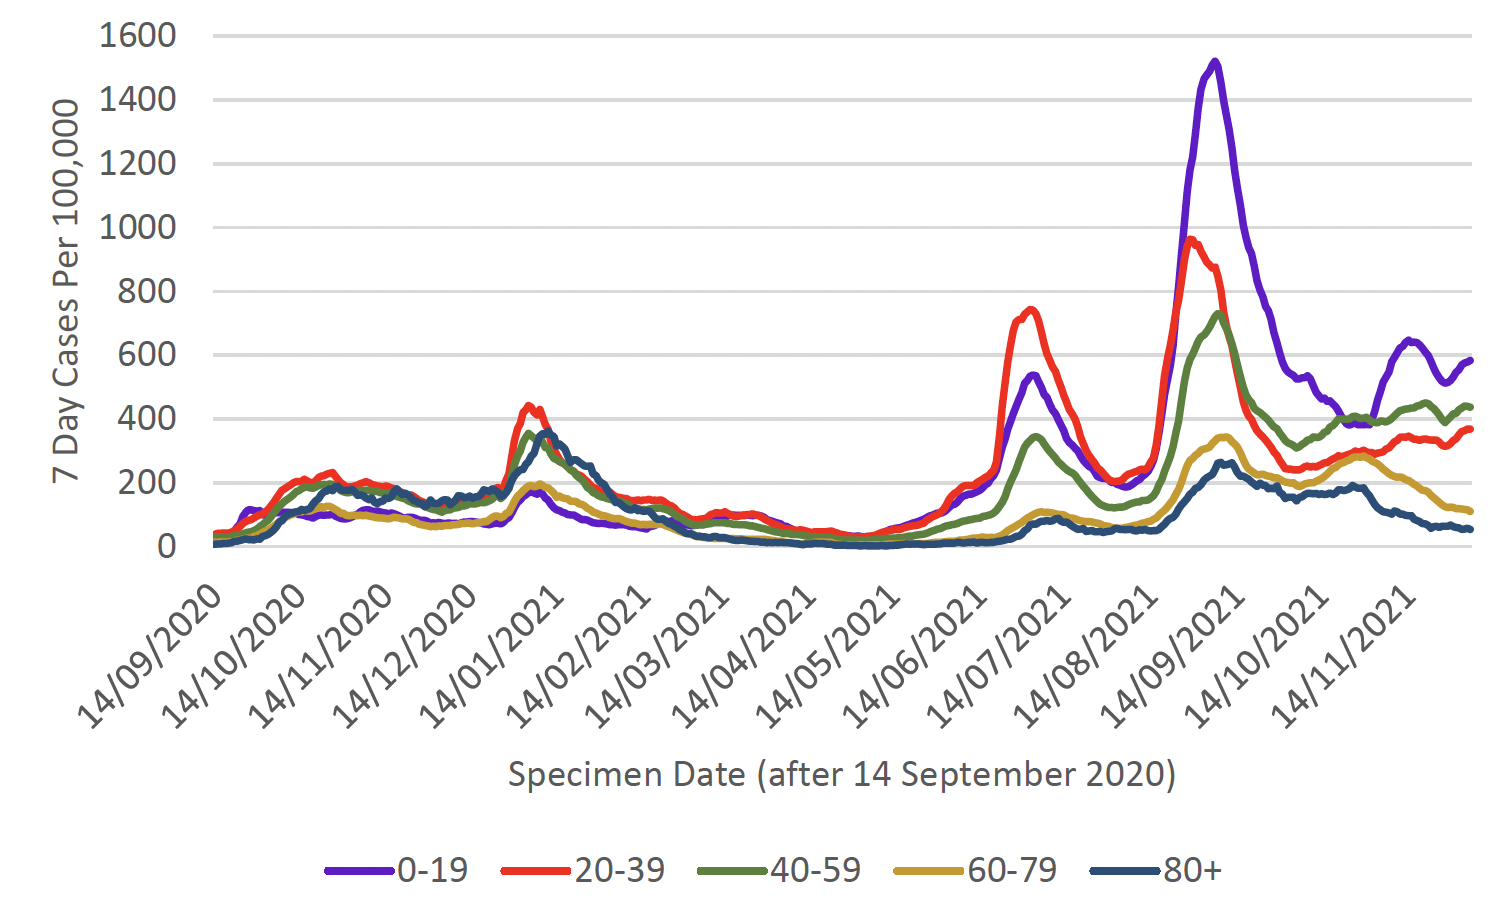
- As of 6 December, the highest case rates (by specimen date) were observed amongst those aged under 20, followed by 40-59, 20-39, 60-79 and 80+. In the week to 6 December, case rates have increased in those aged under 60, have decreased in those aged 60-79 and appear to have plateaued among those aged over 80.
- In the week to 9 December Covid-19 hospital occupancy and Covid-19 ICU occupancy (short and long stay) fluctuated but decreased by 15% and 13% overall from this time last week.
- Average hospital admissions (3-week rolling average) related to Covid-19 in children and young adults have remained similar to the week leading up to 1 December 2021 compared to the previous three-week period.
- There were 88 deaths registered in Scotland where Covid-19 was mentioned on the death certificate in the week ending 5 December. This is a 10% decrease from 98 deaths registered in the week to 28 November.
- Nationwide, wastewater Covid-19 levels have remained similar to last week, with the week ending on 7 December seeing levels of around 81 million gene copies per person per day (Mgc/p/d), about the same as the 78 Mgc/p/d seen the previous week.
- Over 4.3 million people in Scotland have been given a first vaccine against Covid-19, almost 4 million have received a second dose, and over 2 million people have received a booster or dose 3 by 9 December.
- East Ayrshire currently has the highest weekly case rate in Scotland reporting 641 weekly cases per 100,000 in the week to 6 December. Shetland has the lowest case rate in Scotland, reporting 127 weekly cases per 100,000 population.
- As determined through the latest weekly ONS survey, the percentage of people testing positive for Covid-19 in the private residential population has decreased in the most recent week in Scotland (26 November to 2 December 2021).
- Delta variant remains the dominant strain in Scotland. Prevalence rates of AY.4.2 (Delta +) have increased in recent weeks in both Scotland and England. Clinical implications of Delta+ are still to be determined.
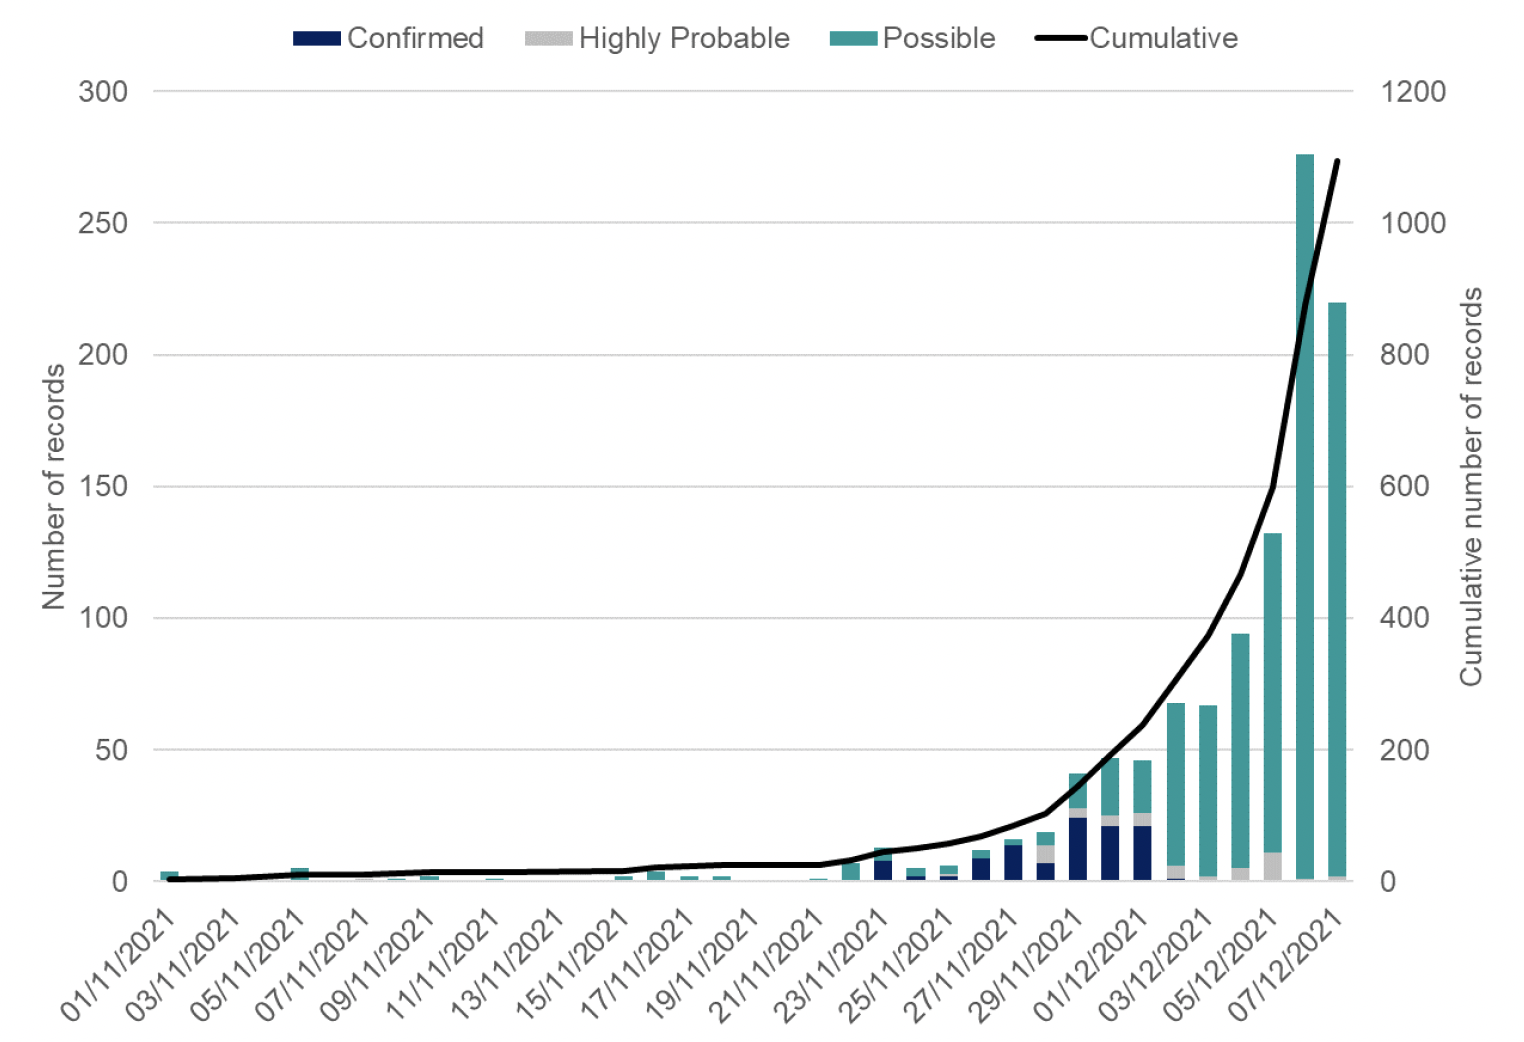
- Latest data shows there have been 109 confirmed, 48 highly probable, and 938 possible Omicron variant cases reported in Scotland, for a total of 1,095 confirmed or possible cases. This is based on specimens collected to 7 December 2021 and reported up to 9 December 2021. There continues to be uncertainty over infections, hospital occupancy and intensive care in the next two weeks. However, depending on the current number of Omicron cases and its characteristics, the number of infections, hospital and ICU occupancy over the next two weeks could be higher than projected.
Method
This report brings together a wide range of publically available figures from a range of data sources. These include publications by Scottish Government, Public Heath Scotland, National Records of Scotland and Office for National Statistics along with scientific publications and SAGE and UKHSA summaries where appropriate to summarise the state of the epidemic in Scotland in a given week. We also provide information on public attitudes to the virus from weekly YouGov polling surveys.
The National Picture
Estimated Infection Levels
The latest R value for Scotland, as of 23 November (using data to 6 December)[2], was between 0.9 and 1.1 (Figure 1), with a growth rate of between -3% and 0%. The lower limit of R value has increased, whereas the upper limit of growth rate has decreased since last week. This is based on Delta variant making up the majority of cases.
Not everyone who has the virus will be tested, as many people do not realise they have Covid-19, or they have mild symptoms and do not come forward. Latest modelled estimates suggest that, as at 23 November, based on data to 6 December, the incidence of new daily infections in Scotland was between 104 and 142 new infections per 100,000[3]. This equates to between 5,700 and 7,800 people becoming infected each day in Scotland. This is based on Delta variant making up the majority of cases.
Covid-19 Cases in Scotland
An average of 2,789 cases were reported per day in the 7 days to 9 December. This is a 9% increase from the daily average of 2,566 recorded on 2 December[4]. This includes 109 cases of the Omicron variant (B.1.1.529) which had been reported on 9 December[5].
In the week 27 November to 3 December 2021, there were 386 cases (PCR testing only) per 100,000 among unvaccinated individuals, compared to 239 cases per 100,000 for those that had been vaccinated with two or more doses[6].
In the last week, 7 day case rates have increased consistently in Scotland. There were 362 weekly cases per 100,000 population in the week to 6 December (by specimen date), which is a 9% increase from 332 weekly cases per 100,000 on 29 November[7]. This is lower than the most recent peak of 825 weekly cases per 100,000 on 6 September and lower than the previous peak of 425 weekly cases recorded on 3 July (Figure 2).
As of 6 December, the highest case rates (by specimen date) were observed amongst those aged under 20, followed by 40-59, 20-39, 60-79 and 80+ (Figure 3). In the week to 6 December, case rates have increased in all age groups under 60, have decreased in those aged 60-79 and appear to have plateaued in the over 80s (Figure 3). Those aged 0-19 saw largest increase in case rates.
The following section provides further breakdown of case rates for younger age groups. It is important to note that schools resumed in Scotland by the week ending 20 August 2021 and universities resumed by end of September 2021. Throughout October schools were on half-term holidays, and testing rates in children were lower during this period.
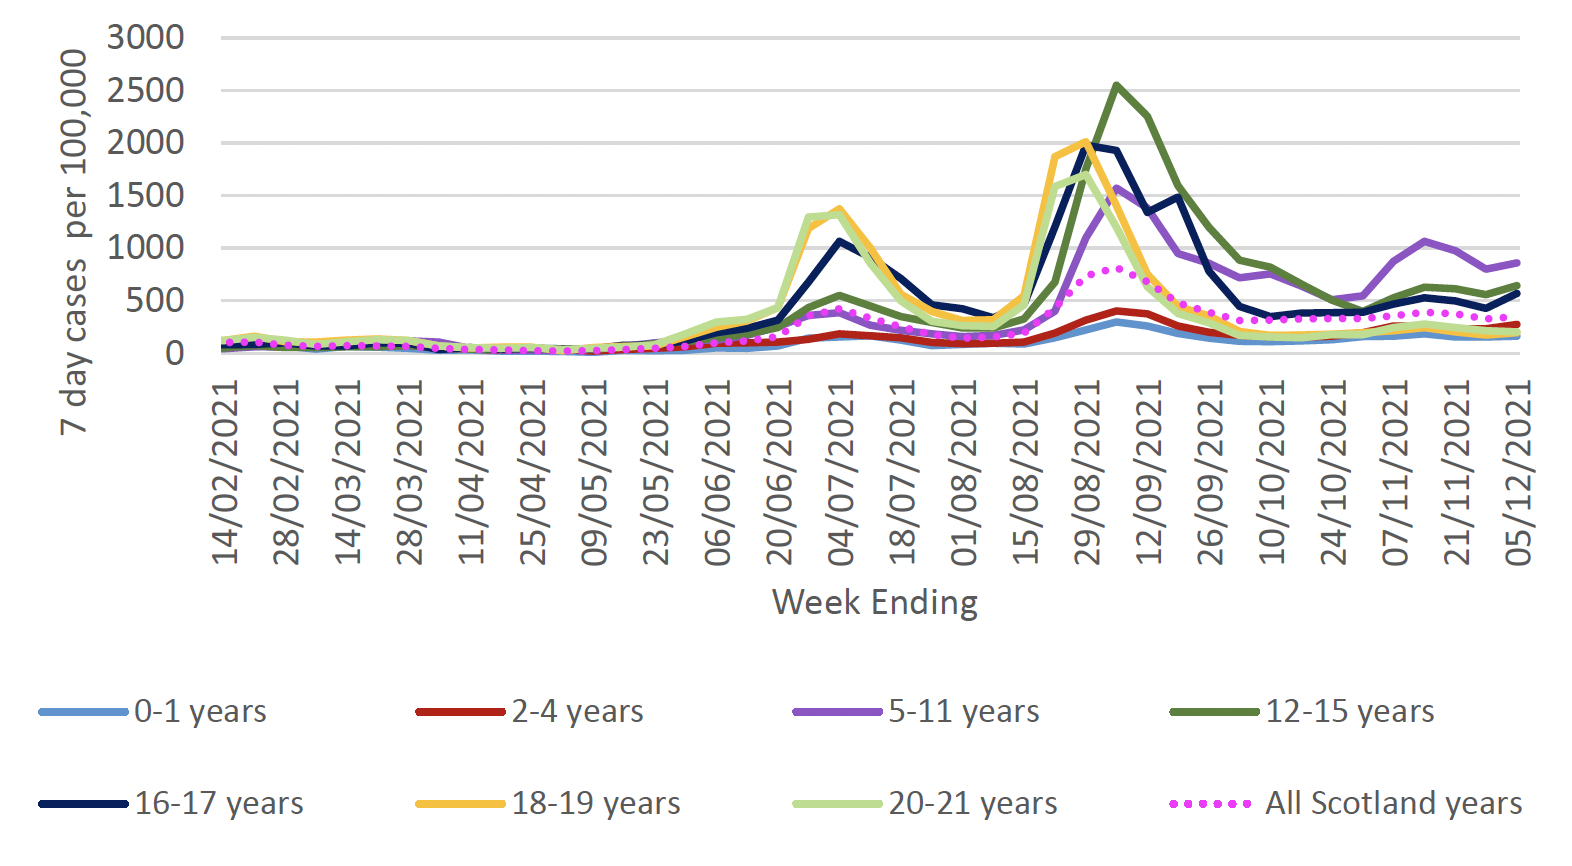
The total number of Covid-19 cases in young people aged under 22 has increased by 11% over the last week (6,152 cases recorded in the week to 28 November compared to 6,838 cases in the week ending 5 December). The number of cases has increased in all age groups under 22, except for 20-21 year olds where it decreased slightly. The percentage of cases made up of children under 12 was 61.6% (4,212 cases) in the week to 5 December, a further decrease from the previous week (63.3%)[9].
7 day case rates per 100,000 have also increased in all age groups under 22, except for 20-21 year olds, in the week ending 5 December (Figure 4). The largest increase in case rates occurred among those aged 16-17. Those aged 5-11, 12-15 and 16-17 had a higher 7 day case rate than the Scotland average in the week ending 5 December.
Testing Rates and Positivity
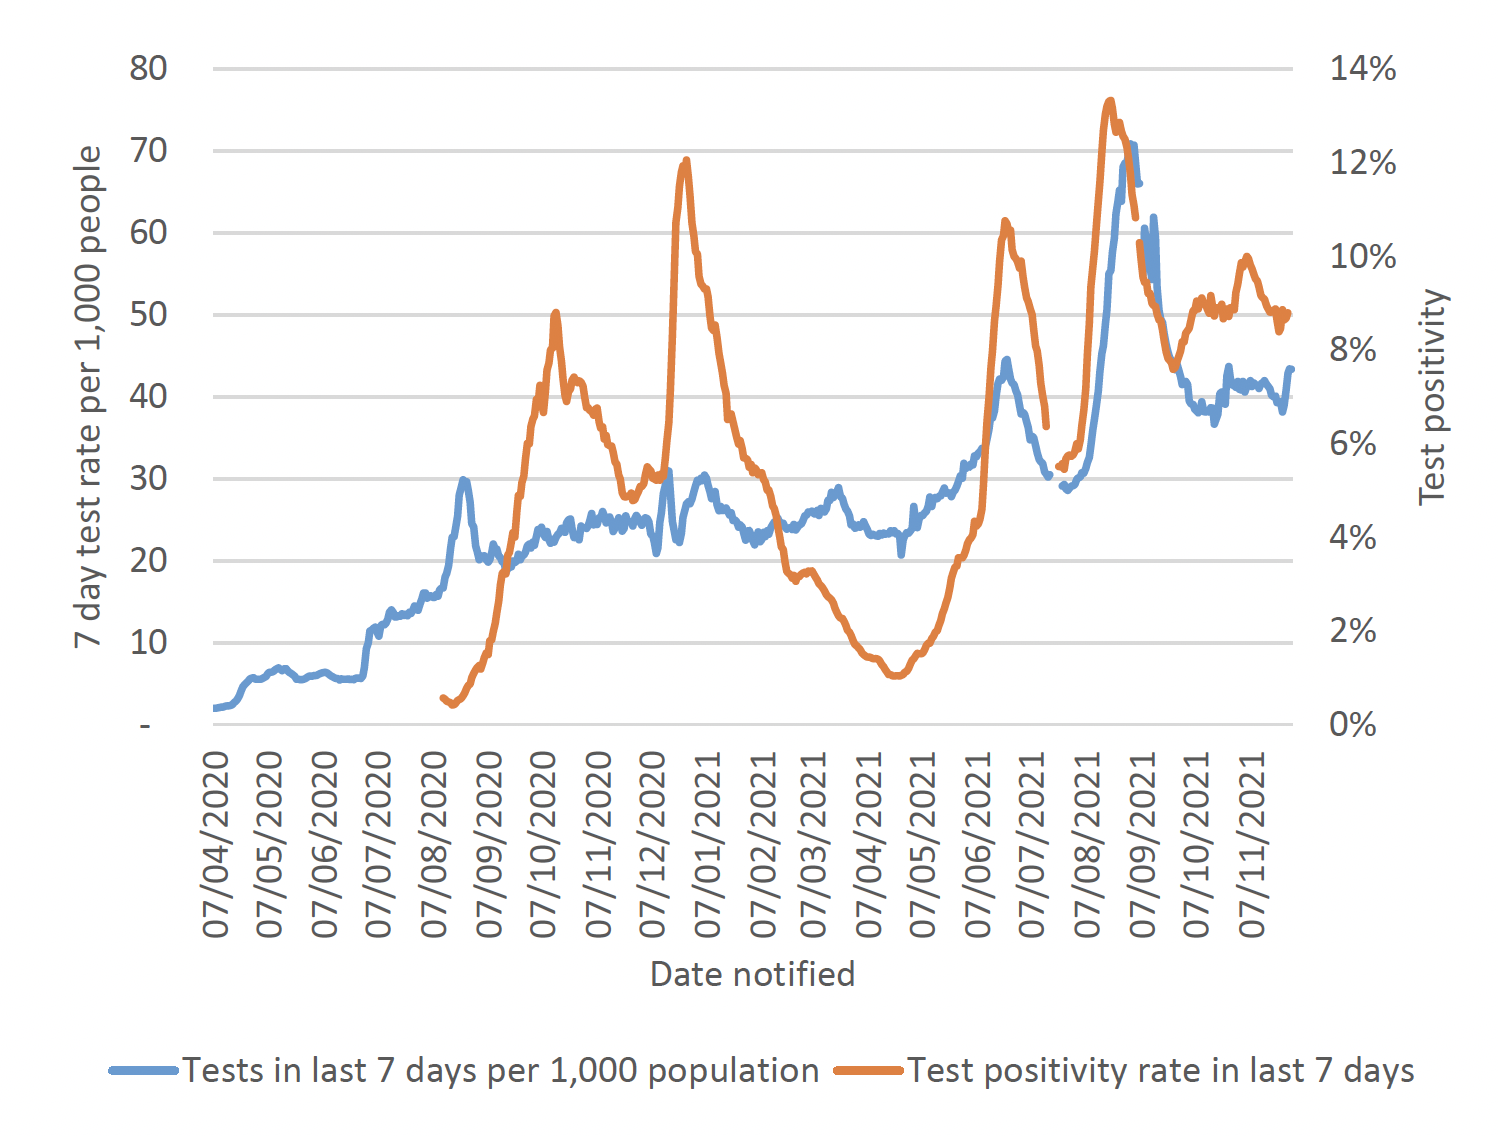
Tests per 1,000 population in the last seven days remained relatively stable throughout November with a slight decrease towards the end of the month. At the start of December tests per 1,000 people went back up to the same levels seen throughout November. Test positivity rate in the last seven days (proportion of positive tests) has decreased since mid-November, and as of 9 December it was at 8.8% (Figure 5)[10].
The rate of testing increased amongst all younger age groups (under 22 year olds), except for 0-1 year olds, in the week ending 5 December. Test positivity rates increased in all age groups under 18 in the same period.
There was an 8.8% increase in Lateral Flow Device tests that were carried out in Scotland from 29 November to 5 December 2021[11].
Wastewater Estimates
Measuring Covid-19 levels in wastewater is another way in which current infection levels can be estimated. In contrast to Covid-19 case records, virus shedding into wastewater is a biological process. This means that wastewater data is unaffected by factors that impact whether testing is done. Levels of SARS-CoV-2 in wastewater is monitored at 116 sites around Scotland. Nationwide, wastewater Covid-19 levels have remained similar to last week, with the week ending on 7 December seeing levels of around 81 million gene copies per person per day (Mgc/p/d), about the same as the 78 Mgc/p/d seen the previous week.
Hospital and ICU Occupancy and Admissions
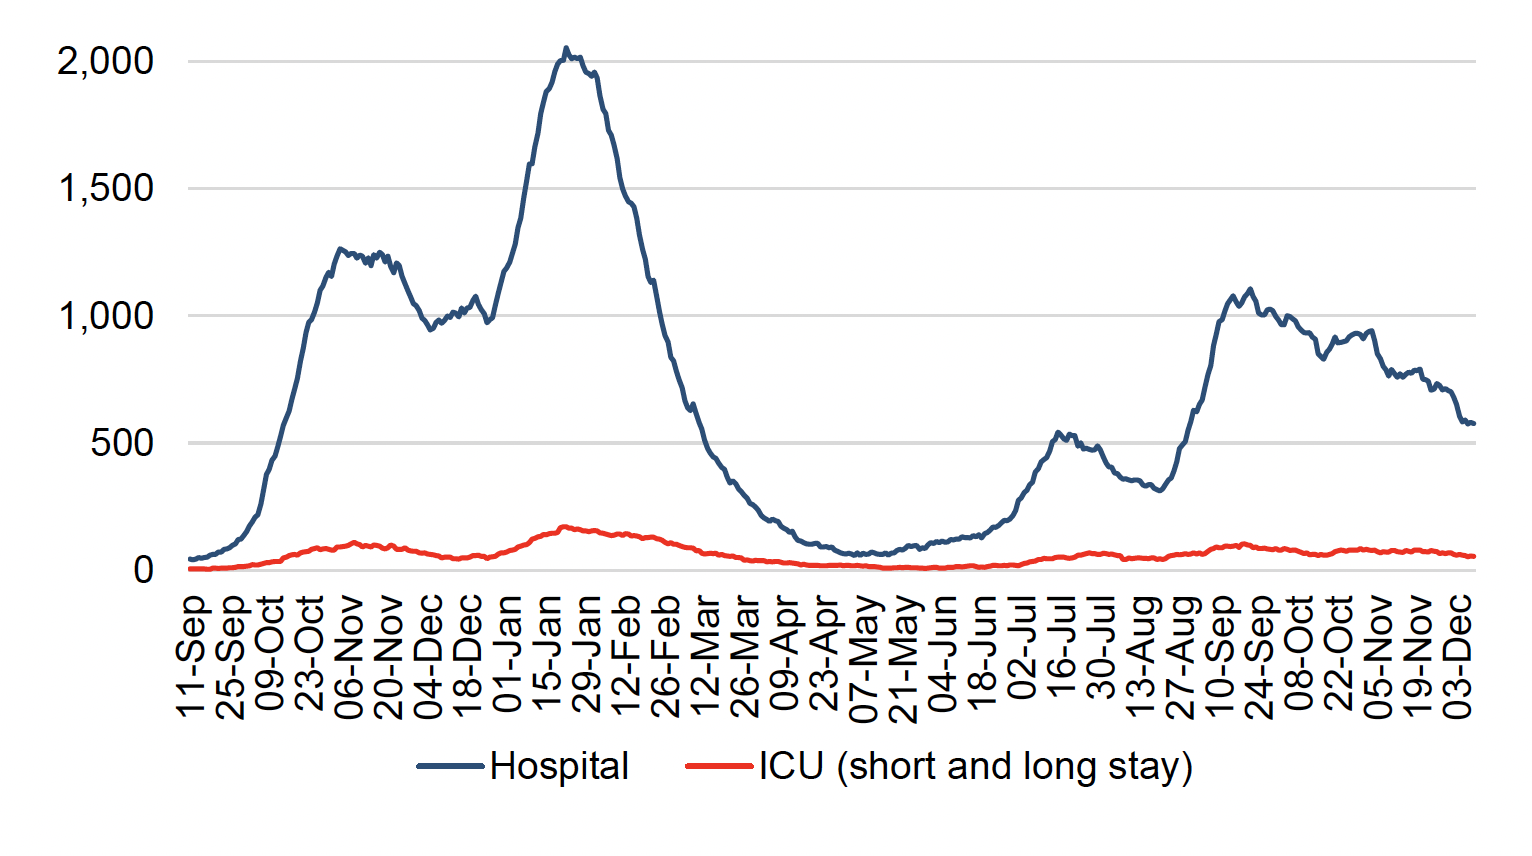
In the week to 9 December the number of people in hospital with confirmed Covid-19 has fluctuated but has decreased by 15% overall since 2 December. The number of people in hospital with confirmed Covid-19 for less than 28 days peaked at 2,053 on 22 January, decreased to a low of 58 on 6 May, and then increased to 1,107 on 21 September[13]. This has since decreased and as of 9 December there were 578 patients in hospital with Covid-19 and 55 in ICU (short and long stay) (Figure 6)[14]. The number of Covid-19 patients in ICU (short and long stay) has fluctuated but has decreased by 13% overall since 2 December.
The latest data from PHS shows 371 admissions to hospital for people with confirmed Covid-19 in the week to 5 December compared to 441 in the week to 28 November[16]. Average hospital admissions (3-week rolling average) related to Covid-19 in children and young adults have remained similar overall in the week leading up to 1 December 2021 compared to the previous three-week period.
In the 4 weeks to 3 December 29.2% of acute Covid-19 hospital admissions were in unvaccinated individuals[17]. For context, as of 2 December, 91% of those aged 12+ have had at least one dose of the vaccine. Overall, individuals in the oldest age groups were most likely to be hospitalised. The age-standardised rate of hospital admissions per 100,000 were higher in unvaccinated individuals compared to vaccinated individuals in the four weeks to 3 December. Unvaccinated individuals were 4.5 times more likely to be in hospital with Covid-19 compared to individuals that had received two doses of vaccine in the period 27 November to 3 December[18].
As the population is increasingly vaccinated, more of the patients in hospital will be fully or partially vaccinated. Therefore, it is important that we can differentiate between patients in hospital because of Covid-19 rather than with Covid-19. Public Health Scotland estimates that as at August 2021, 68% of Covid-19 related acute hospital admissions had a primary diagnosis of Covid-19. In March 2021 this figure stood at 75%, and then decreased to a low of 66% in April 2021. This increased to 75% in July, but saw a decrease in August[19].
Deaths
There were 88 deaths registered where Covid-19 was mentioned on the death certificate in the week to 5 December 2021. This is a decrease of 10 (-10%) in the number of deaths from the previous week, and 87% lower than the peak in April 2020 (663 deaths). The proportion of deaths in care homes decreased from 60% in April 2020 to 5% in the week to 5 December 2021, with 4 deaths occurring in care homes in this week[20].
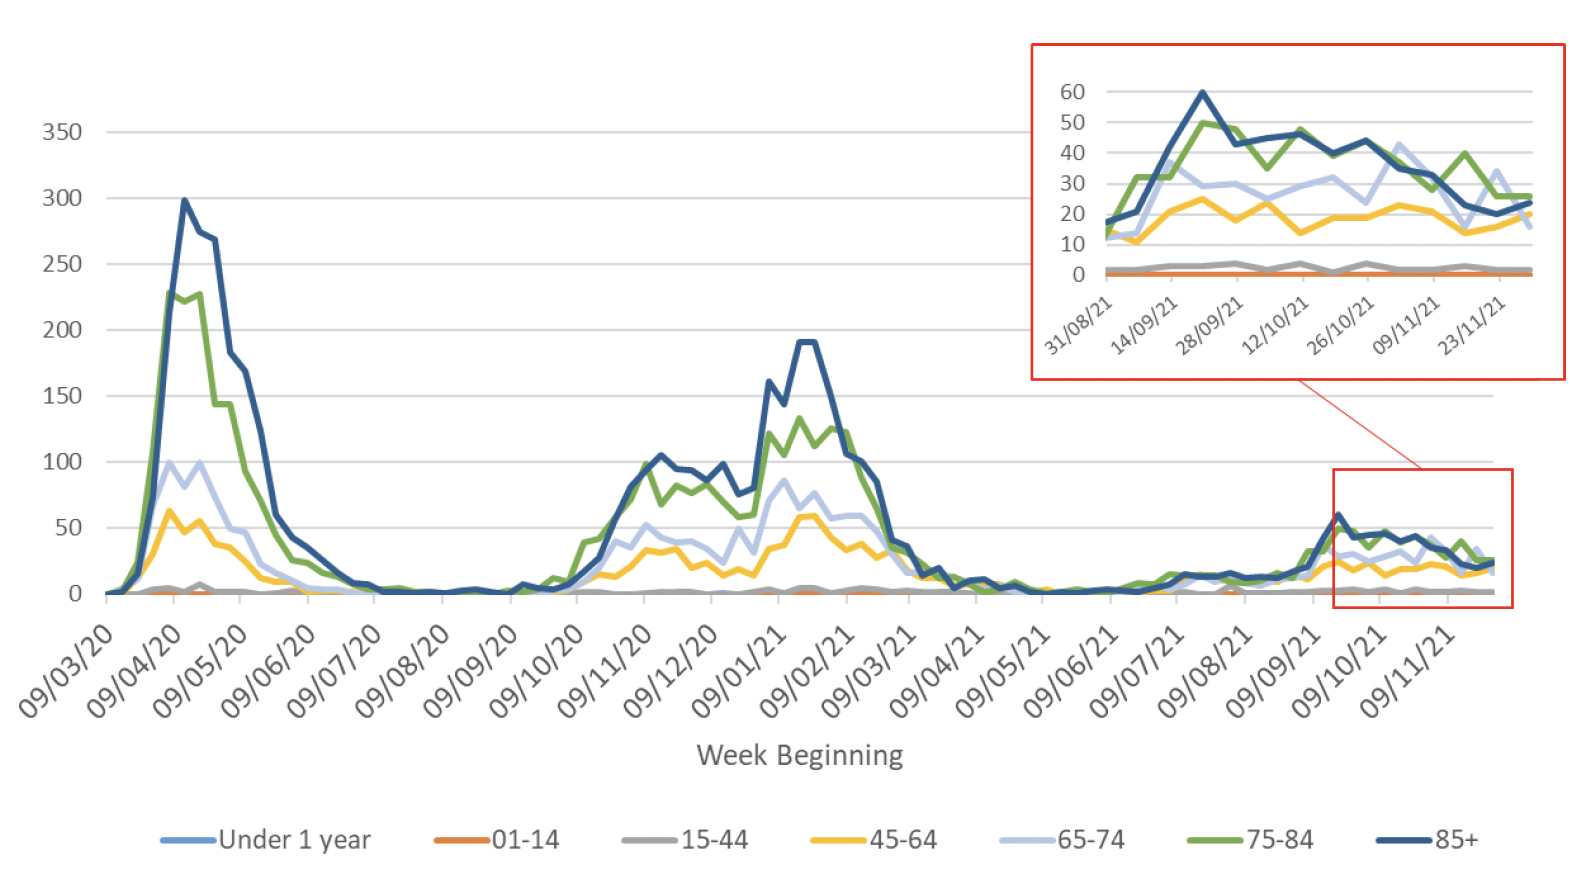
In the same week, deaths involving coronavirus decreased in all age groups compared to the week ending 28 November (Figure 7). National Records of Scotland publish a weekly detailed analysis on deaths involving Covid-19 in Scotland in their weekly report[21]. From 29 December 2020 to 26 November 2021, 65.4% of Covid-19 deaths were in unvaccinated individuals[22]. Amongst those individuals who have been vaccinated with two doses of Covid-19 vaccine, 78.0% of the confirmed Covid-19 deaths occurred in the 70+ age group[23].
Vaccinations
The first vaccines were administered on Tuesday 8 December 2020 and over 4.3 million people had received their first dose by 9 December 2021[24]. This represents 91% of the Scottish population over age 12[25]. Almost 4 million people (almost 83% of those aged 12 and over) had received their second dose and over 2 million people (42% of those over 12 years of age) have received their dose 3 or booster vaccine by 9 December[26]. There remains a low level of deaths amongst vaccinated individuals (Figure 7).
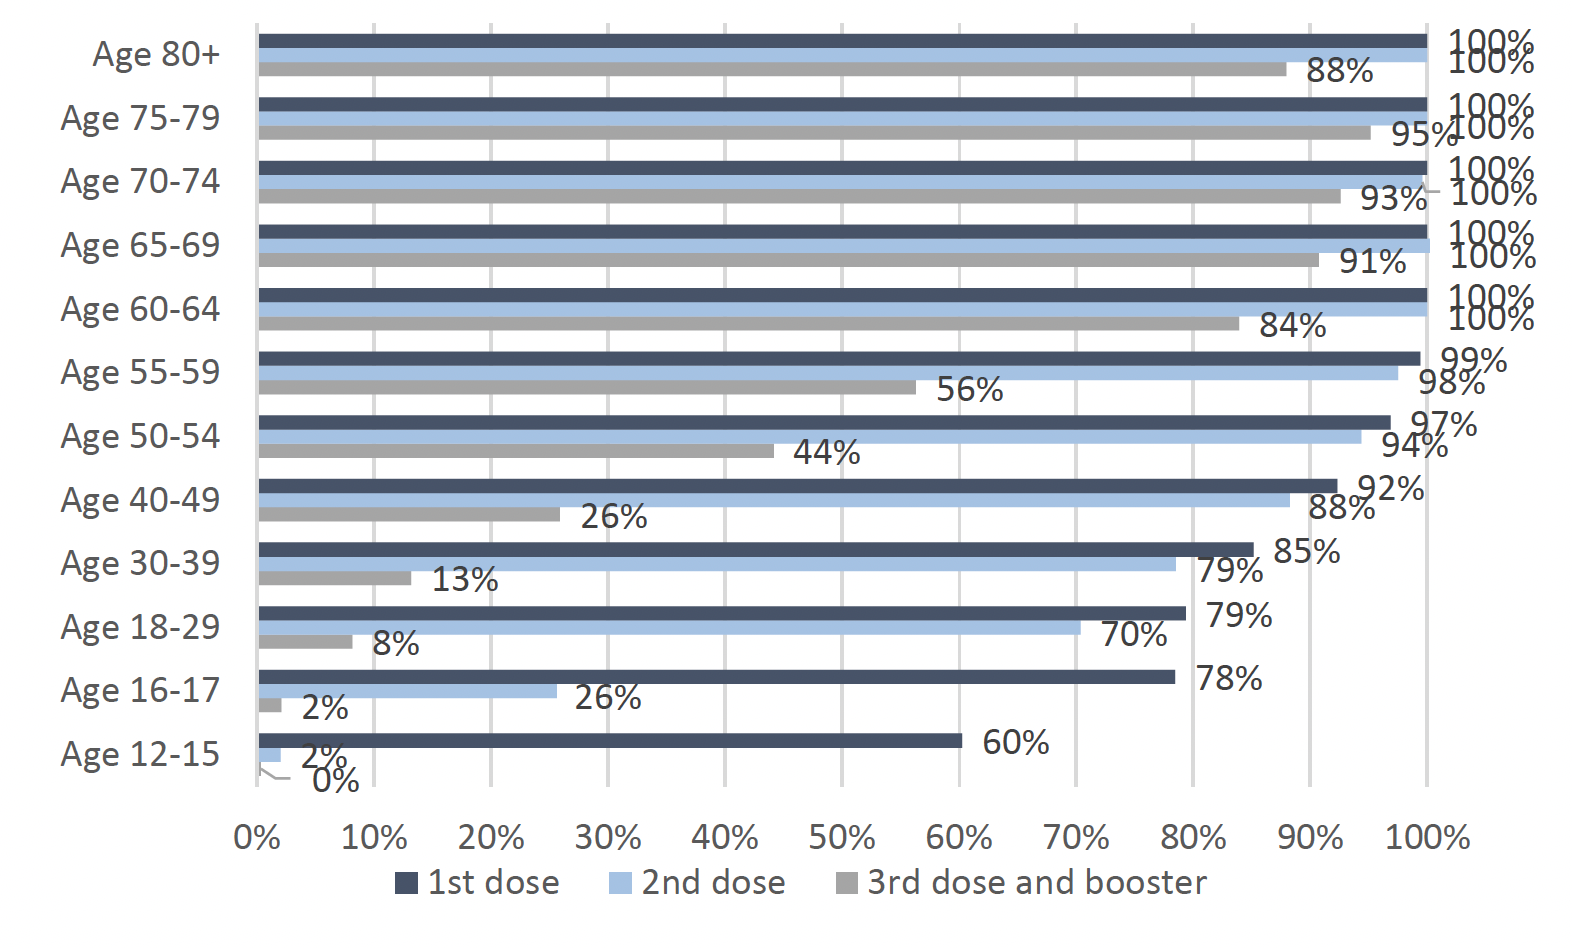
A booster dose or a third dose of the vaccine is now also available in Scotland, in line with JCVI advice including all adults aged over 40 for whom it has been at least 12 weeks since their second dose. Booster vaccine uptake is at least 84% for those aged 60 or over. 56% of those aged 55-59 and 44% of those aged 50-54 have received a booster or third dose, with age groups under 50 have an estimated coverage of less than 26% (Figure 8).
The proportion of people surveyed who said they have been vaccinated for Covid-19 is high. 92% of all respondents have already received at least their first vaccine dose. Of those not vaccinated (and small base must be noted), 13% report they are likely to be vaccinated when a vaccine becomes available to them[27].
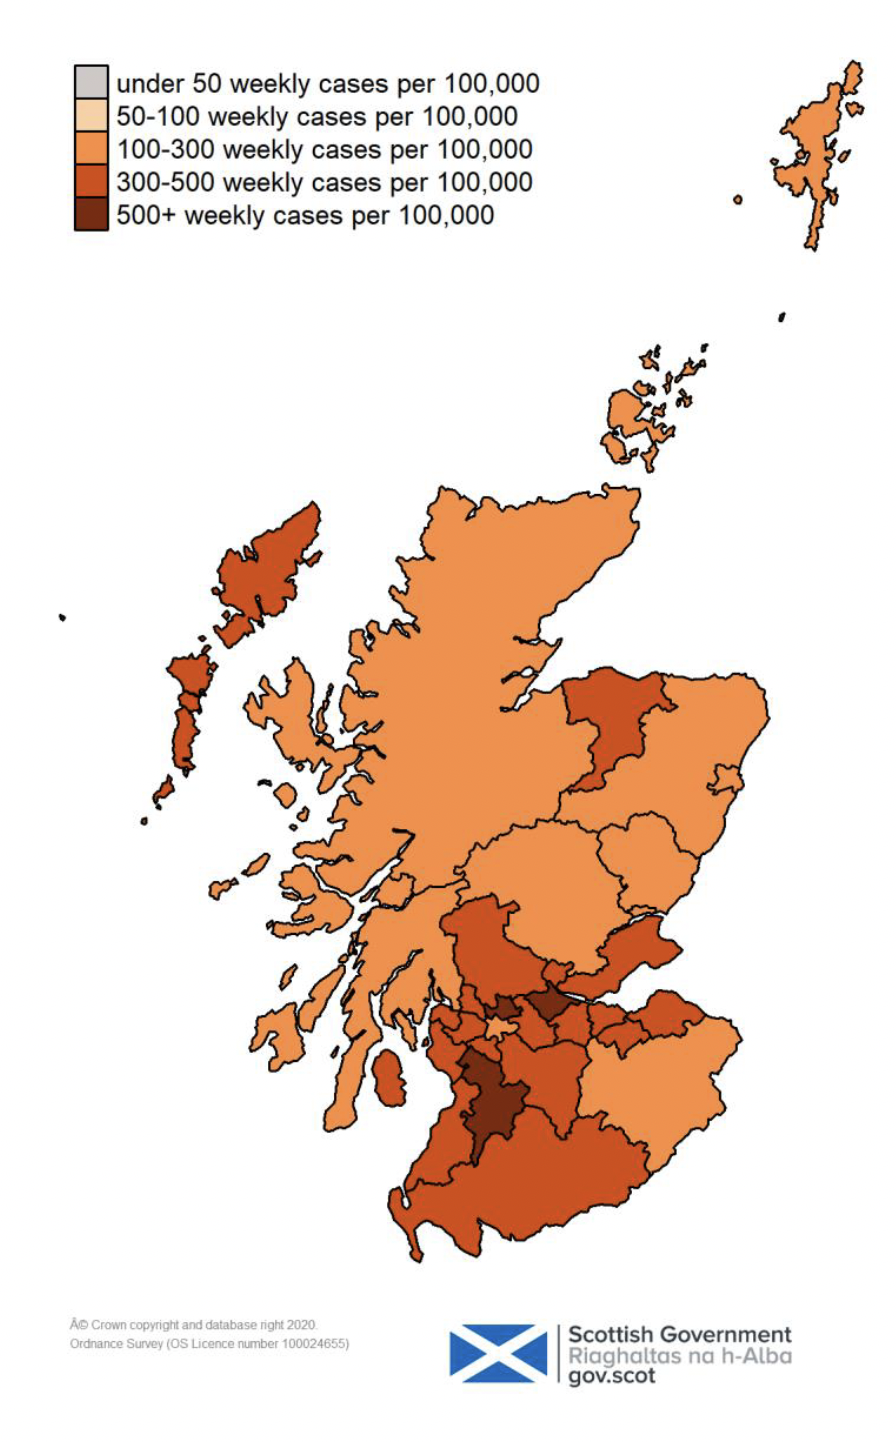
Situation by local authority within Scotland
Case rates have increased in Scotland over the past week. East Ayrshire currently has the highest weekly case rate in Scotland reporting 641 weekly cases per 100,000 in the week to 6 December. Shetland Islands has the lowest case rate in Scotland, reporting 127 weekly cases per 100,000 population in the week to 6 December[28]. Case rates remain very high (over 150 weekly cases per 100,000 population) across Scotland with all local authorities, except for Orkney and Shetland Islands, reporting over 200 weekly cases per 100,000 population in that week (Table 1 and Figure 9).
| Local authority | Total new cases in the week, per 100,000 population | Change since previous week |
|---|---|---|
| East Ayrshire | 641 | +170 |
| Falkirk | 569 | -32 |
| East Dunbartonshire | 520 | +97 |
| West Dunbartonshire | 455 | +114 |
| East Renfrewshire | 427 | -5 |
| East Lothian | 421 | +19 |
| Fife | 416 | +18 |
| Clackmannanshire | 415 | +49 |
| North Lanarkshire | 412 | +55 |
| South Ayrshire | 404 | +90 |
| South Lanarkshire | 403 | +85 |
| Inverclyde | 398 | +42 |
| West Lothian | 396 | +7 |
| Moray | 395 | +44 |
| North Ayrshire | 390 | +105 |
| Renfrewshire | 386 | +99 |
| Midlothian | 380 | +97 |
| Dumfries and Galloway | 378 | +13 |
| Stirling | 368 | +38 |
| City of Edinburgh | 334 | +11 |
| Na h-Eileanan Siar | 313 | +79 |
| Glasgow City | 299 | +39 |
| Aberdeen City | 296 | -62 |
| Perth and Kinross | 295 | +21 |
| Argyll and Bute | 284 | +29 |
| Angus | 283 | -123 |
| Scottish Borders | 272 | -8 |
| Aberdeenshire | 269 | -24 |
| Highland | 258 | +25 |
| Dundee City | 210 | -26 |
| Orkney Islands | 147 | +36 |
| Shetland Islands | 127 | -39 |
| Scotland | 362 | +30 |
There is uncertainty when modelling predicted case rates in regions with smaller populations, and hence lower test counts. This concerns local authorities such as Na h-Eileanan Siar, Orkney Islands and Shetland Islands.
The most recent modelling predicts, based on data up to 6 December, that for the week commencing 19 December 2021, 30 out of the 32 local authorities are expected to exceed 50 cases per 100,000 population with at least 75% probability. 29 local authorities are expected to exceed 100 cases per 100,000 with this probability. Three local authorities (East Ayrshire, East Dunbartonshire and Falkirk) are expected to exceed 300 cases per 100,000 population. There are no local authorities expected to exceed 500 cases per 100,000 population with at least 75% probability[29]. These models are based on a projection where Delta variant makes up the majority of cases.
How Scotland compares with the rest of the UK
Average daily cases in Scotland (510 per 1 million) in the week to 9 December were below Northern Ireland (906 per 1 million), England (731 per 1 million), and Wales (723 per 1 million)[30]. Average daily deaths in Scotland (2 per 1 million population) in the week to 9 December were similar to England and Wales (2 per 1 million each), and below Northern Ireland (3 per 1 million)[31].
There were 7,308 confirmed Covid-19 patients in hospital in the UK on 8 December 2021, with 5,932 of them reported in England, 610 in Scotland, 416 in Wales and 350 in Northern Ireland[32]. This translates to 10 patients per 100,000 population for England, 11 patients per 100,000 in Scotland, 13 per 100,000 for Wales and 18 per 100,000 for Northern Ireland (based on 7 day averages for all 4 nations). Please note that data about Covid-19 patients in hospitals are collected differently by each nation and therefore might not be directly comparable.
The ONS Covid-19 Infection Survey estimates that in the week 26 November to 2 December 2021, the estimated percentage of the population living in private residential households testing positive for Covid-19 in Scotland was 1.24% (95% credible interval: 1.01 % to 1.50%). The percentage of people testing positive for Covid-19 in the private residential population has decreased in the most recent week. In the week 25 November to 1 December 2021, estimates for the other nations of the UK are as follows: 1.64% (95% credible interval: 1.54% to 1.73%) for England, 1.98% (95% credible interval: 1.62% to 2.34%) for Wales and 2.14% (95% credible interval: 1.67% to 2.67%) for Northern Ireland. This equates to around 1 in 80 people in Scotland, 1 in 60 in England, 1 in 50 in Wales and 1 in 45 in Northern Ireland[33].
The ONS Covid-19 Infection Survey estimated that in the week beginning 15 November 2021, 95.0% (95% CI: 94.0% to 95.9%) of the adult population living in private residential households in Scotland would have tested positive for antibodies against SARS-CoV-2, as a result of having the infection in the past or being vaccinated. This compares to 95.3% in England (95% CI: 94.5% to 96.0%), 93.9% in Wales (95% CI: 92.7% to 95.0%) and 91.6% in Northern Ireland (95% CI: 87.9% to 93.5%)[34].
An estimated 1.9% of the population living in private residential households in the UK were experiencing self-reported long Covid symptoms (symptoms persisting for more than four weeks after the first suspected coronavirus (Covid-19) infection that were not explained by something else) in the 4 weeks ending 31 October 2021. In Scotland, 99,000 people (1.87% of the respective population) living in private households self-reported long Covid symptoms for this period. This compares to 1.88% in England, 1.80% in Wales and 1.52% in Northern Ireland[35].
How the virus is changing
Omicron variant
On 23 November 2021, a small number of cases of a new variant were reported by South Africa to the international genomic database, GISAID. This variant was designated B.1.1.529 on 24 November 2021 and has over 30 mutations within the Spike protein. On 26 November, WHO designated B.1.1.529 as a SARS-CoV-2 Variant of Concern known as Omicron.
The latest Omicron Risk assessment carried out by the UK Health Security Agency (UKHSA) established with high confidence that Omicron is displaying a growth advantage with increased household transmission risk, increased secondary attack rates and increased growth rates compared to the Delta variant[36].
Latest data shows there have been 109 confirmed, 48 highly probable, and 938 possible Omicron variant cases reported in Scotland, a total of 1,095, see Figure 10. This is based on specimens collected to 7 December 2021 and reported up to 9 December 2021.
[37] [38]. Cases are widely spread across Scotland's Health Boards; the highest numbers of confirmed, highly probable and possible cases under investigation have been detected in the Greater Glasgow and Clyde and the Lanarkshire NHS health boards[39]. Public Health Scotland are not yet aware of hospitalisations in those with a confirmed Omicron case[40]. Based on data to 6 December, Omicron was estimated to have a doubling time for Scotland of between 2.18 - 2.66 days using S-gene target failure as a proxy for Omicron cases[41].
Delta and Other Variants of Concern
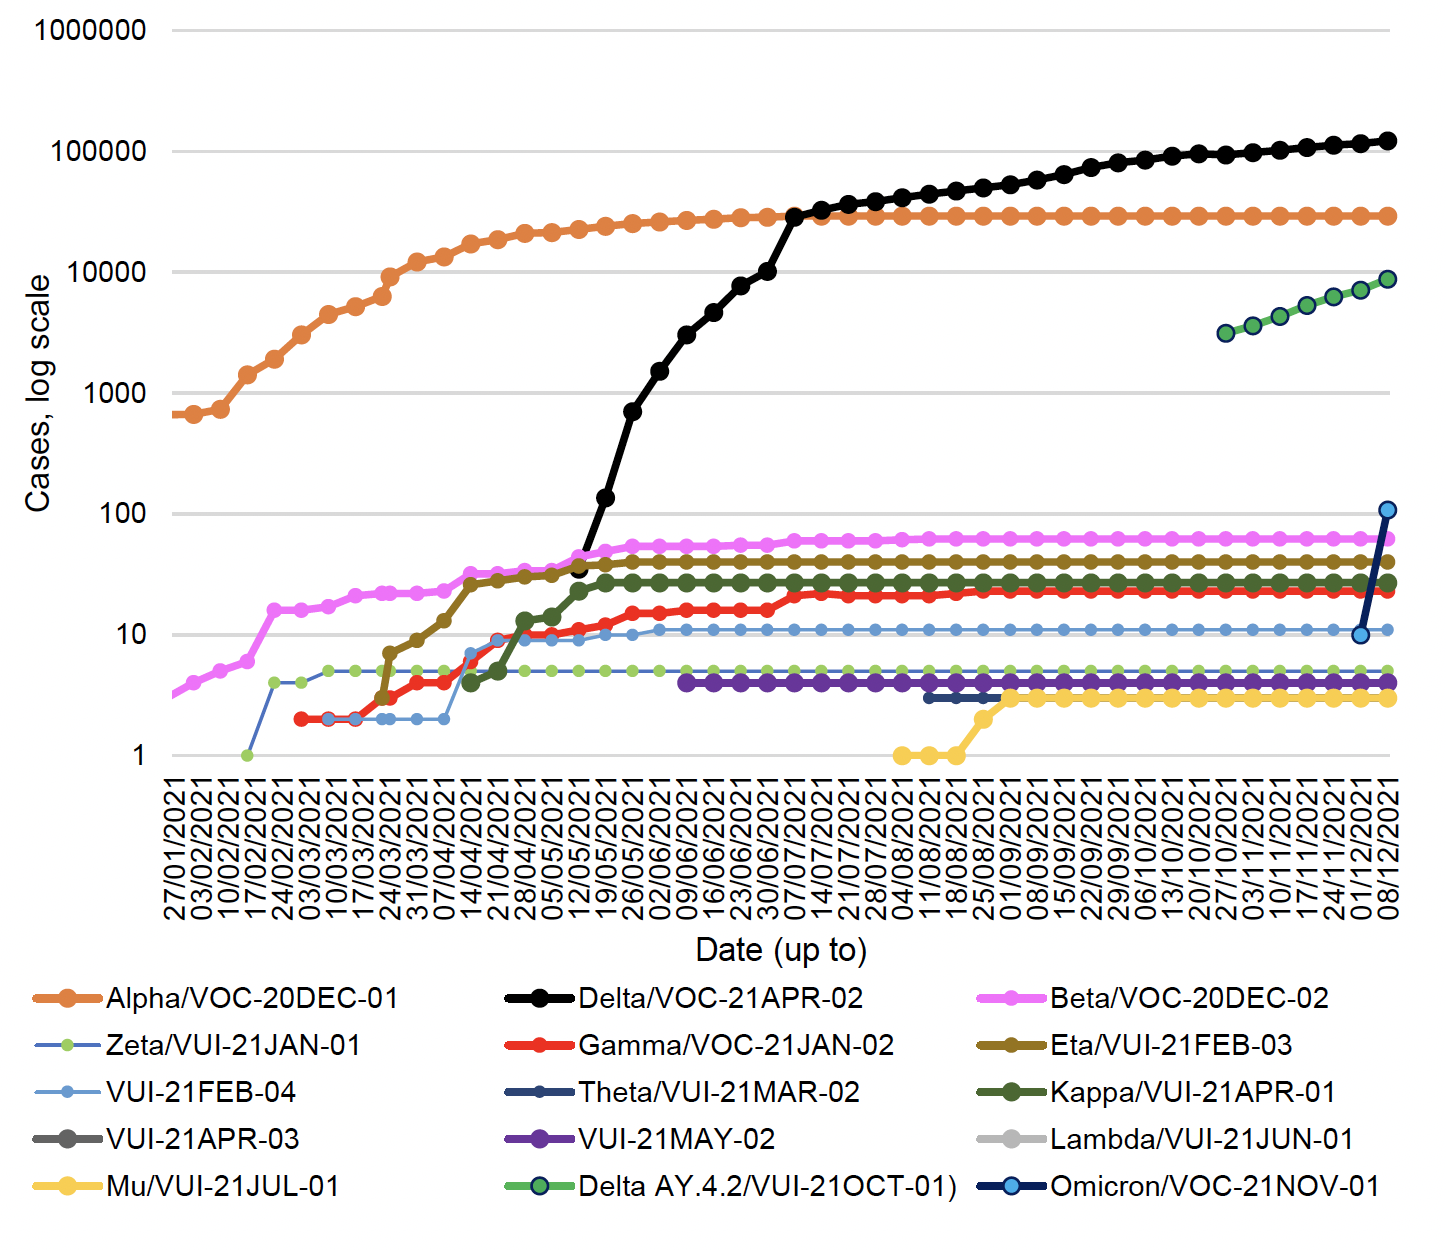
The Delta variant (VOC-21APR-02) remains the dominant strain in Scotland. The variant of concern Delta, also referred to as VOC-21APR-02 (first identified in India) is more transmissible than Alpha variant [43] [44] [45]. It quickly replaced Alpha (VOC-20DEC-01), first identified in the UK, as the dominant strain in Scotland, and 122,443 cases have now been identified as Delta to 8 December 2021. A sublineage of Delta, AY.4.2, has been classified as VUI-21OCT-01, and 8,783 cases have now been identified in Scotland.
To date there are four additional 'variants of concern' (VOCs) and eleven 'variants under investigation' (VUIs)[46]. There remains a concern that some of these new variants may partially escape immunity, from both natural infection and from vaccines currently being deployed and we are monitoring the evidence on this[47] [48] [49]. Up to 8 December there have been 62 genomically confirmed cases of the variant Beta/VOC-20DEC-02 (first detected in South Africa), and 23 cases of Gamma in Scotland. Genomically confirmed cases of other VOCs and VUIs remain low, there have been no new cases of other VOCs or VUIs in the last week (Figure 11). There remains uncertainty regarding the impact of the Delta variant on severity of illness, treatment or reinfections. As more data is analysed we shall become more certain of the impact of Delta on infections, hospitalisations and disease severity and long term vaccine protection effects.
The effectiveness of vaccines
On 29 October 2021, the vaccine effectiveness expert panel (VEEP) published their updated consensus view on the effectiveness of different vaccines on infections, symptomatic disease, and severe disease as well as some initial evidence on vaccine waning effects[51]. The consensus view of vaccine effectiveness against symptomatic disease in fully vaccinated people is between 45-95%, depending on the vaccine and when it was administered. Data from the Office of National Statistics generated during the Delta period reports that two vaccine doses (14 days or more previously) reduced the risk of testing positive by 67% (95% confidence interval: 64% to 70%) compared to a reference group which included those not yet vaccinated, those 21 days or more before the first vaccination and those without evidence of prior infection[52].
Public Health England analysis shows that Oxford-AstraZeneca, Pfizer-BioNTech and Moderna vaccines are highly effective against hospitalisation and death from Delta variant with vaccine effectiveness of over 90% after two doses of vaccine[53]. A recent report from EAVEII finds that from 1 April to 27 September 2021, there were 201 Covid-19 deaths in the group studied. In the 16-39 age bracket, 17 unvaccinated people died and no fully vaccinated people died. The Pfizer-BioNTech vaccine was 95% effective in 40-59 year olds and 87% effective in people 60 and over. The Oxford-AstraZeneca vaccine was 88% effective in 40-59 year olds and 90% effective in people aged 60 or older. In people of all ages who had been double-vaccinated at least two weeks before a positive PCR test, the vaccines offer around 90% effectiveness against Covid-19 deaths caused by the Delta variant[54]. Vaccine effectiveness against symptomatic disease, hospitalisation and death wanes over time[55]. The Joint Committee on Vaccination and Immunisation (JCVI) gave advice on a booster programme to re-vaccinate adults against Covid-19 in the UK[56]. The booster program has been recently expanded in response to emergence of the Omicron variant[57]. Preliminary data shows an increase in vaccine effectiveness after the booster dose[58], however, the impact of the Omicron variant on vaccine and booster effectiveness is still unknown[59]. The UKHSA reported that Omicron is displaying a reduction in immune protection against infection, however, the data are insufficient to quantify the vaccine effectiveness, risk of reinfection or protection against severe disease[60].
PHS estimated in an analysis published on 25 November that 27,656 deaths in people 60 years and older have been directly averted as a result of Scotland's Covid-19 vaccination programme. This equates to an estimated 86% of deaths averted by vaccination in this age group[61].
Looking ahead
Scottish Contact Survey
Changes in patterns of mixing and adherence to restrictions will impact on future case numbers. The Scottish Contact Survey measures times and settings that people mix where they could potentially spread Covid-19. Average contacts from the most recent Panel A cohort of the Scottish Contact Survey (week ending 1 December) indicate an average of 4.8 contacts.
Mean within the home have increased by 7% whereas work contacts have decreased by 8% in the last two weeks. Contacts within the other setting (contacts outside home, school and work) have remained at a similar level over the same period.
Contacts for those in the 18-29 age group have almost doubled with a current level of 6.6 mean contacts. The biggest increase in interactions is seen between those under 18 with individuals within the 18-29 age group, contacts between these age groups are at least three times higher than 2 weeks prior.
Self-reported compliance with the current regulations and guidance has decreased since January but remains at a high level. On 30 November – 1 December, 70% of people reported 'complete' or 'almost complete' compliance[62].
Modelling the Epidemic
Depending on the current number of Omicron cases and its characteristics, the actual number of hospital occupancy over the next two weeks could be higher than projected here. Current projections are based on Delta variant making up the majority of cases. There continues to be uncertainty over hospital occupancy and intensive care in the next two weeks (Figure 12)[63]. The latest Modelling the epidemic report includes a section on the Omicron variant and how this might impact on Scotland.
Next steps
The Scottish Government continues to work closely with Public Health Scotland and modelling groups to monitor what is happening across Scotland.
Each week this report will provide an overview of the current Covid-19 situation in Scotland. This will include real time data on case rates, hospitalisations and deaths and how Scotland's figures compare to those from the rest of the UK.
Modelling can tell us where the epidemic is likely to be heading. Local data and data by age group can highlight where problems arise, which can help in addressing some of these issues. In the coming weeks the roll out of the vaccine will continue to be monitored along with the impact of this on case rates and deaths among different age cohorts. Investigations are ongoing by NERVTAG, SPI-M, SAGE, UKHSA, Public Health England and Public Health Scotland regarding the impact of new variants and of vaccination; this will be reflected here as work is undertaken.