Coronavirus (COVID-19): ONS Infection Survey – headline results – 9 July 2021
Results from the ONS COVID-19 infection survey from 9 July 2021.
The COVID-19 Infection Survey aims to measure:
- how many people test positive for COVID-19 infection at a given point in time, regardless of whether they report experiencing coronavirus symptoms
- the average number of new infections per week over the course of the study
- the number of people who test positive for antibodies, to indicate how many people are ever likely to have had the infection or have been vaccinated
The Office for National Statistics (ONS) publish estimates for England, Wales, Northern Ireland and Scotland on their website.
The underlying data displayed in the charts in this publication is available in the reference tables on the ONS website.
All results are provisional and are subject to revision.
Main points
In the week 27 June to 3 July 2021, the estimated percentage of the community population (private households) testing positive for COVID-19 in Scotland was 1.01% (95% credible interval: 0.78% to 1.27%). The percentage of people testing positive in the community has continued to increase in the most recent week.
This equates to an estimated 53,200 people in the community population in Scotland that had COVID-19 at any given time (95% credible interval: 41,300 to 67,000), or around 1 in 100 people (95% credible interval: 1 in 130 to 1 in 80).
In the week 27 June to 3 July 2021, estimates for the other nations of the UK are as follows:
- in England, the percentage of people testing positive in the community has continued to increase in the most recent week to 0.61% (95% credible interval: 0.54% to 0.68%)
- in Wales, the percentage of people testing positive in the community has continued to increase over the most recent week to 0.30% (95% credible interval: 0.17% to 0.45%)
- in Northern Ireland, the trend in the percentage of people testing positive in the community has increased in the most recent week at 0.33% (95% credible interval: 0.16% to 0.57%)
The proportion of people testing positive is higher in the younger age groups. In the most recent week, the proportion of people testing positive in the community population in Scotland has continued to increase for all ages, although uncertainty is high for some ages.
In the week 27 June to 3 July, the trend in the percentage of people in the community testing positive whose results are compatible with the Delta variant (B.1.617.2) continued to increase in Scotland.
In Scotland, in week 13 to 19 June 2021, it is estimated that there were 2,900 new positive cases per day (95% credible interval: 2,200 to 3,800). Please note, there is a lag of two weeks between the incidence estimate and the positivity estimate.
Modelled estimate of the proportion of the community population in Scotland that had the coronavirus (COVID-19)
It is estimated that in the most recent week (27 June to 3 July 2021), the percentage of the community population (private households) in Scotland that had the coronavirus (COVID-19) was 1.01%. A 95% credible interval for this figure is 0.78% to 1.27%.
In the same week, it is estimated that at any given time 53,200 people in the community in Scotland had COVID-19. A 95% credible interval for this figure is 41,300 to 67,000. This equates to around 1 in 100 people (95% credible interval: 1 in 130 to 1 in 80).
In Scotland, it is estimated that the percentage of people testing positive for COVID-19 in the community population has continued to increase in the most recent week.
Modelled daily estimates of the percentage of people testing positive for COVID-19, and accompanying credible intervals, are represented in Figure 1 by the blue line and grey shading. The model smooths the series to understand the trend and is revised each week to incorporate new test results. Modelled daily estimates are used to calculate the official reported estimate.
Official reported estimates of the percentage of people testing positive for COVID-19, are based on the modelled estimate for the midpoint of the most recent week at the time of publication. Official reported estimates, and accompanying credible intervals, are represented in Figure 1 and Figure 2 by the point estimates (blue circles). In Figure 2, pale blue circles denote 14-day weighted estimates while the official reported weekly estimates are denoted by dark blue circles.
Figure 1: Modelled daily estimates and official reported estimates of the percentage of the community population in Scotland testing positive for COVID-19 between 23 May and 3 July 2021, including 95% credible intervals (see notes 2,3,4,5,6)
Figure 2 shows the trend in the official weekly reported estimates of the percentage of the community population testing positive for COVID-19 between 3 October 2020 and 3 July 2021. As shown in Figure 2, there has been an increase in the estimated percentage of the community population testing positive for COVID-19 in the most recent weeks. All official reported estimates of positivity displayed in this chart are available in the accompanying dataset on the ONS website.
Figure 2: Official reported estimates of the percentage of the community population in Scotland testing positive for COVID-19 between 3 October 2020 and 3 July 2021, including 95% credible intervals (see notes 3,4,5,6,7)
Age analysis of the percentage of people testing positive for COVID-19 in Scotland
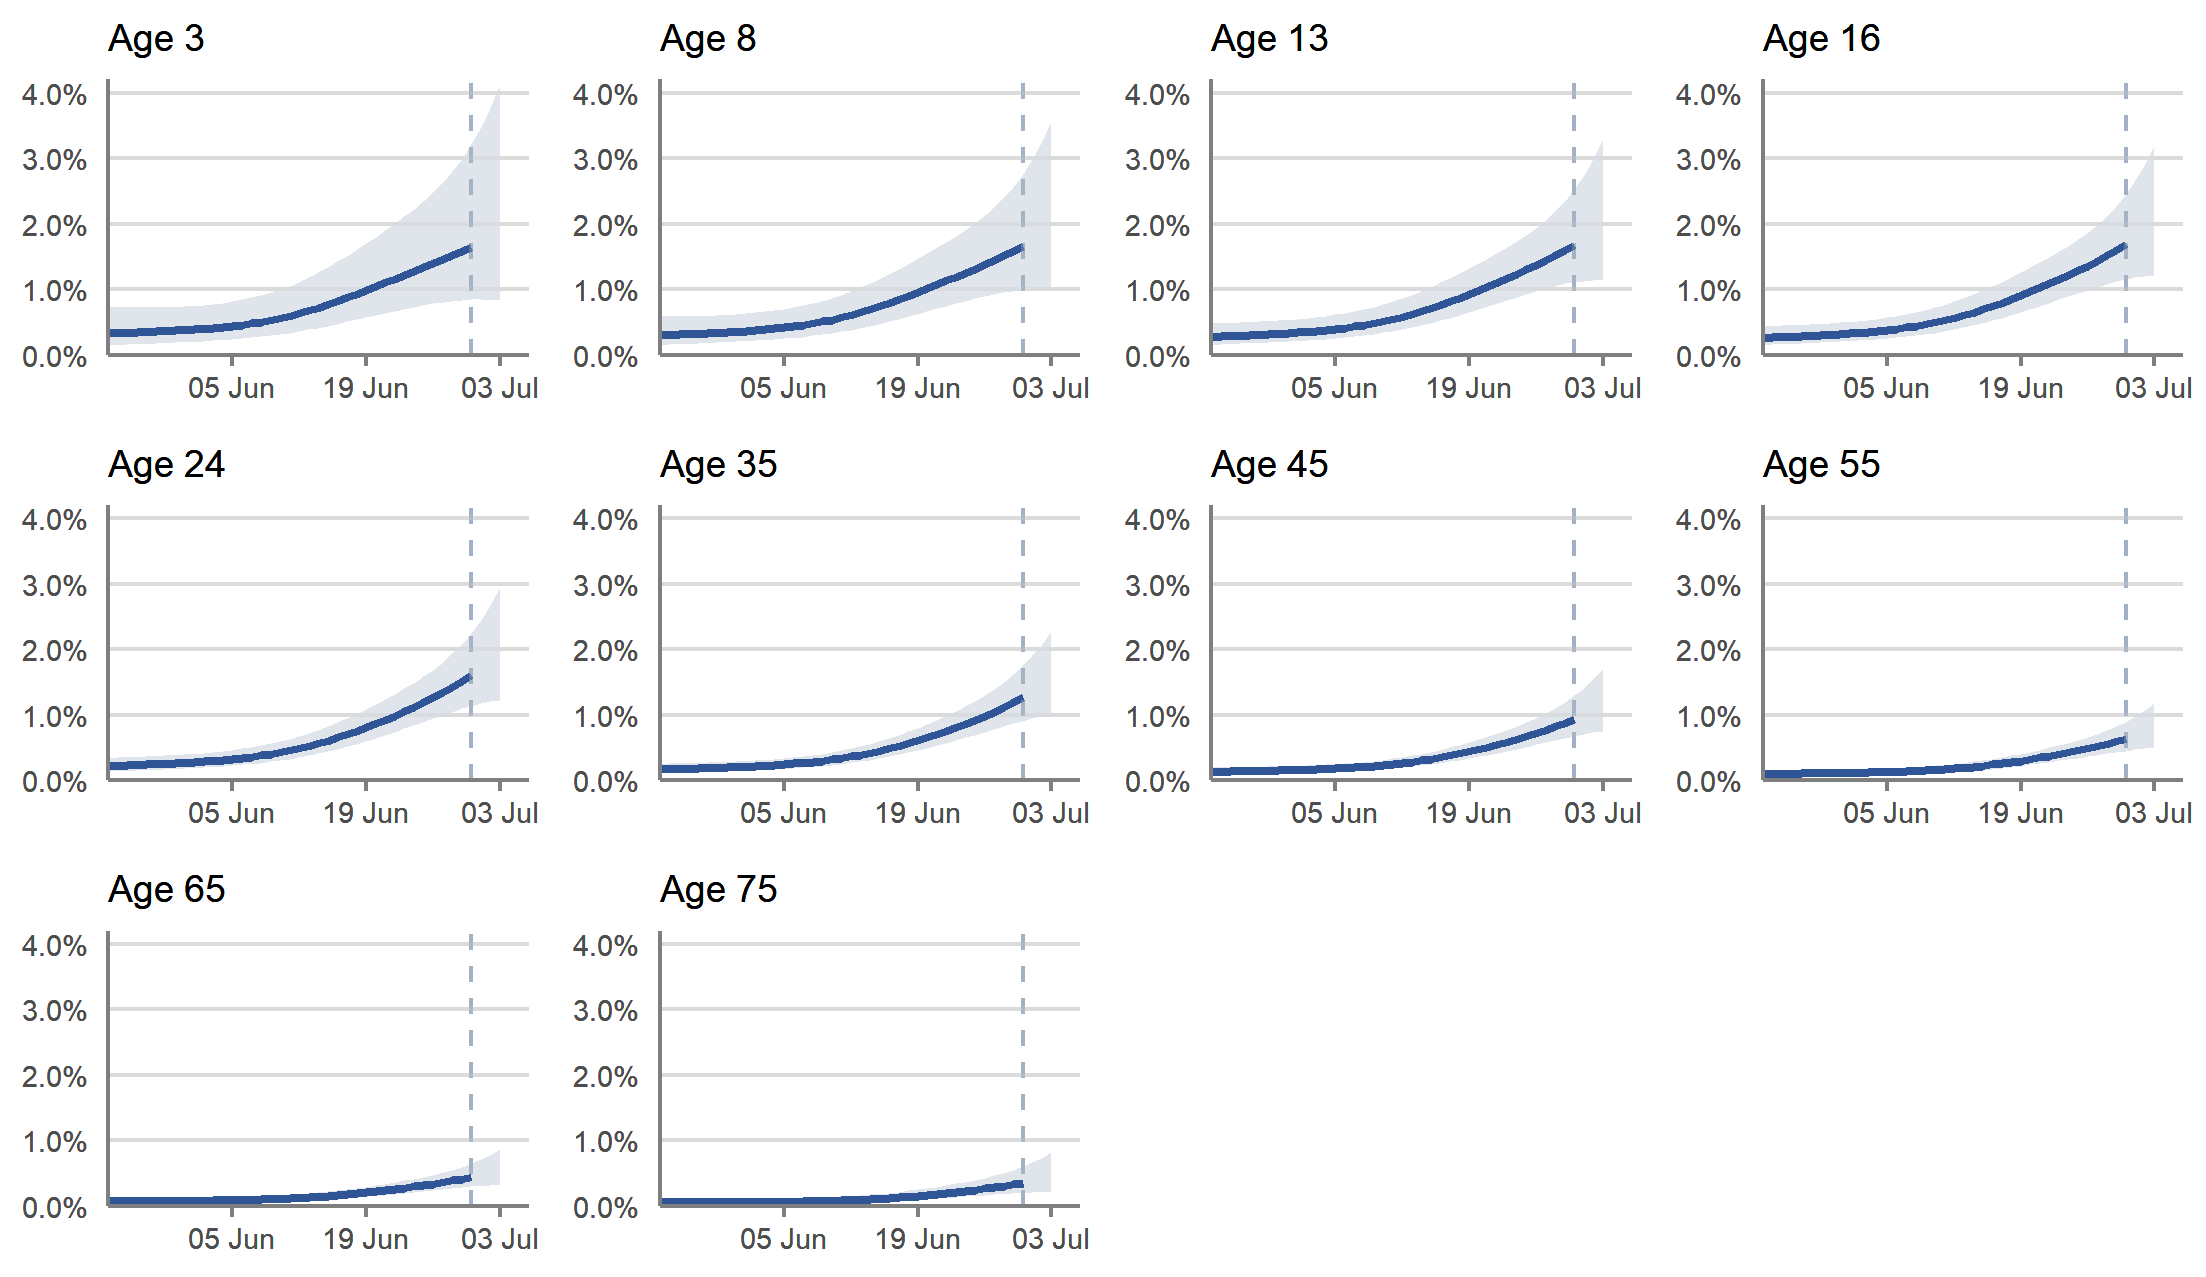
Figure 3 shows the percentage of people testing positive for COVID-19 by reference age, between 23 May and 3 July 2021. These estimates are based on modelled daily estimates of the percentage of the population testing positive for COVID-19 in Scotland by single year of age which are available in an accompanying dataset on the ONS website.
The proportion of people testing positive is higher in the younger age groups. In the most recent week, the proportion of people testing positive in the community population in Scotland has continued to increase for all ages, although uncertainty is high for some ages.
Caution should be taken in over-interpreting small movements in the latest trend. As the percentage of people testing positive decreases, the positivity estimates by single year of age are subject to increased uncertainty as captured in the confidence intervals.
Figure 3: Modelled daily estimates of the percentage of the population in Scotland testing positive for COVID-19, by reference age, between 23 May and 3 July 2021, including 95% confidence intervals (see notes 2,5,6,8)
Modelled estimate of the proportion of the community population testing positive for COVID-19 in each of the four nations of the UK
In Scotland, England and Wales, the percentage of people testing positive in the community has continued to increase in the most recent week (27 June to 3 July 2021). In Northern Ireland, the percentage testing positive in the community has increased in the most recent week.
Figure 4: Modelled daily estimates of the percentage of the community population testing positive for COVID-19 in each of the four nations of the UK, between 23 May and 3 July 2021, including 95% credible intervals (see notes 2,3,4,5,6)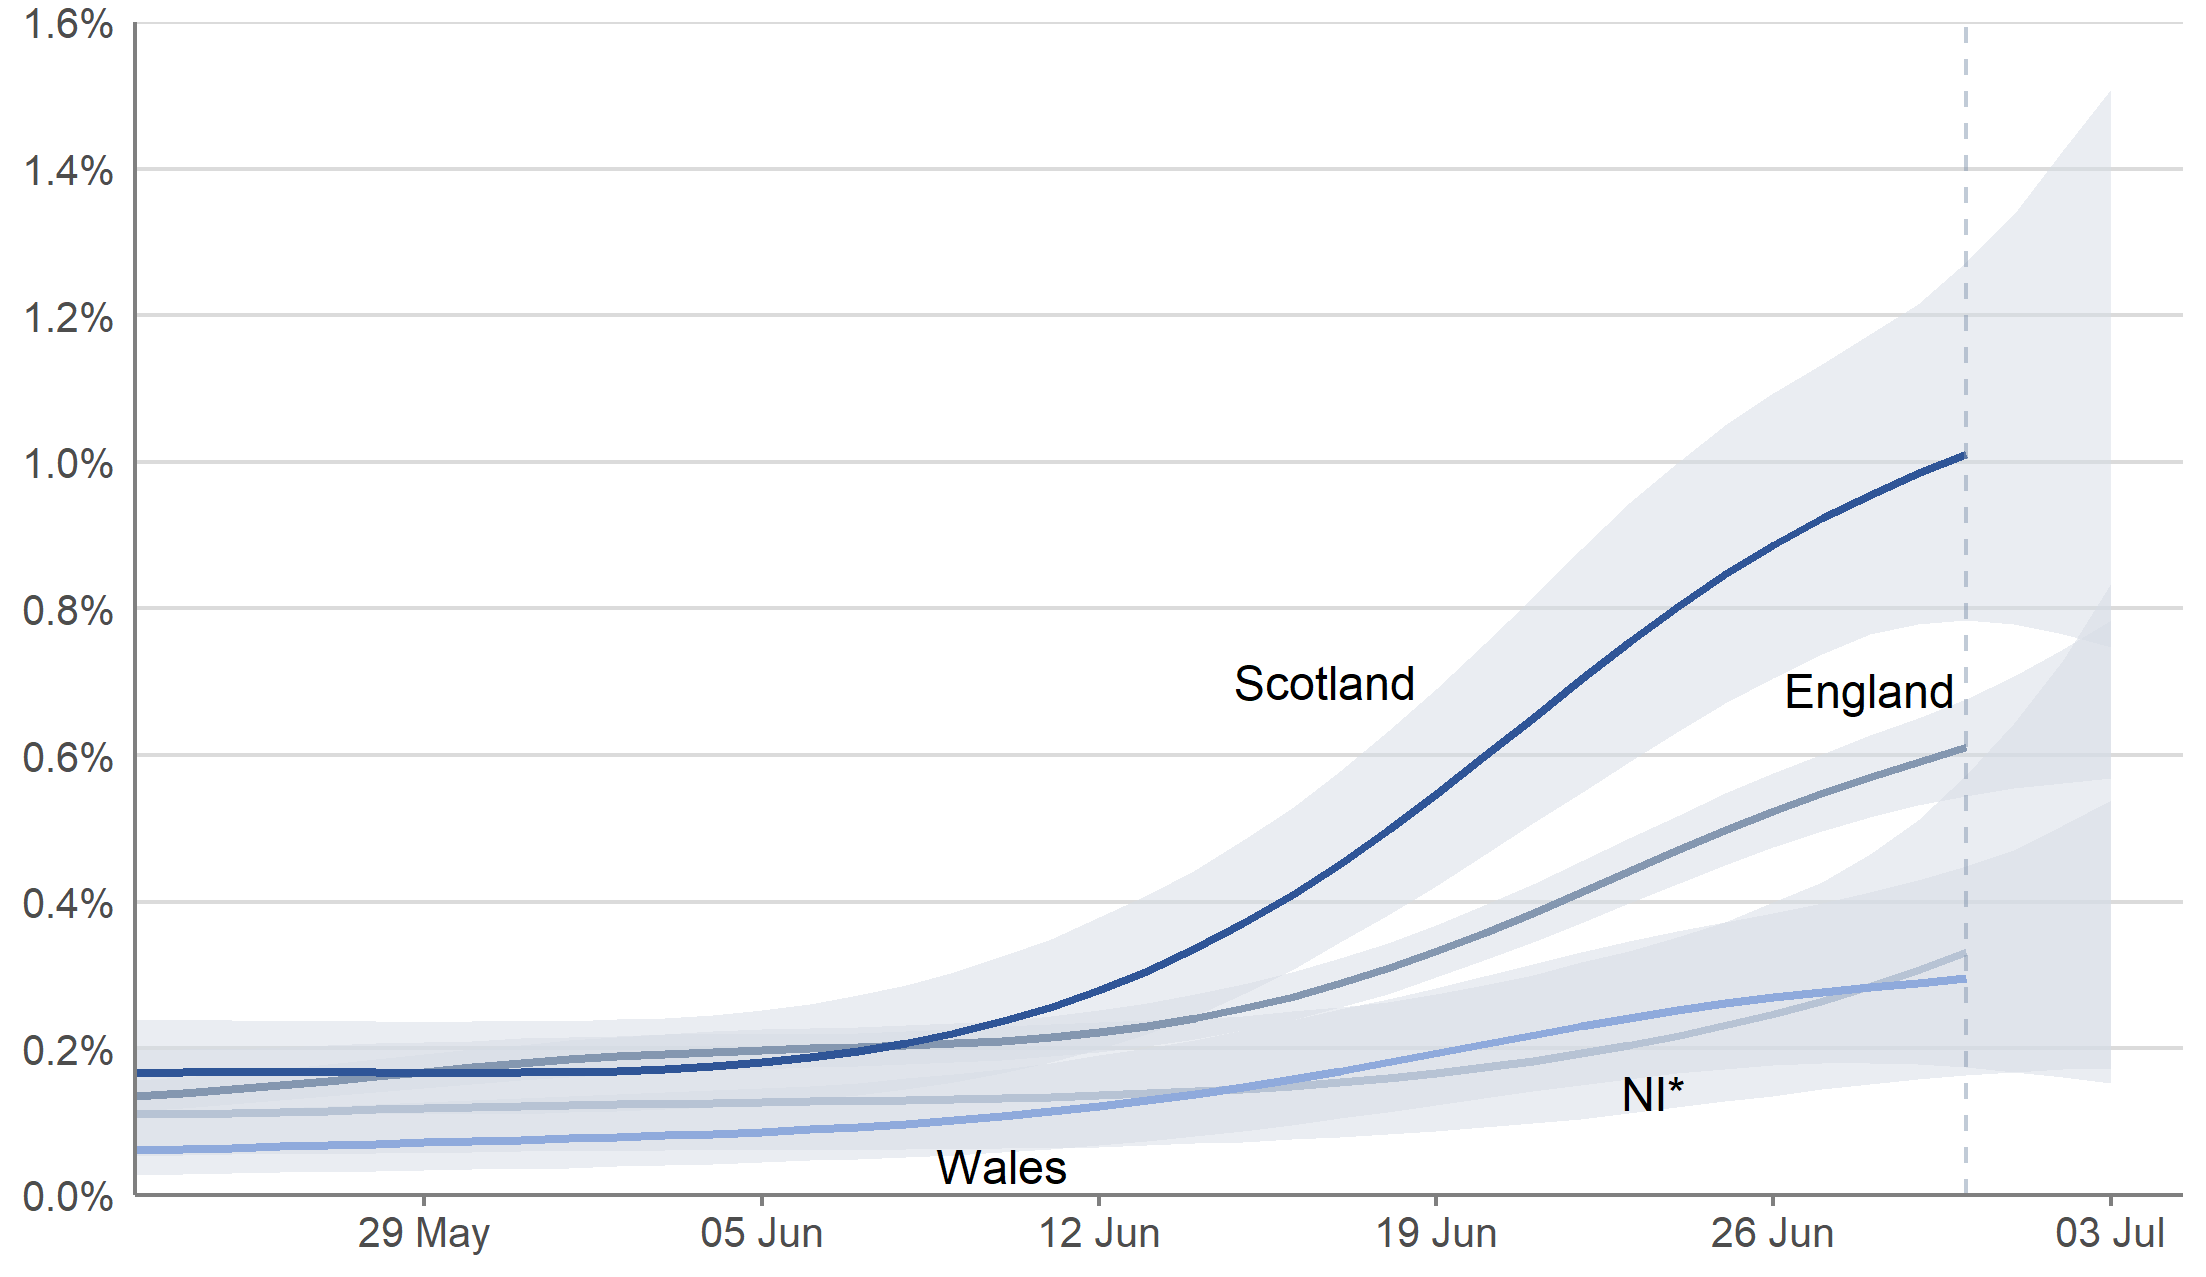
Table 1: Modelled estimates of the proportion of the community population testing positive for COVID-19, and corresponding 95% credible intervals, between 27 June to 3 July 2021 for the four nations of the UK (See notes 1,3,4,5)
| Nation |
Estimated percentage of the population that had COVID-19 |
Estimated number of people who had COVID-19 |
Estimated ratio of people who had COVID-19 |
| England |
0.61% (0.54% to 0.68%) |
332,900 (296,700 to 368,700) |
1 in 160 (1 in 180 to 1 in 150) |
| Northern Ireland |
0.33% (0.16% to 0.57%) |
6,100 (3,000 to 10,500) |
1 in 300 (1 in 610 to 1 in 170) |
| Scotland |
1.01% (0.78% to 1.27%) |
53,200 (41,300 to 67,000) |
1 in 100 (1 in 130 to 1 in 80) |
| Wales |
0.30% (0.17% to 0.45%) |
9,000 (5,300 to 13,600) |
1 in 340 (1 in 570 to 1 in 220) |
Number of new COVID-19 infections in Scotland
ONS have re-introduced estimates of incidence, a measure of new polymerase chain reaction (PCR)-positive cases in a given time period. This gives the rate at which new positives occur, and subsequently become detectable, within the population. Estimates for incidence for Scotland were last published on 7 May 2021.
Following review, ONS have changed the reference date used for the official estimates of incidence to 14 days prior to the positivity reference date (30 June 2021), with credible intervals provided until 7 days after the incidence reference date. Previously, the incidence reference date was 10 days prior to the end of the positivity reference date. This change was made as estimates later than this date are more likely to change as additional data is received. Therefore there is a time lag of 2 weeks between the incidence estimate and the positivity estimate. The incidence reference date used in this publication is 16 June 2021, relating to the week 13 to 19 June.
These estimates can be volatile and subject to change as more data become available. This is particularly the case with the most recent estimates so it is important to be cautious when using them. When incidence is low, it may not be possible to produce a reliable estimate. In these instances, ONS recommend focussing on the upper credible interval, which gives an upper bound to the incidence of new infections. For more information on how estimates of incidence are calculated, please see COVID-19 Infection Survey: methods and further information.
In Scotland, during the week 13 to 19 June 2021, it is estimated that there were 5.53 new PCR-positive COVID-19 cases per 10,000 people per day (95% credible interval: 4.15 to 7.30). This equates to 2,900 new positive cases in Scotland per day (95% credible interval: 2,200 to 3,800). Incidence of new PCR positive COVID-19 cases increased in the week ending 19 June 2021.
Modelled daily estimates of incidence rates, and accompanying credible intervals, are represented in Figure 5 by the blue line and grey shading. The model smooths the series to understand the trend and will be revised to incorporate new test results. Modelled daily estimates are used to calculate the official reported/indicative estimate.
Official reported/indicative estimates of incidence rates, are based on the modelled estimate for the midpoint of the week. Indicative estimates are denoted by pale blue circles, while the official estimates are denoted by dark blue circles, in Figure 5 and 6. Indicative estimates are presented on the official estimates charts, but were not previously published.
Figure 5: Modelled daily estimates and official reported/indicative estimates of incidence rates in Scotland between 13 May and 19 June 2021, including 95% credible intervals (see notes 2,4,5,6,9)
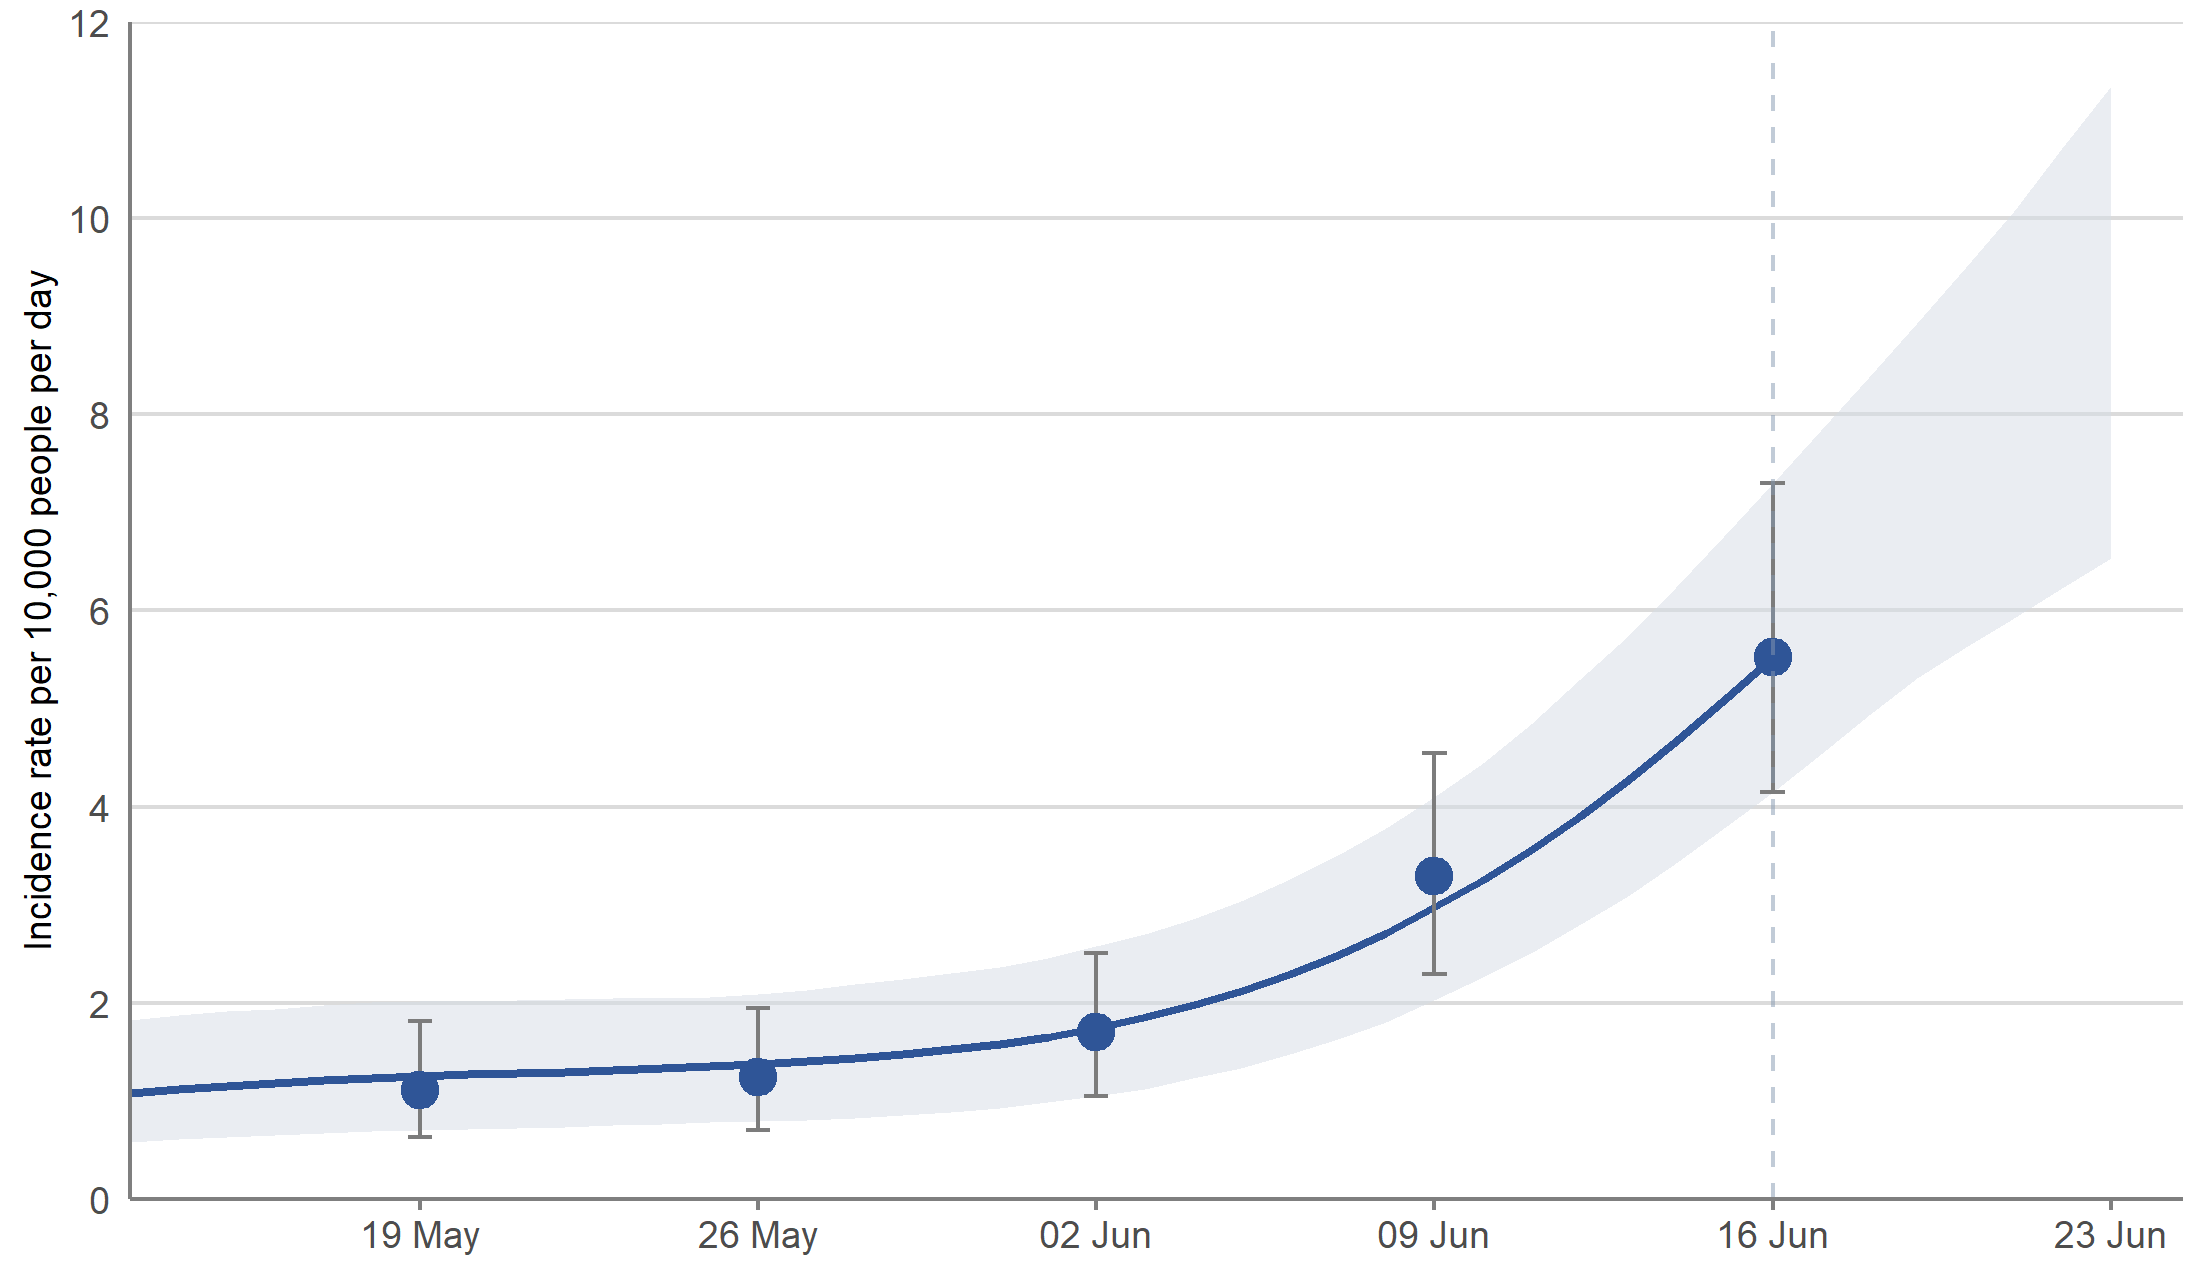 Figure 6: Official reported/indicative estimates of incidence rates in Scotland between 25 October 2020 and 19 June 2021, including 95% credible intervals (see notes 4,5,6)
Estimated percentages of those testing positive for COVID-19 by variant
The World Health Organisation (WHO) have suggested new names for Variants of Concern and Variants of Interest to assist with public discussions of the variants, which can be found as a table on the WHO website.
The Alpha variant (B.1.1.7) of COVID-19 has changes in one of the three genes that COVID-19 swab tests detect, known as the S-gene. This means in cases compatible with the Alpha variant, the S-gene is not detected by the current test and has the pattern ORF1ab+N (S gene negative) in the main variant analysis.
Other variants of concern – including both the Delta variant (B.1.617.2) and the Beta variant (B.1.351) – are positive on all three genes, with the pattern ORF1ab+S+N. Based on recent information from genomic sequencing and national testing programmes, ONS state that it is likely that most ORF1ab+S+N cases in the UK will be the Delta variant. Therefore, if there is an increase in the prevalence the Delta strain, this will show up in the analysis as an increase in cases “Compatible with the Delta variant”.
This main variant analysis can therefore differentiate between these two groups of variants (ORF1ab+N positive or ORF1ab+S+N positive), but cannot differentiate between variants that have the same gene pattern for the three genes that COVID-19 swab tests detect. More information on individual variants and where they were first detected is available on the government variant dashboard.
Other variants, including the Eta variant (B.1.525), may also have the same pattern of gene positivity as the Alpha variant. At present these are rare in the UK so this group will continue to be described as compatible with the Alpha variant, but ONS will continue to keep this under review. You can read more about the UK variant in the blog published by ONS.
In the week ending 3 July 2021, the trend in the percentage of people in the community testing positive whose results are compatible with the Delta variant (B.1.617.2) continued to increase in Scotland, England and Wales and started to increase in Northern Ireland.
In same week, the trend in percentage of people in the community population testing positive whose results are compatible with the Alpha variant (B.1.1.7) is uncertain in Scotland and Northern Ireland and remain low in England and Wales.
Figure 7: Estimated percentage of the population testing positive that are compatible with Delta variant, compatible with the Alpha variant, and other ‘not identifiable’ positive cases, in Scotland between 23 May and 3 July 2021 (see notes 2,4,5)
*Alpha variant compatible positives are defined as those that are positive on the N-gene and ORF1ab-gene, but not the S-gene.
**Delta variant compatible positives are defined as those that are positive on the S-gene, N-gene and ORF1ab-gene.
***Positives where levels of the virus in the sample are too low for the variant to be identifiable are defined as those that are positive with all other gene patterns. These definitions apply regardless of cycle threshold (Ct) value.
Variant data will continue to be published in the accompanying reference tables on the ONS website.
Whole genome sequencing is undertaken on positive tests from the survey, where possible. In the UK in the most recent four weeks, up to the week ending 27 June 2021, the majority (92%) of sequences obtained were Delta (B.1.617.2) with Alpha (B.1.1.7) comprising most of the remainder (7%).
This analysis was produced by research partners at the University of Oxford.
Further information
The latest estimate of the proportion of community population aged 16 and over in Scotland who would have tested positive for COVID-19 antibodies was published on 7 July 2021 on the Scottish Government website and ONS website.
An article on the prevalence of ongoing symptoms following coronavirus (COVID-19) infection in the UK was published on the ONS website on 1 July 2021. The article includes estimates of the prevalence of self-reported "long COVID", and the duration of ongoing symptoms following confirmed coronavirus infection, using UK Coronavirus (COVID-19) Infection Survey data to 6 June 2021.
An article on how often individuals are reporting social contact with other people outside their own household, either socially distanced or physical contact was published on 30 June 2021 on the Scottish Government website and ONS website.
An article on the symptom profile of strong positive cases in the UK was also published on 30 June 2021. The article includes estimates of the percentage of people testing positive that reported symptoms and the likelihood of reporting specific symptoms by nation. Analysis for Scotland was last published on the Scottish Government website on 5 May 2021. The article on the ONS website also includes analysis on the likelihood of testing positive for COVID-19 by patient-facing or non-patient facing job roles.
A technical article on positivity after vaccination (UK) was published on 17 June on the ONS website.
How this data can be used
The data can be used for:
-
estimating the number of current positive cases in the community, including cases where people do not report having any symptoms
- estimating the number of new cases and change over time in positive cases
The data cannot be used for:
- measuring the number of cases and infections in care homes, hospitals and other institutional settings
- estimating the number of positive cases and new infections in smaller geographies, such as towns and cities
- providing information about recovery time of those infected
Methodology
The results are based on nose and throat swabs provided by participants to the study, obtained from fieldwork which started in Scotland on 21 September 2020.
The results are for private households only, and do not apply to those in hospitals, care homes or other institutional settings. The population used in this analysis relates to the community population aged two years and over.
In the latest six-week period, there were 53,691 swab tests from 31,421 people, with a total of 172 positive tests in 163 people from 138 households. In the latest two-week period, there were 14,808 swab tests from 13,725 people, with a total of 98 positive tests in 93 people from 81 households.
The COVID-19 Infection Survey bulletins and datasets available on the ONS website also include results for England, Wales and Northern Ireland.
The Welsh Government and the Department of Health in Northern Ireland also publish results from the COVID-19 Infection Survey for Wales and Northern Ireland respectively:
Further details on the methodology used can be found on the ONS website.
Notes
- Any ratios presented are rounded to the nearest 10. These ratios do not represent a person's risk of becoming infected, since risk of infection depends on a number of factors such as contact with others or whether a person has been vaccinated.
- There is more uncertainty around estimates for the latest three reported days (as shown by the vertical dashed line), as lab results for this period are still being processed at the time of publication. Additional swab tests that become available after this publication are included in subsequent models, meaning that modelled estimates can change as additional data is included.
- Modelled estimates are not directly comparable with the 14-day weighted estimates provided in the accompanying dataset on the ONS website. The 14-day weighted estimates underpin the modelled estimates and are provided for context. 14-day weighted estimates are not directly comparable with the weekly modelled estimates due to the differing methodology, however they have been included in Figure 2 as they were reported as the official estimates for Scotland before the weekly modelled estimates became available.
- The model used to provide these estimates is a Bayesian model: these provide 95% credible intervals. A credible interval gives an indication of the uncertainty of an estimate from data analysis. 95% credible intervals are calculated so that there is a 95% probability of the true value lying in the interval. A confidence interval gives an indication of the degree of uncertainty of an estimate, showing the precision of a sample estimate.
- Because of the relatively small number of tests and a low number of positives in the sample, credible intervals are wide and therefore results should be interpreted with caution.
- The blue line and shading represent the modelled trend and credible intervals based on the latest data. The point estimates and error bars represent the official weekly estimates and their credible intervals, which are based on the modelled estimate for the midpoint of the week at the time of publication.
- As there was no publication on 15 January 2021 there are no official estimates available for the week ending 9 January 2021. However, ONS conducted some additional analysis to assess what the estimate may have been, therefore this estimate is included in Figure 2, shown in light grey.
- A confidence interval gives an indication of the degree of uncertainty of an estimate, showing the precision of a sample estimate. The 95% confidence intervals are calculated so that if we repeated the study many times, 95% of the time the true unknown value would lie between the lower and upper confidence limits. A wider interval indicates more uncertainty in the estimate.
There is more uncertainty around incidence estimates for the latest seven reported days (as shown by the vertical dashed line), as modelled estimates can change as additional data is included.