Coronavirus (COVID-19): modelling the epidemic (issue no.98)
Latest findings in modelling the COVID-19 epidemic in Scotland, both in terms of the spread of the disease through the population (epidemiological modelling) and of the demands it will place on the system, for example in terms of health care requirement.
Coronavirus (Covid-19): modelling the epidemic in Scotland (Issue No. 98)
Background
This is a report on the Scottish Government modelling of the spread and level of Covid-19 in Scotland. This updates the previous publication on modelling of Covid-19 in Scotland published on 14th April 2022. The estimates in this document help the Scottish Government, the health service and the wider public sector plan and put into place what is needed to keep us safe and treat people who have the virus.
This edition of the research findings focuses on the epidemic as a whole, looking at estimates of R, growth rate and incidence as well as local measures of change in the epidemic.
Key Points
- The reproduction rate R in Scotland is currently estimated as being between 0.8 and 1.0, as at 12th April. The lower and upper limits are unchanged since last publication.
- The daily growth rate for Scotland is currently estimated as between ‑5% and -1% as at 12th April. The lower and upper limits have both decreased since last publication.
- The number of new daily infections for Scotland is estimated as being between 191 and 569 as at 12th April, per 100,000 people.
- Average contacts from the most recent Panel A cohort of the Scottish Contact Survey (week ending 20th April) indicate an average of 5.3 contacts. This has increased by 9% compared to the previous Panel A of the survey (week ending 6th April).
- Mean contacts within the home and other setting (contacts outside home, school and work) have increased in the last two weeks by 10% and 43% respectively. Contacts within the work setting have decreased by 17% over the same period.
- The youngest (18-29) and oldest (70+) age groups have reported an increase in contacts within the last two weeks, by at least 54%. Those within the remaining age groups have decreased their contacts in the last two weeks, with those aged 30-39 decreasing the most, by 40%.
- The highest number of mean interactions are between those aged 18-29 with each other. The biggest increase in interactions is between those within the 18-29 age group and those 70 and over.
- Visits to an non-essential shop have shown the biggest increase, increasing from approximately 44% to 49%. The biggest decrease has been in individuals visiting a healthcare facility, decreasing from 22% to 17% in the last two weeks.
- The number of people wearing a face covering where they have at least one contact outside of the home has not changed in the last two weeks at a current level of 81% (week ending 20th April).
- Approximately 68% of individuals had taken at least one lateral flow test within the last 7 days for the survey pertaining to the 14th April - 20th April, decreasing from 77% two weeks prior.
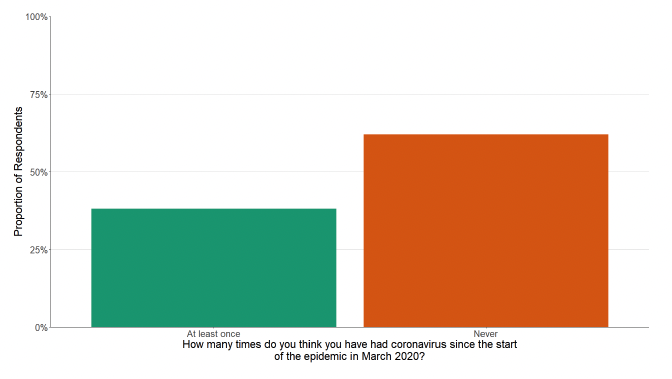
- Approximately 38% of individuals believe they have had Covid-19 at least once since March 2020. Of those who think they have had Covid-19, 91% have had this confirmed through a test
- Analysis by the Edinburgh University Roslin Institute indicates that there remains a substantial variation in geographical risk of infection when considering the average recorded census age and booster vaccination uptake.
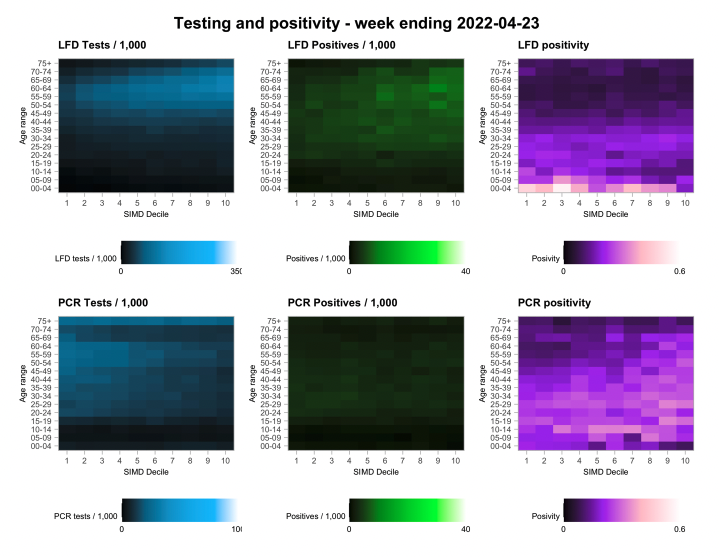
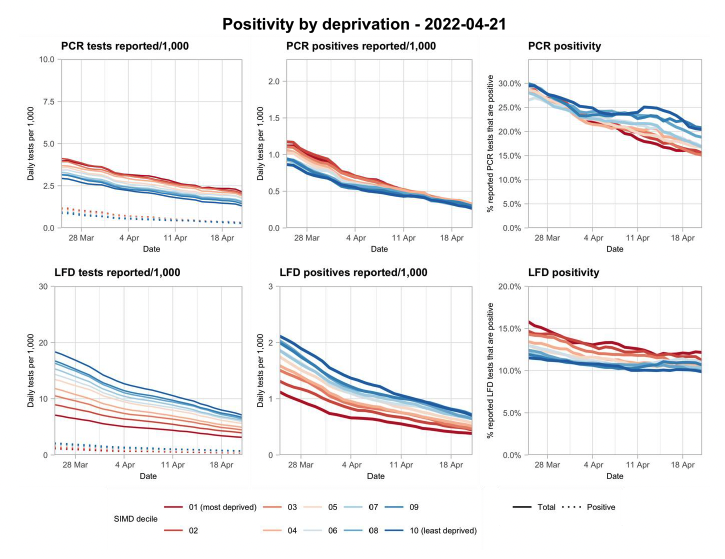
- Rates of LFD and PCR testing are falling across all ages and deprivation deciles. PCR positivity is stabilising, whereas LFD positivity is slightly falling.
- The distribution of lateral flow/LFD tests being reported continues to vary substantially by both age and deprivation status, with many fewer tests reported in younger adults across all deciles of deprivation, and for children in more deprived deciles. The high level of LFD positivity in the latter category is marked, and when compared to the high number of positives amongst the least deprived, consistent with under ascertainment being concentrated in particular groups.
- Nationwide, wastewater Covid-19 levels have overall reduced in the last two weeks. The week ending 26th April saw levels of around 130 million gene copies per person per day (Mgc/p/d), a slight rise compared to 116 Mgc/p/d the previous week (week ending 19th April) and 220 Mgc/p/d the week before (week ending 12th April).
Overview of Scottish Government Modelling
Modelling outputs are provided here on the current epidemic in Scotland as a whole, based on a range of methods. Because it takes a little over three weeks on average for a person who catches SARS-CoV-2 the causative agent of Covid-19 to show symptoms, become sick, and either die or recover, there is a time lag in what our model can tell us about any change in the epidemic.
The Scottish Government presents outputs from two models (Epidemia and Covasim) to the Epidemiology Modelling Review Group (EMRG), both using wastewater derived data. These outputs are included in Figure 1.
The R value and growth rates are also estimated by several independent modelling groups based in universities and the UKHSA. Estimates are considered, discussed and combined at EMRG, which sits within the UKHSA. These are based on data to 25th April.
The consensus view of the UKHSA across these methods was that the value of R in Scotland is between 0.8 and 1.0, as of 12th April 2022[1] (Figure 1). The lower and upper limits are both unchanged since last publication. R is an indicator that lags by two to three weeks.
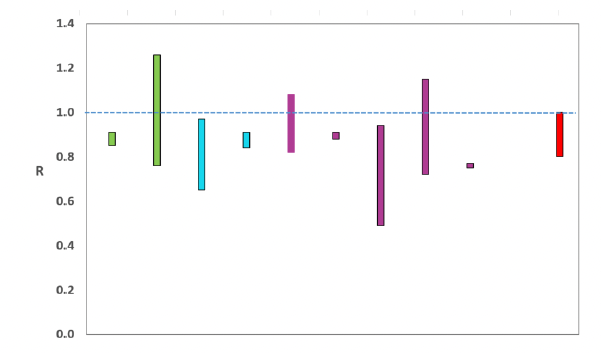
Source: EMRG
The consensus from UKHSA for this week is that the growth rate in Scotland is between -5% and -1% per day as at 12th April. The lower and upper limits have decreased since last publication.
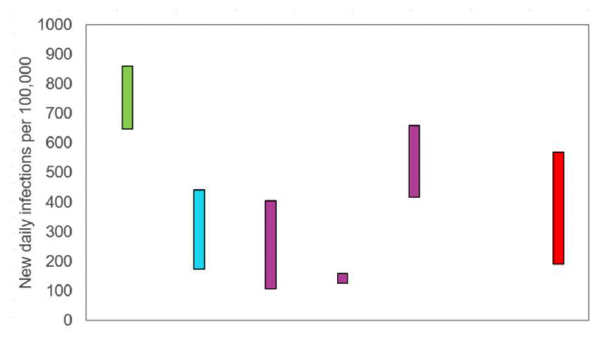
The various groups which report to the EMRG use different sources of data in their models to produce estimates of incidence (Figure 2). The consensus view of the UKHSA across these methods, as at 12th April, was that the incidence of new daily infections in Scotland was between 191 and 569 new infections per 100,000. This equates to between 10,400 and 31,100 people becoming infected each day in Scotland.
What we know about how people's contact patterns have changed
Following the change in publication frequency to fortnightly, panels A and B of the Scottish Contact Survey have been merged and surveys will now be run fortnightly. There will be a short transition period where only Panel A survey results will be presented. Analysis of the merged panels will be reported in a future report accompanied by a note in the Technical Annex to explain the changes.
Average contacts from the most recent Panel A cohort of the Scottish Contact Survey (week ending 20th April) indicate an average of 5.3 contacts. This has increased by 9% compared to the previous Panel A of the survey (week ending 6th April), as seen in Figure 3.
Mean contacts within the home and other setting (contacts outside home, school and work) have increased in the last two weeks by 10% and 43% respectively. Contacts within the work setting have decreased by 17% over the same period.
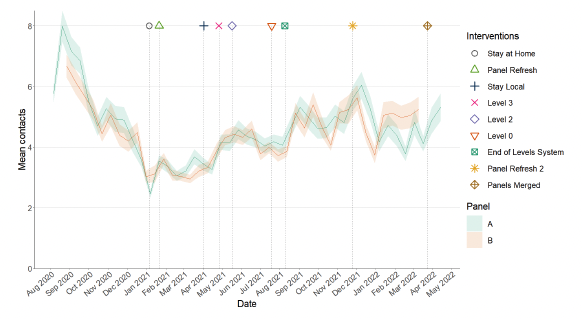
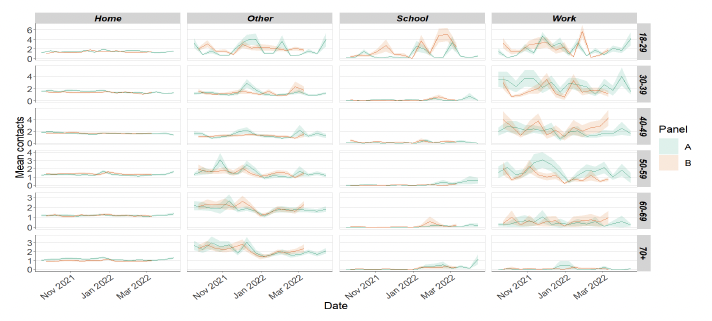
Figure 4 shows how contacts change across age group and setting. The youngest (18-29) and oldest (70+) age groups have reported an increase in contacts within the last two weeks, by at least 54%. Those within the remaining age groups have decreased their contacts in the last two weeks, with those aged 30-39 decreasing the most, by 40%.
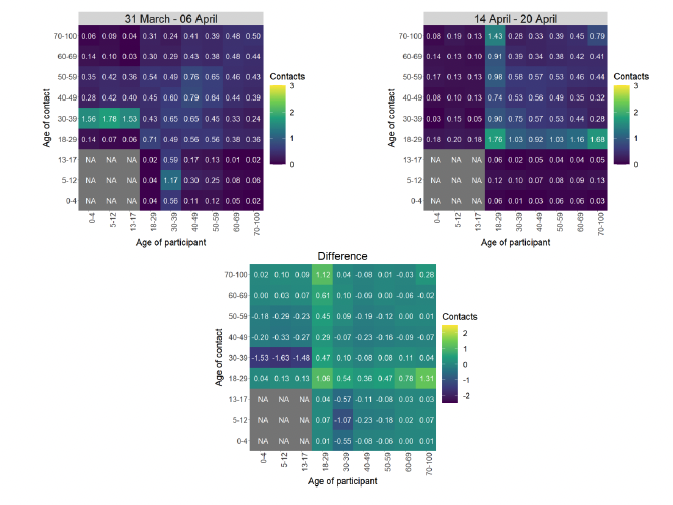
The heatmaps in Figure 5 show the mean overall contacts between age groups for the weeks relating to 31st March - 6th April and 14th April - 20th April and the difference between these periods. The highest number of mean interactions are between those aged 18-29 with each other. The biggest increase in interactions is between those within the 18-29 age group and those 70 and over.
The biggest changes in the proportion of participants visiting different locations is seen in those visiting an non-essential shop and individuals visiting a healthcare facility. Visits to an non-essential shop have shown the biggest increase, increasing from approximately 44% to 49%. The biggest decrease has been in individuals visiting a healthcare facility, decreasing from 22% to 17% in the last two weeks as shown in Figure 6.
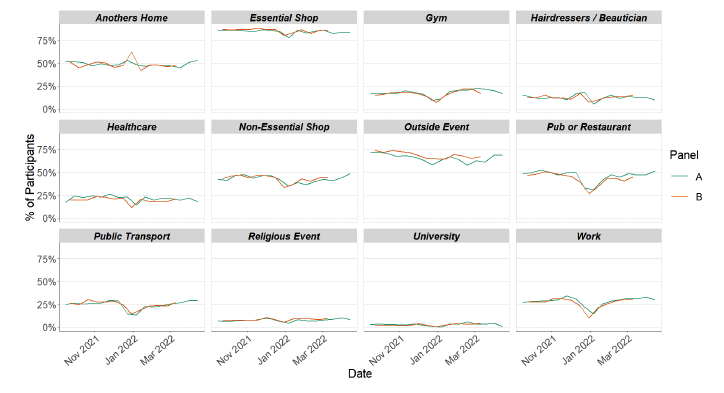
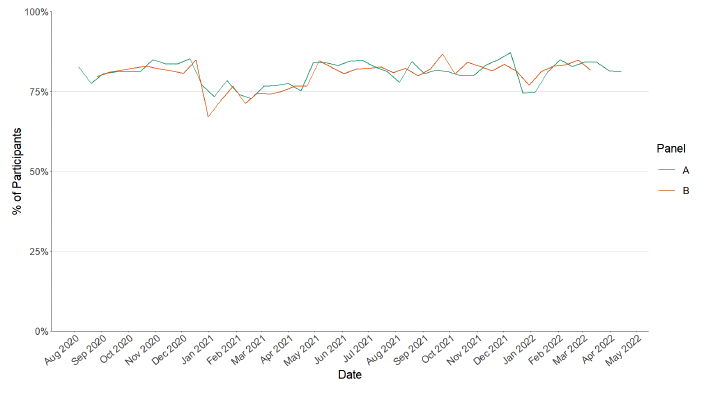
Figure 7 shows the number of people wearing a face covering where they have at least one contact outside of the home. This has not changed in the last two weeks at a current level of 81%.
Approximately 68% of individuals had taken at least one lateral flow test within the last 7 days for the survey pertaining to the 14th April - 20th April, decreasing from 77% two weeks prior as shown in Figure 8.
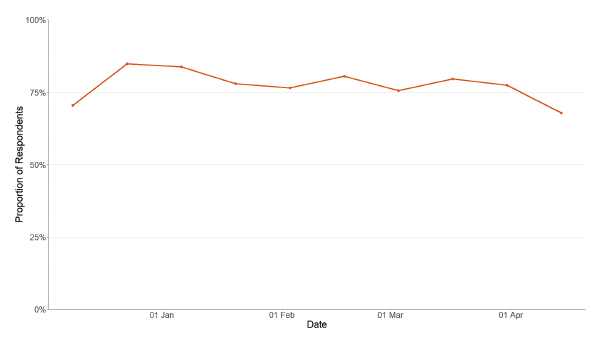
Figure 9 shows that approximately 38% of individuals believe they have had Covid-19 at least once since March 2020. Of those who think they have had Covid-19, 91% have had this confirmed through a test.
What the modelling tells us about estimated infections and hospitalisations
The Scottish Government assesses the potential impact of Covid-19 on the NHS in the next few weeks. Figures 10 - 12 show projections over four weeks.
These projections include the effect of vaccines rolled out so far and projected future vaccine rollout including the rollout of fourth doses. Current vaccine effectiveness within the modelling is derived from Public Health England's most recent vaccine surveillance report[3]. This report provides an indication of the initial effectiveness of the different vaccine products used within Scotland and how this effectiveness reduces over time since the vaccination was administered. Initial effectiveness of natural immunity is assumed to be halfway between initial effectiveness of Moderna and 100%[4] and wanes to 67% after 1-2 years[5].
'Central' assumes that transmissibility remains at current levels. This transmissibility is estimated by calculating the current rates of transmission based on the most recent available incidence data from our wastewater Epidemia modelling (as shown in Figure 2) and then projecting this forward at similar levels over the coming weeks. 'Worse' assumes a higher transmissibility, whereas 'Better' assumes a lower transmissibility.
These projections include the changes to restrictions announced on 13th April on the end of the legal requirement for wearing face masks. The changes to restrictions are assumed to result in people's behaviour gradually returning towards pre-pandemic levels over the coming weeks and months; as the impact of this becomes clearer we will revise the modelling. From these transmissibility assumptions we produce the infections curves shown in Figure 10. Changes in transmissibility represent changes in behaviour. The lower transmissibility in 'Better' assumes people behave more cautiously than they do at the moment, while the higher transmissibility in 'Worse' assumes people behave less cautiously. Assumptions around hospitalisation/ICU rates by age and vaccination status and then applying some assumptions around length of stay as derived by matching the numbers calculated from infections to current data are then used to estimate the occupancy for hospital and ICU as shown in Figures 11 and 12 respectively.
These projections using wastewater derived data to 18th April were within the UKHSA consensus estimates for medium term projections. Hence these represent our best estimate of the future trajectory of Covid-19 in Scotland.
The future trajectory of infections is uncertain especially given the change in the methodology to use wastewater Epidemia as the data source for estimating infections.
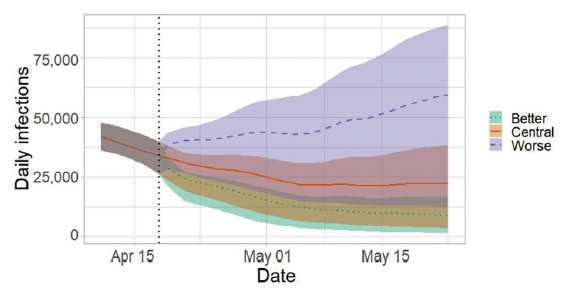
We estimate that daily infections may be up to 88,000 in mid-May.
Figure 11 shows the impact of the projections on the number of people in hospital. The modelling includes all hospital stays, whereas the actuals only include stays up to 28 days duration that are linked to Covid-19.
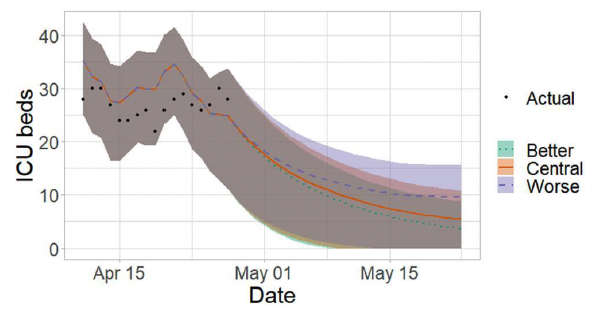
There continues to be uncertainty over hospital occupancy and intensive care in the next four weeks.
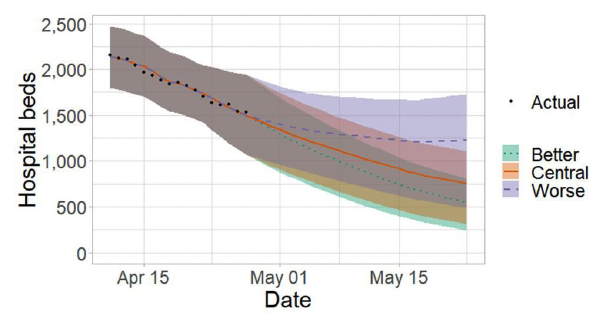
We estimate that hospital occupancy may be between 250 and 1,750 in mid-May.
Figure 12 shows the impact of the projection on ICU bed demand.
What the modelling tells us about projections of hospitalisations, occupancy and deaths in the medium term
SPI-M-O produces projections of the epidemic (Figures 13 - 15), combining estimates from several independent models. These projections are not forecasts or predictions. They represent a scenario in which the trajectory of the epidemic continues to follow the trends that were seen in the data available to 25th April and do not include the effects of any future policy or behavioural changes. The delay between infection, developing symptoms, the need for hospital care, and death means they cannot fully reflect the impact of behaviour changes in the two to three weeks prior to 25th April. The projections include the potential impact of vaccinations over the next few weeks. Modelling groups have used their expert judgement and evidence from UKHSA, Scottish Universities & Public Health Scotland, and other published efficacy studies when making assumptions about vaccine effectiveness.
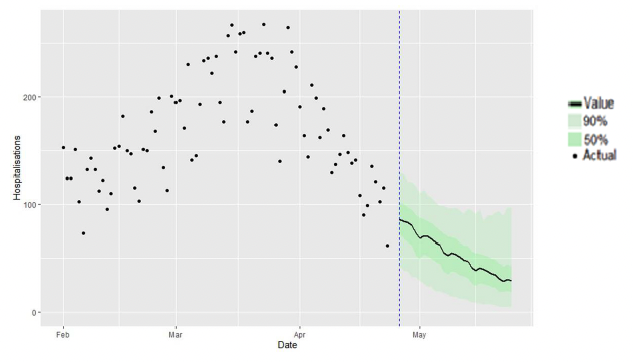
Figure 14 shows the SPI-M-O consensus on hospital occupancy. Hospital occupancy is determined by the combination of admissions and length of stay, the latter of which is difficult to model with confidence.
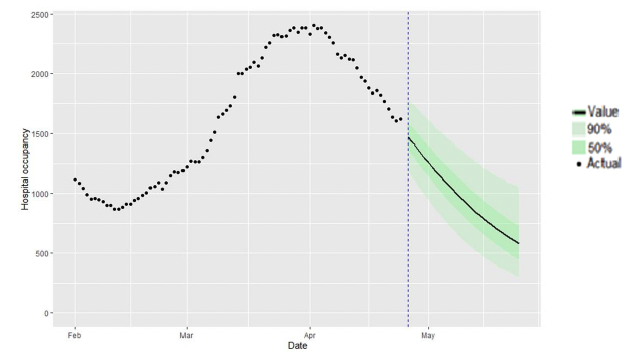
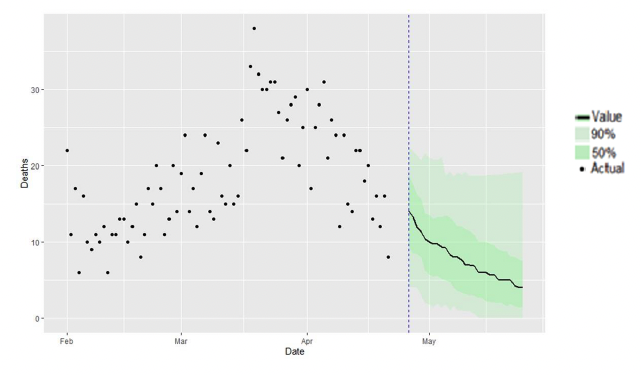
Figure 15 shows the SPI-M-O consensus on daily Covid-19 deaths.
Looking to the future
What may happen in the future around SARS-CoV-2 is uncertain and therefore there are a number of possible Covid-19 futures that may occur in the future. For example, the current Omicron wave may dissipate leaving low levels of Covid-19, or a new variant may emerge potentially having vaccine escape or increased severity, or people's behaviours may change. One approach to this uncertainty is to model alternative versions of the future through the development of different Covid-19 scenarios.
Given what we know about Covid-19 these possible futures range from a world where immunity reduces Covid-19 hospitalisations and deaths to low levels, through to variant world where a variant with immune escape enters Scotland and Covid-19 hospitalisations and deaths could increase. In between these two extremes there could be possible futures where people's behaviour becomes polarised between those who continue with Covid-19 precautions e.g. hand washing etc. and those who do not.
The scenarios we provide in the next section look at what could happen for planning purposes, not to forecast what will happen. These scenarios include all announced changes to restrictions. The assumptions are based on our most up to date knowledge, but do not include the effect of future changes in treatment of Covid-19 e.g. widespread use of antivirals or changes in behaviour in response to high levels of infections e.g. in variant world. Therefore, in the most extreme scenarios the peak may be lower than suggested if behaviour or restrictions changed.
There is no linear progression between the worlds and all are plausible. Each world inherently contains a different threat level requiring a different approach to management.
Given the fact that the modelling accounts for waning in all of the modelling as described in Issue 95 of this publication we have therefore removed Waning world from these future scenarios.
Immune World
In this possible future vaccines and natural immunity are effective at keeping Covid-19 at low levels. New variants may emerge in Scotland but for the foreseeable future infections are based around Omicron.
Infections may decrease from current levels over the coming weeks and months to very low levels. Likewise hospital and ICU occupancy may follow this trend relieving the pressure on healthcare services. Issues with new variants are not considered in this world and therefore levels of infections remain low. We assume that only a small change in behaviour occurs in response to the lifting of restrictions.
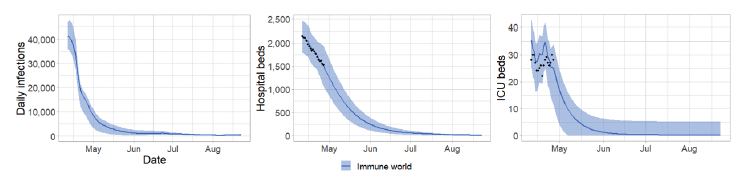
In Immune world Covid-19 in Scotland reduces below epidemic levels, becoming endemic. Cases of Covid-19 therefore spring up only as rare outbreaks which are controlled through public health measures. People's lives return to something close to normality e.g. physical distancing is not needed but people still choose to self-isolate and hygiene is good. As vaccines are effective, take-up of first/second/third doses are good and boosters become part of an annual cycle like flu. The numbers of people who need medical treatment or hospitalisation for Covid-19 remain low.
The focus moves away from Covid-19 response and into recovery. This includes addressing learning losses, treating Long Covid and working through the hospital backlog. Wellbeing measures improve with reduced anxiety and increased happiness. Those from the highest risk groups feel they can reintegrate without government interventions. The economy begins to recover from the effects of Covid-19. Travellers do not face significant issues with trips overseas.
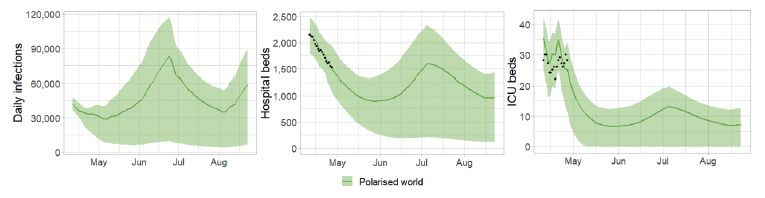
Polarised world
In this world, vaccines and natural immunity are effective at reducing infections. The approach followed relies on individual risk assessment and behaviours. However, society becomes polarised as some continue to take up vaccines and follow guidance while others are more reluctant. Covid-19 becomes a disease associated with those who do not or cannot get full vaccine benefit and do not or cannot adopt a risk based approach maintaining baseline measures.
Infections may remain at current levels initially before increasing with a decrease following thereafter as the natural immunity begins to offset the waning of vaccine acquired immunity.
This world assumes that behavioural changes beginning to occur in response to the lifting of restrictions and to the better weather.
Impacts on hospital/ICU occupancy are uncertain but levels may be higher than has been observed in summer 2020 and 2021 and higher than what may happen in Immune world (see Figure 21).
Cases of Covid-19 spring up and are hard to control in those who are not vaccinated or vulnerable. People's lives return to a "new normal" but, due to polarised groups in society with some following and some not following the guidance on baseline restrictions, infections remain.
Vaccines are effective so older and more vulnerable people come forward for future doses in high numbers.
The focus remains on Covid-19 and the shift onto recovery is slower. Existing learning losses are harder to rectify and continue to accrue due to infections within education settings. The hospital backlog is difficult to address as hospitals are still dealing with Covid-19 cases. The population becomes polarised in to those whose wellbeing improves e.g. lower risk people and those whose wellbeing deteriorates e.g. higher risk or poorer people whose levels of anxiety increase as Covid-19 circulates. They continue to experience greater illness, greater poverty or disruption to their income. The economy continues to be impacted from the effects of Covid-19.
Variant world – vaccine escape with same severity as Delta
In this possible future a variant with vaccine escape emerges in Scotland presenting a challenge even for fully vaccinated people. This new variant leads to increased transmission, but not to increased severity compared to previous variants. In this scenario other NPIs may need to be put in place for a short time. This world is similar to what has happened in Scotland with the emergence of Omicron.
Omicron may be reduced to low levels within Scotland as a new variant takes over. This causes a new wave of Covid-19 infections as well as increases in hospital and ICU occupancy. People's lives are disrupted due to the increasingly high levels of infections leading to time off work ill or isolating.
To show the potential impact assume a new variant appears in Scotland as people return from their summer holidays and return to work and school. The timing is uncertain and a potential new variant may appear sooner than the summer or significantly later but has currently been lined up with the summer holidays to show illustratively what could happen. The new variant may cause Omicron infections to decrease significantly or disappear entirely (and is not shown). The new variant is modelled with similar transmissibility and vaccine escape as Omicron with severity characteristics similar to Delta. It could lead to high levels of infections leading to hospital occupancy rising above capacity restrictions. With sustained high levels of infection we could again see increased staff absences in a number of sectors that were affected by this in the recent Omicron wave.
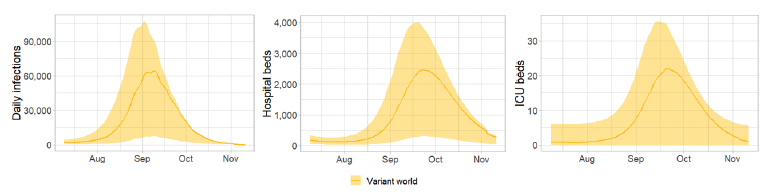
The focus remains on Covid-19 and it is hard to shift on to recovery. Continued infections within education settings and staff shortages make some school closures necessary. The Covid-19 strain on hospitals is high due to the very high numbers of infections and workforce pressures grow making it difficult to address the hospital backlog. Wellbeing measures deteriorate with people reporting low happiness and general 'tiredness with it all'. The economy continues to be impacted from the effects of Covid-19 with many people off work. Travellers may not want to come to the UK as the new variant sweeps through.
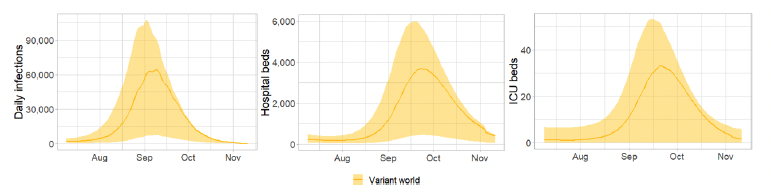
Variant world – vaccine escape with increased severity compared to Delta
As with the other example of Variant world, a new variant appears in Scotland as people return from their summer holidays and return to work and school. The timing is uncertain but has currently been lined up with the summer holidays where reduced travel restrictions may make it more likely that a new variant is brought into Scotland.
The new variant may cause Omicron infections to decrease significantly or disappear entirely (and this is not shown on the graph). It is modelled with similar transmissibility and vaccine escape as Omicron with severity characteristics 50% higher than Delta, purely for illustrative purposes.
It could lead to high levels of infections leading to hospital occupancy rising well above capacity restrictions. With sustained high levels of infection we could again see increased staff absences in a number of sectors that were affected by this in the recent Omicron wave.
Summary of spatial analysis of Covid-19 spread in Scotland
Researchers at the Edinburgh Roslin Institute have conducted spatial analysis of Covid-19 Spread in Scotland. A summary of findings from the week from 9th to 23rd April 2022 is included here. Risk factors indicate where the number of cases are higher than expected geographically (i.e. administrative data zones), but do not necessarily represent the risk to individuals in those areas.
Table 1 shows the outcome of a Negative binomial model of risk factors by data zone. eDRIS[6] data was taken on 25th April, covering the period from 9th to 23rd April.
| Risk factor | DZ Range (5%-95%) | % Change in cases from mean at 5% | % Change in cases from mean at 95% | |
|---|---|---|---|---|
| Log(population) | 6.22-7.0 | 66.8% | 146.4% | |
| Deprivation | SIMD score | 4.14 – 56.3 | 102.7% | 94.9% |
| SIMD housing | 1.17 – 63.7 | 99.59% | 101.0% | |
| SIMD access | 1.16 – 61.8 | 102.6% | 94.9% | |
| Vaccine uptake | % First vaccine uptake | 76.7 – 107.3 | 98.4% | 101.3% |
| % Second vaccine uptake | 93.5 – 97.2 | 95.5% | 103.5% | |
| % Booster uptake | 77.4 – 89.8 | 80.7% | 118.3% | |
| Mean age | 33.3 – 50.0 | 110.0% | 91.5% |
There remains a substantial variation in risk of infection by average census age in each datazone. Deprivation in this period is not a substantial factor when comparing across local authorities. Risk factors remain stable, when comparing to previous weeks.
The trend where numbers of PCR and LFD tests are both declining, continues across all deprivation scores, suggesting ascertainment is continuing to decrease.
The distribution of lateral flow/LFD tests being reported varies substantially by both age and deprivation status, with many fewer tests reported in younger adults across all deciles of deprivation, and for children in more deprived deciles. The high level of LFD positivity in the latter category is marked, and when compared to the high number of positives amongst the least deprived, suggests that ascertainment may be lower in younger people in deprived areas.
What can analysis of wastewater samples tell us about local outbreaks of Covid-19 infection?
Levels of SARS-CoV-2 RNA in wastewater (WW) collected at a number of sites around Scotland are adjusted for population and local changes in intake flow rate (or ammonia levels where flow is not available). See Technical Annex in Issue 34 of these Research Findings for the methodology. These reports are based on the most recent data available. Future updates to data may lead to small retrospective changes.
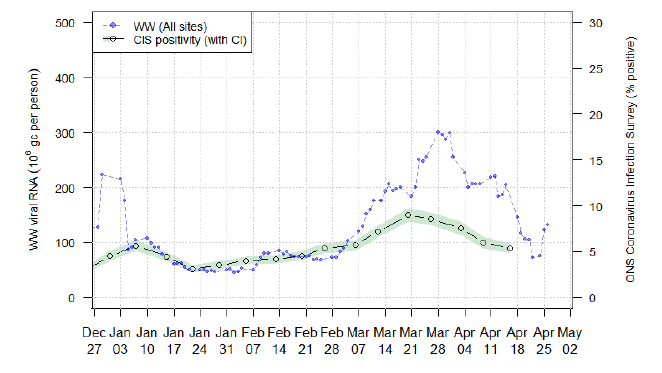
Nationwide, wastewater Covid-19 levels have overall reduced in the last two weeks. The week ending 26th April saw levels of around 130 million gene copies per person per day (Mgc/p/d), a slight rise compared to 116 Mgc/p/d the previous week (week ending 19th April) and 220 Mgc/p/d the week before (week ending 12th April).
In Figure 22, plotting covers the period from the start of 2022. The Omicron variant emerged in Scotland around mid-December 2021. After the end of 2021, S-gene dropout testing data suggest that nearly all cases are from the Omicron variant. During the period of change in the dominant variant, a change in the relationship between the WW SARS-CoV-2 RNA levels and case numbers was observed and postulated to be due to different levels of virus shed by the two variants. If this assumption is true, and there is no further change in shedding following the emergence of the Omicron variant BA.2, then from early January 2022, WW SARS-CoV-2 RNA levels should have a consistent relationship with the underlying Covid-19 prevalence.
This graph shows that national WW viral levels have dropped by around 90 Mgc/p/d, followed by a recent increase in the last two days of sampling to around 130 Mgc/p/d. The decline took place broadly across Scotland, and seems clear in the recent data which are less affected by reductions in samples analysed. The apparent rise seen in the last two sampling dates might partly be explained by high levels of run-to-run variation or drier weather conditions, and thus needs to be confirmed by future data.
In Figure 22, we also superimpose data from the ONS Coronavirus Infection Survey (CIS) to 16th April with axis scaling chosen to match levels of WW Covid-19 and CIS prevalence during January and February 2022. Note that this scaling is not the same as that used in reports prior to 1 January 2022, where a scaling based on 2021 data was used. In this comparison, while both WW viral levels and CIS positivity have decreased, the peak in WW viral levels appears to have taken place after the peak in CIS positivity estimates.
Long Covid
A report on the rate of long Covid has not been included in this issue. We will report the long Covid projections again once updated estimates of self-reported long Covid prevalence amongst those infected with the less severe Omicron variant become available.
Local Authority case projections
We are not publishing projections of the number of cases per 100,000 population this week. This analysis indicated which local authorities are likely to experience high levels of Covid-19 in two weeks' time. As a result of changes to widespread population testing the projections of numbers of positive tests are now much less useful for tracking the progression of the disease in Scotland.
What next?
We hope to include our analysis on long Covid in future issues.
Archiving of models is currently being undertaken via the Data Science Scotland GitHub organisation. Details of the Scottish Contact Survey, Wastewater and Exceedance models are currently available. More models will be added over the coming weeks - see the Technical Annex of issue 96 for further details.