Coronavirus (COVID-19): modelling the epidemic (issue no.95)
Latest findings in modelling the COVID-19 epidemic in Scotland, both in terms of the spread of the disease through the population (epidemiological modelling) and of the demands it will place on the system, for example in terms of health care requirement.
Coronavirus (Covid-19): modelling the epidemic in Scotland (Issue No. 95)
Background
This is a report on the Scottish Government modelling of the spread and level of Covid-19 in Scotland. This updates the previous publication on modelling of Covid-19 in Scotland published on 17th March 2022. The estimates in this document help the Scottish Government, the health service and the wider public sector plan and put into place what is needed to keep us safe and treat people who have the virus.
This edition of the research findings focuses on the epidemic as a whole, looking at estimates of R, growth rate and incidence as well as local measures of change in the epidemic.
Key Points
- The reproduction rate R in Scotland is currently estimated as being between 1.0 and 1.3, as at 8th March 2022. The lower and upper limits are both unchanged since last week.
- The daily growth rate for Scotland is currently estimated as between 1% and 4% as at 8th March. The lower and upper limits have increased since last week.
- UKHSA were unable to reach a consensus on the incidence of new daily infections in Scotland as at 8th March.
- Average contacts from the most recent Panel B cohort of the Scottish Contact Survey (week ending 16th March) indicate an average of 5.2 contacts.
- Mean contacts have increased in the majority of location settings with the exception of contacts within the school setting which has decreased by 47% in the last two weeks. Contacts have risen in the work setting by 44%, in the other setting (contacts outside home, school and work) by 12% and in the home setting by 6%.
- Individuals within the youngest age groups (18-39) have reported a decrease in contacts within the last two weeks, with the 18-29 age group reducing by approximately 20%. Those within the older age groups (40+) have increased their contacts in the last two weeks with those in the 40-49 age group increasing the most, by 39%.
- Visits to a pub or restaurant have shown the biggest increase, increasing from approximately 41% to 45%. The biggest decrease has been in individuals visiting the gym, decreasing from 22% to 17% in the last two weeks.
- Approximately 77% of individuals had taken at least one lateral flow test within the last 7 days for the survey pertaining to the 10th March - 16th March.
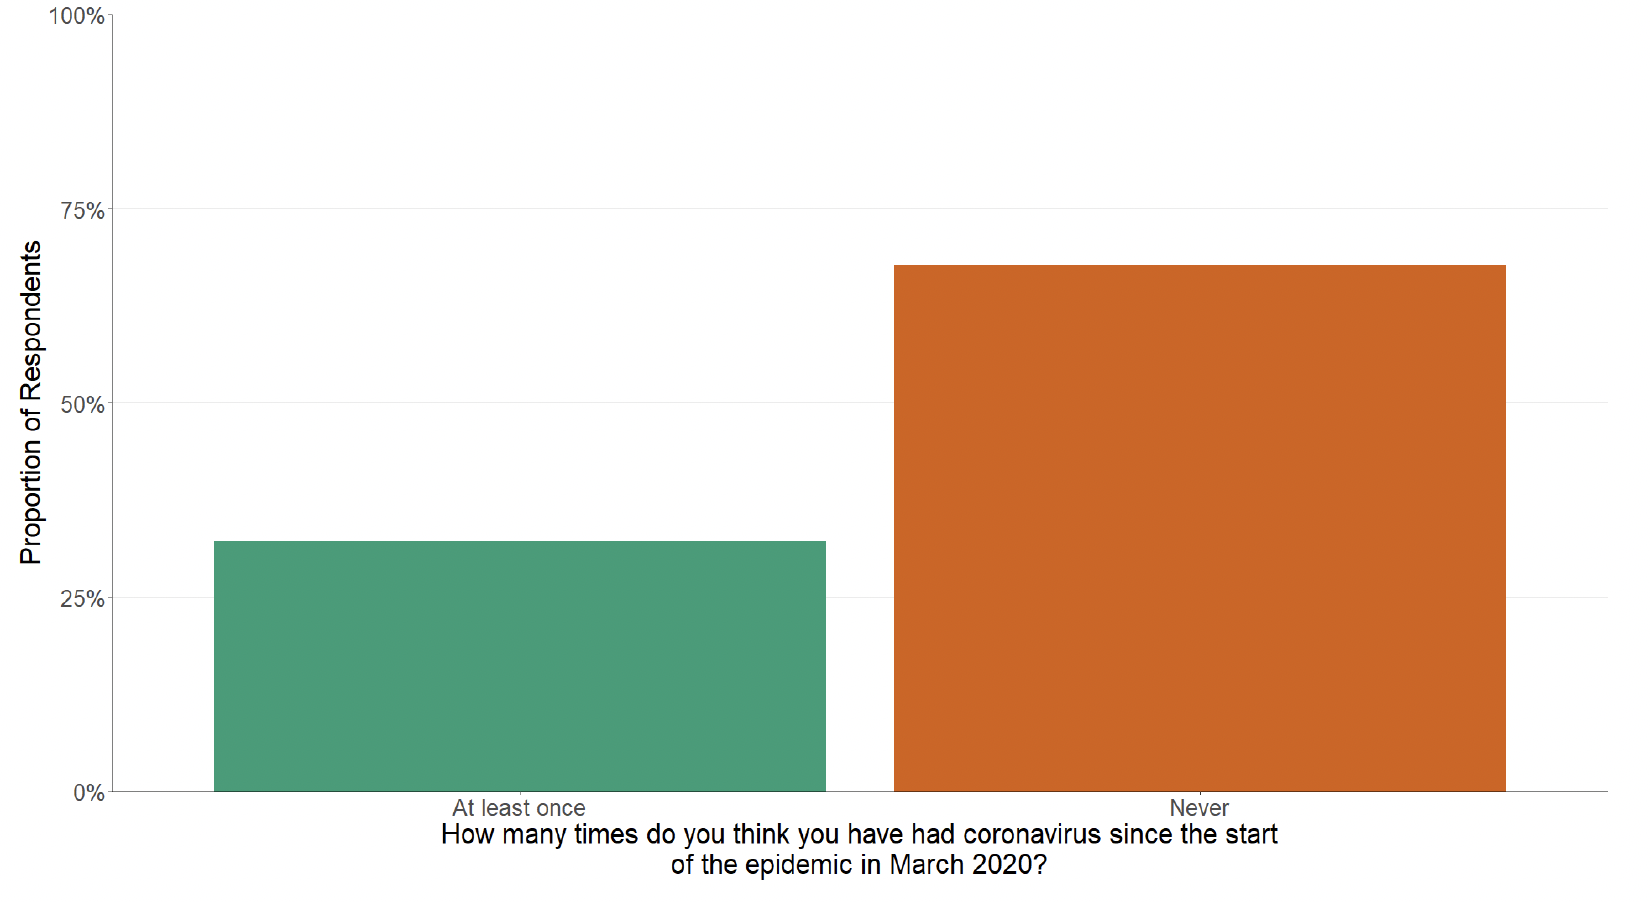
- Approximately 32% of individuals believe they have had Covid-19 at least once since March 2020.
- The future trajectory of infections, hospitalisations, hospital occupancy and deaths is still uncertain. We estimate that daily infections may be up to 60,000 in mid-April.
- Modelled rates of positive tests per 100K using data to 21st March indicate that, for the week commencing 3rd April, all 29 of the local authorities included are expected to exceed 100 cases per 100K with at least 75% probability. These same 29 local authorities also have at least a 75% probability of exceeding 300 cases per 100K.
- 24 of the 29 local authorities included are expected to exceed 500 cases per 100K with at least 75% probability. The exceptions are Aberdeenshire, Aberdeen, Angus, East Renfrewshire and Moray.
- One local authority (South Ayrshire) is expected to exceed 1000 cases per 100K with at least 75% probability.
- Analysis indicates that there remains a substantial variation in geographical risk of infection when considering the average recorded census age and booster vaccination uptake.
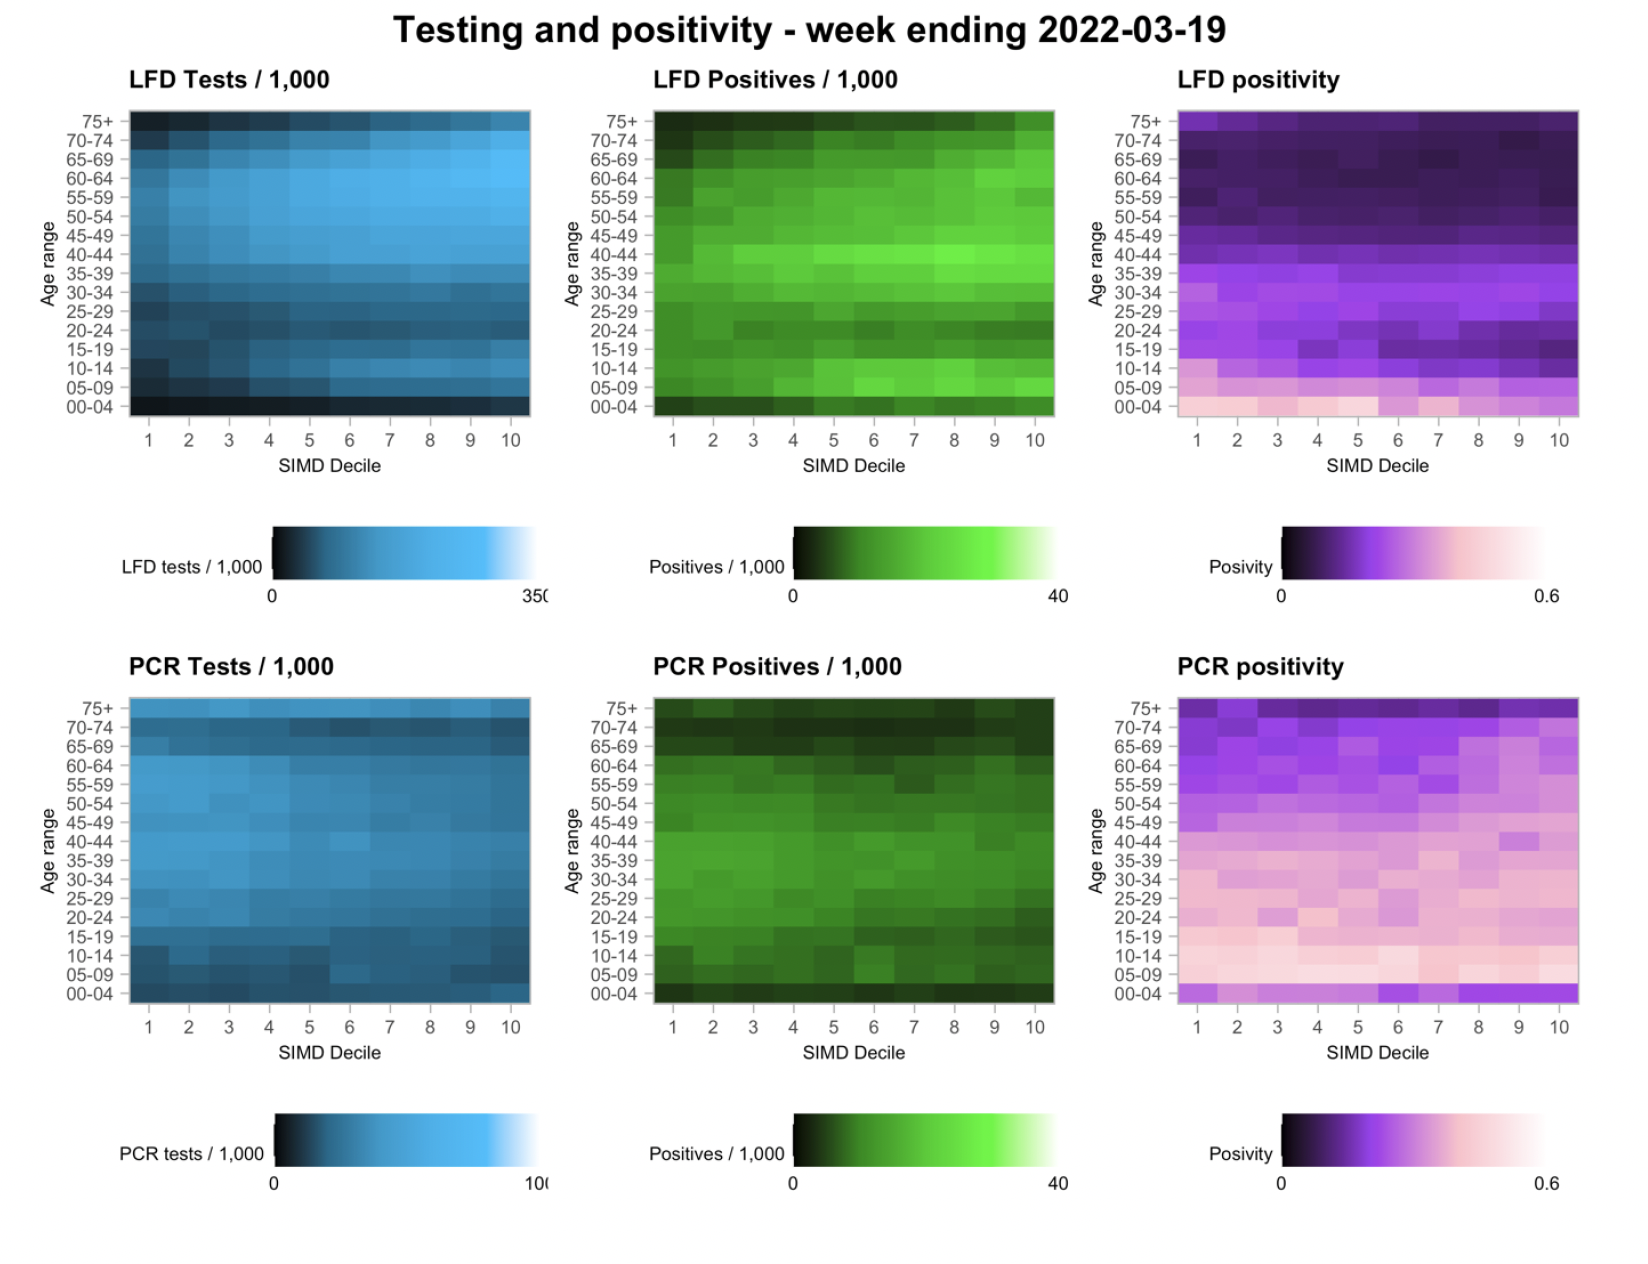
- Positivity has stabilised across all age and deprivation deciles, due to both a decrease in the numbers of positive tests, and an increase in the total numbers of tests taken (both LFD and PCR).
- The distribution of lateral flow/LFD tests being reported continues to vary substantially by both age and deprivation status, with many fewer tests reported in younger adults across all deciles of deprivation, and for children in more deprived deciles. The high level of LFD positivity in the latter category is marked, and when compared to the high number of positives amongst the least deprived, consistent with under ascertainment being concentrated in particular groups.
- Nationwide, wastewater Covid-19 levels have increased again, albeit at a slower rate than in recent weeks. The week ending on 22nd March saw levels of around 212 million gene copies per person per day (Mgc/p/d), an increase of only 3% from 205 Mgc/p/d the previous week (week ending 15th March).
Recent cases
Figure 1 shows the number of Covid-19 cases (from either PCR or LFD) in Scotland between January and March 2022. The vertical dashed lines indicate the cut off points for each of the modelling inputs; after these dates, the number of cases is not incorporated into the outputs.
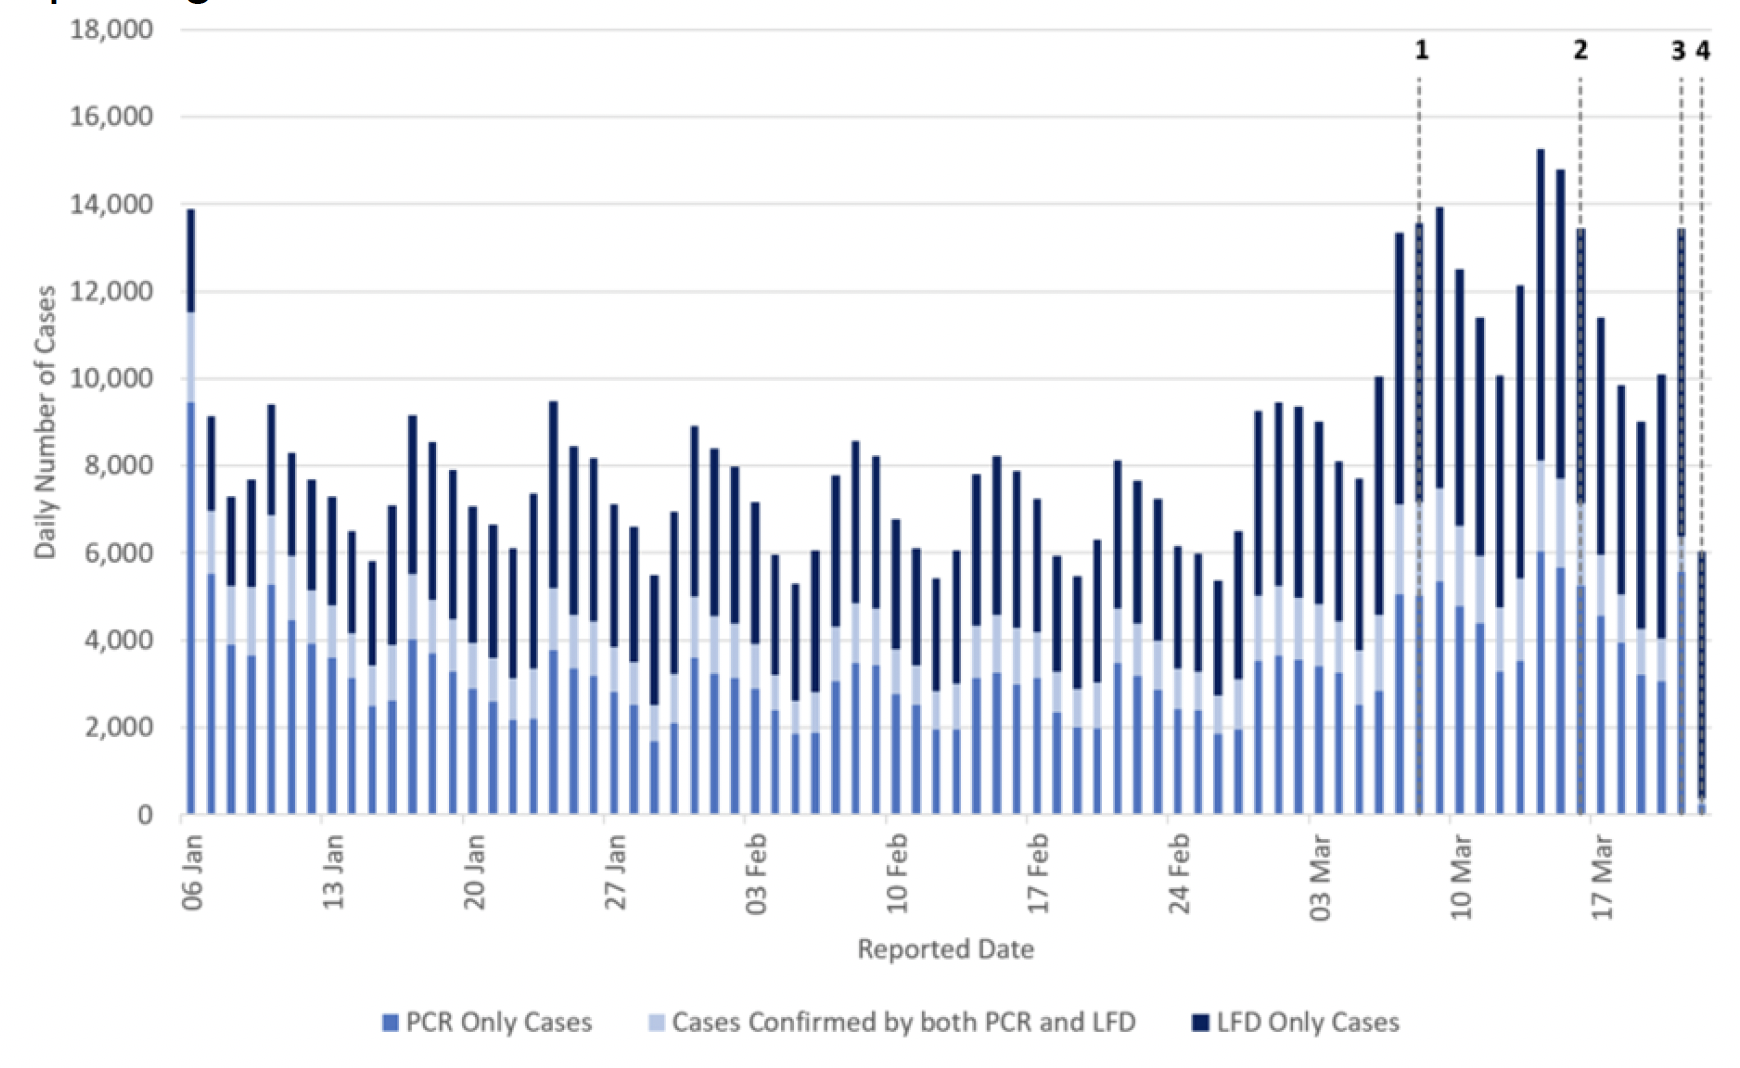
R and growth rate are as of 8th March 2022 (dashed line 1). The Scottish Contact Survey uses data to 16th March 2022 (dashed line 2). The Scottish Government modelling of infections and hospitalisations, and the modelled rates of positive tests per 100K use data to 21st March (dashed line 3). The wastewater analysis uses data to 22nd March 2022 (dashed line 4).
Overview of Scottish Government Modelling
Modelling outputs are provided here on the current epidemic in Scotland as a whole, based on a range of methods. Because it takes a little over three weeks on average for a person who catches Covid-19 to show symptoms, become sick, and either die or recover, there is a time lag in what our model can tell us about any change in the epidemic.
This week the Scottish Government presented three outputs to EMRG. The first uses the number of positive LFD or PCR tests, as published by PHS Scotland. The second uses wastewater data. The third uses data from a new agent-based model[1]. These outputs are included in Figure 2.
The R value and growth rates are estimated by several independent modelling groups based in universities and the UKHSA. Estimates are considered, discussed and combined at the Epidemiology Modelling Review Group (EMRG), which sits within the UKHSA. These are based on data to 21st March.
UKHSA's consensus view across these methods was that the value of R in Scotland[2] is between 1.0 and 1.3, as of 8th March 2022[3] (Figure 2). The lower and upper limits are unchanged from last week. R is an indicator that lags by two to three weeks.
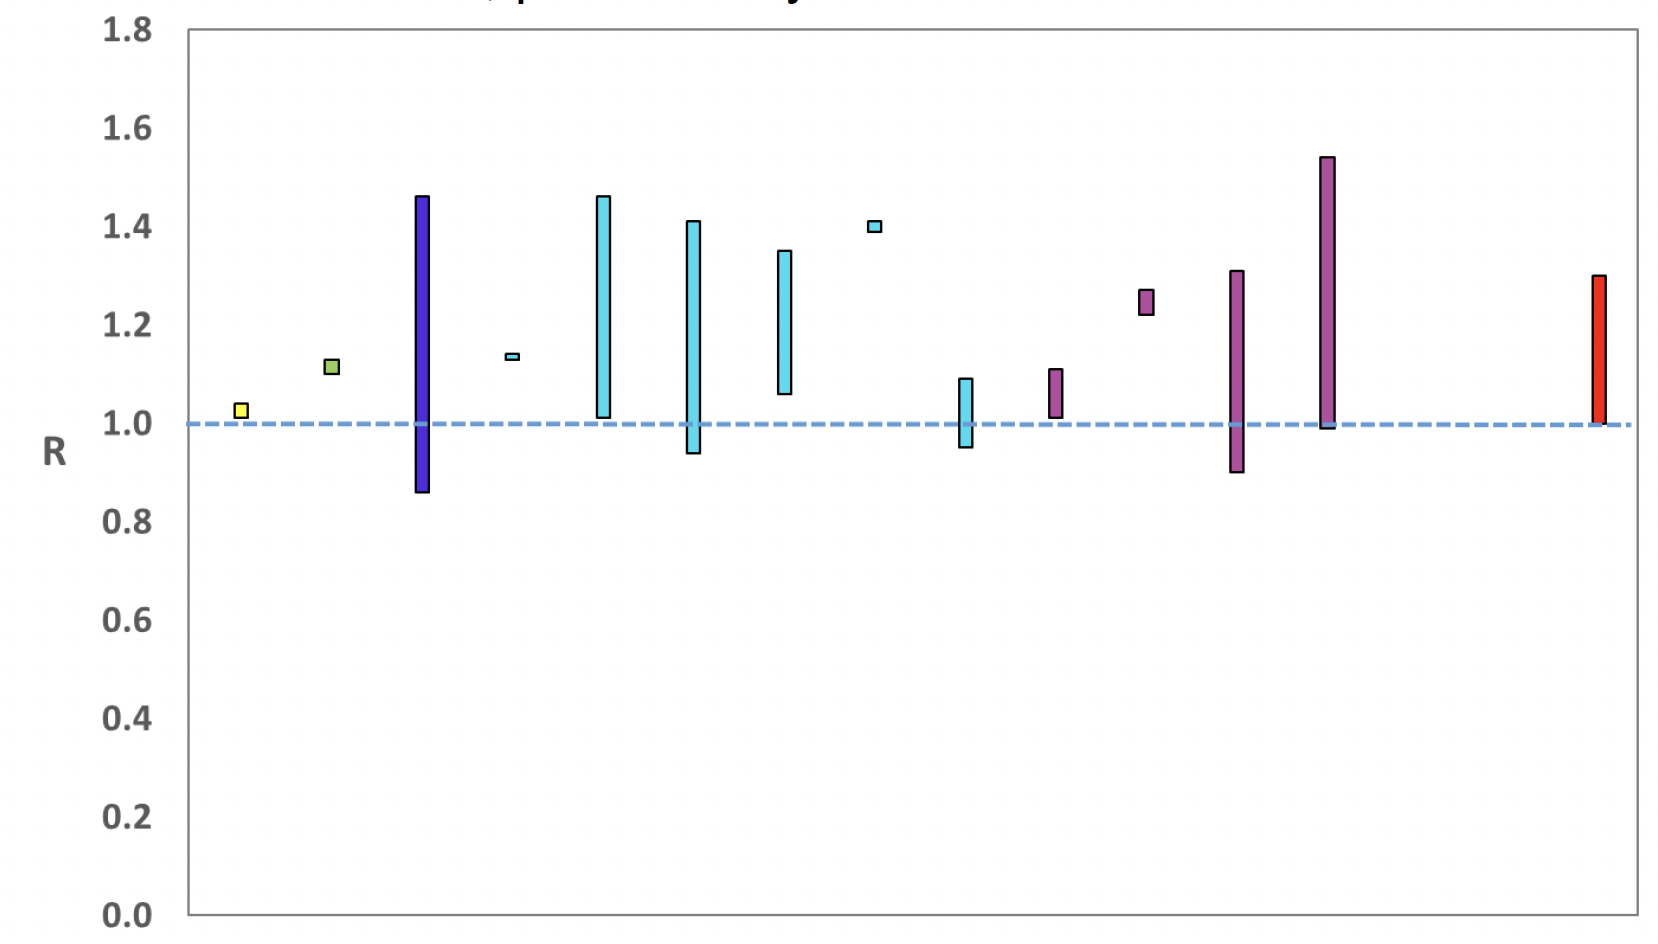
Source: EMRG
The consensus from UKHSA for this week is that the growth rate in Scotland is between 1% and 4% per day as at 1st March. The lower and upper limits have increased since last week.
UKHSA was unable to form a consensus view on the incidence of new daily infections in Scotland as at 8th March.
What we know about how people's contact patterns have changed
Average contacts from the most recent Panel B cohort of the Scottish Contact Survey (week ending 16th March) indicate an average of 5.2 contacts, as shown in Figure 3.
Mean contacts have increased in the majority of location settings with the exception of contacts within the school setting which has decreased by 47% in the last two weeks. Contacts have risen in the work setting by 44%, in the other setting (contacts outside home, school and work) by 12% and in the home setting by 6%.
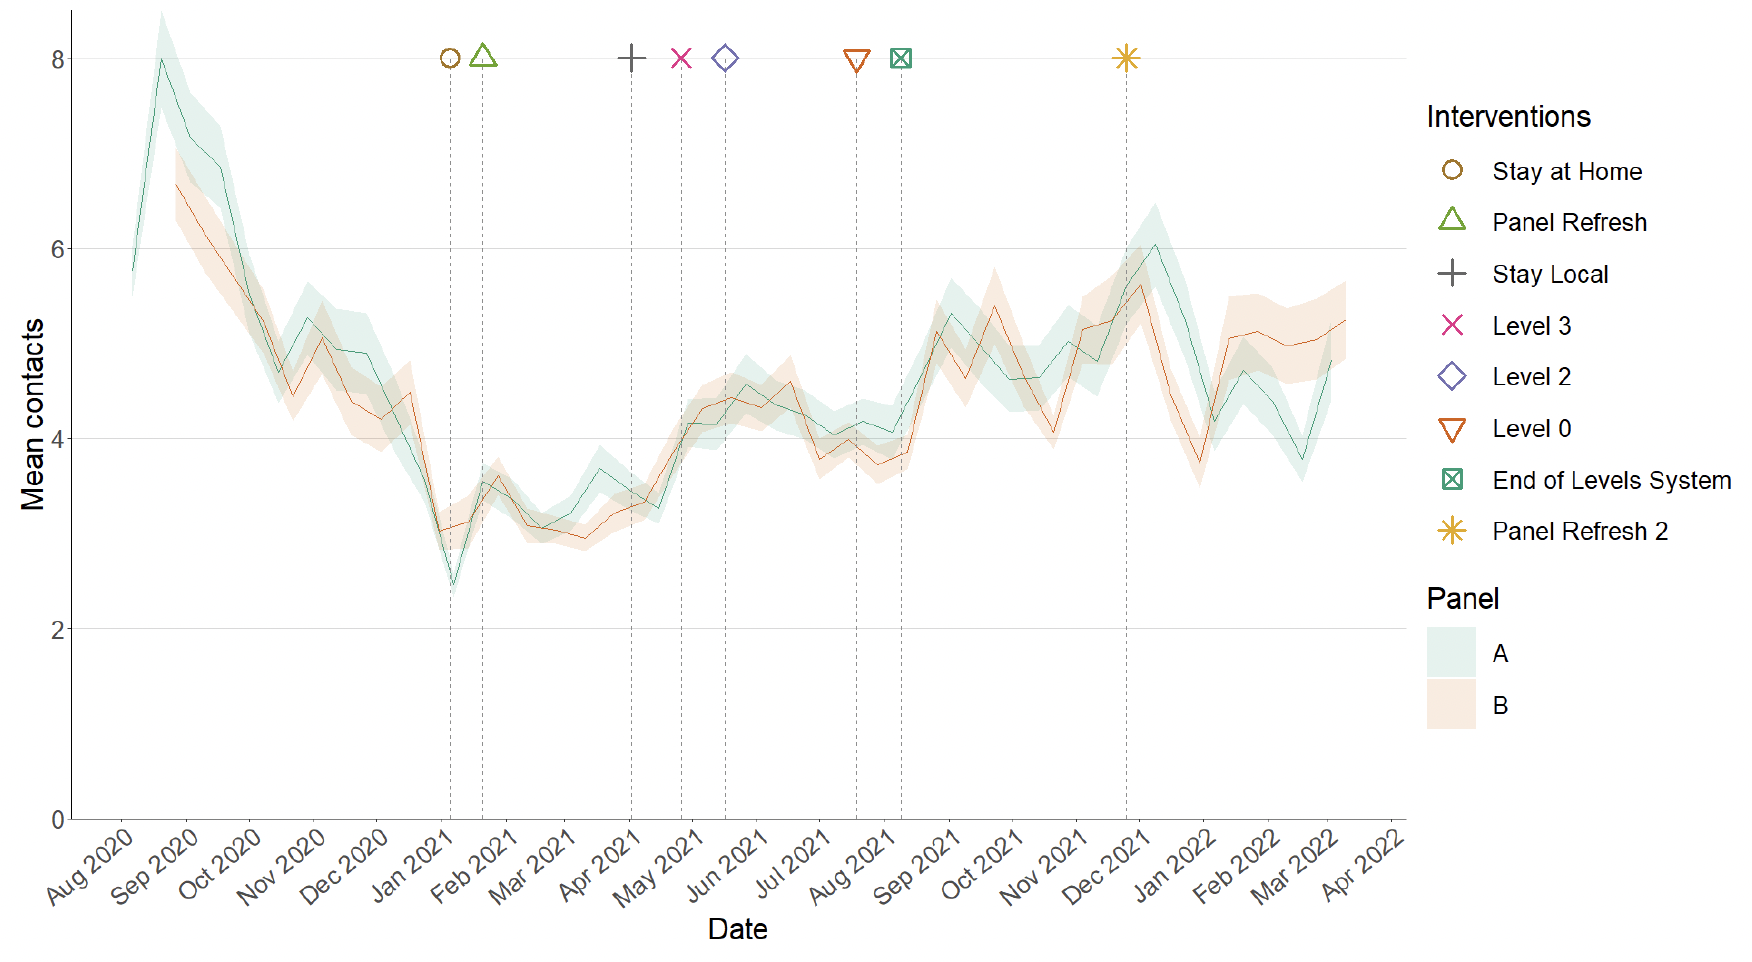
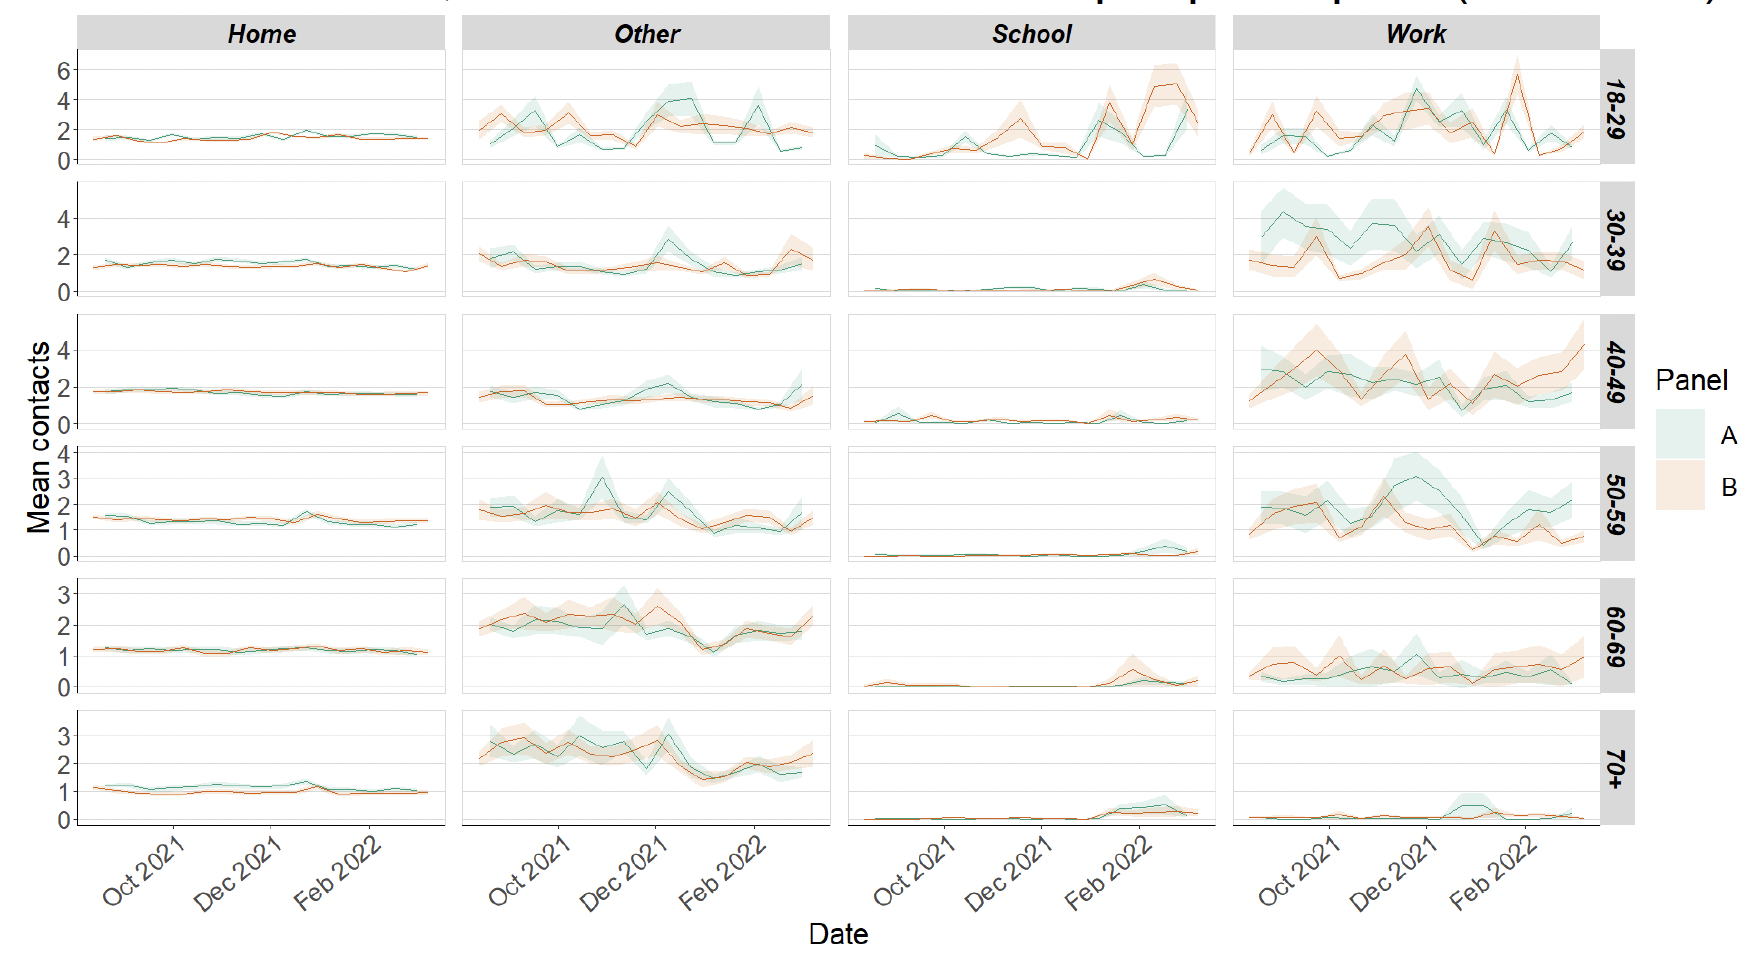
Figure 4 shows how contacts change across age group and setting. Individuals within the youngest age groups (18-59) have reported a decrease in contacts within the last two weeks, with the 18-29 age group reducing by approximately 20%. Those within the older age groups (40+) have increased their contacts in the last two weeks with those in the 40-49 age group increasing the most, by 39%.
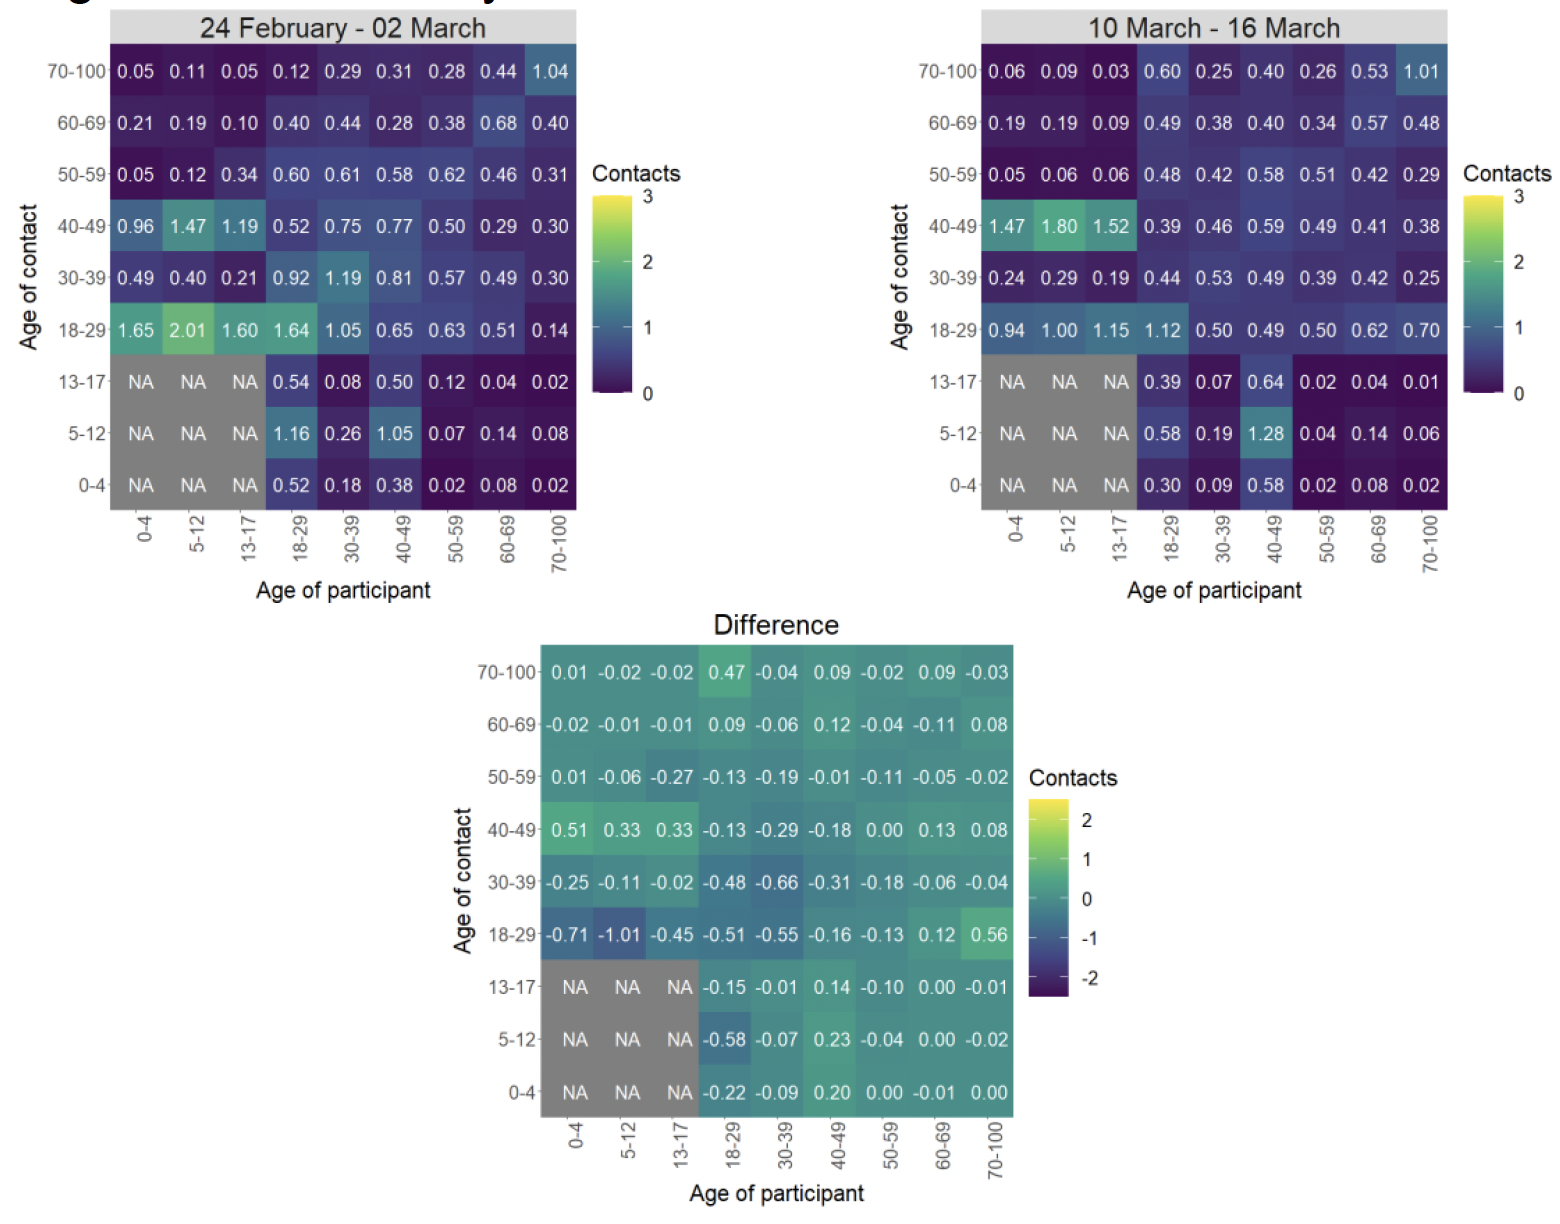
The heatmaps in Figure 5 show the mean overall contacts between age groups for the weeks relating to 24th February - 2nd March and 10th March - 16th March and the difference between these periods. The biggest decrease in interactions is between those aged under 12 and the 18-29 age group.
The biggest changes in the proportion of participants visiting different locations is seen in those visiting a pub or restaurant and individuals visiting a gym. Visits to a pub or restaurant have shown the biggest increase, increasing from approximately 41% to 45%. The biggest decrease has been in individuals visiting the gym, decreasing from 22% to 17% in the last two weeks as shown in Figure 6.
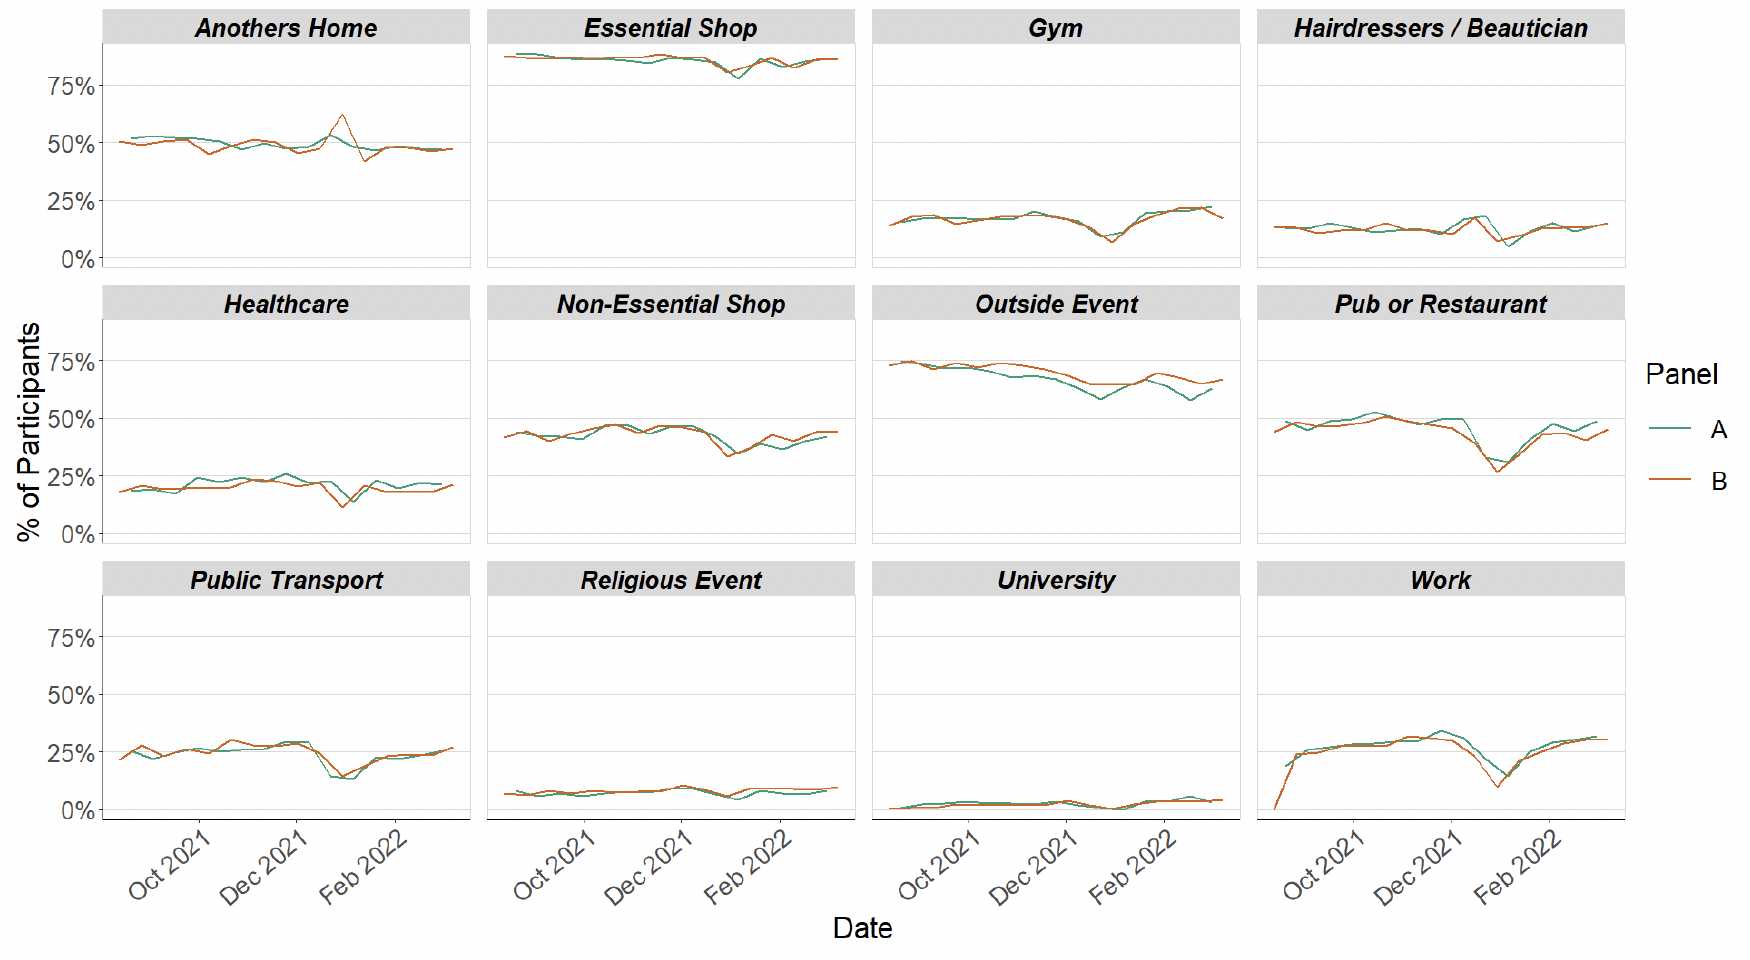
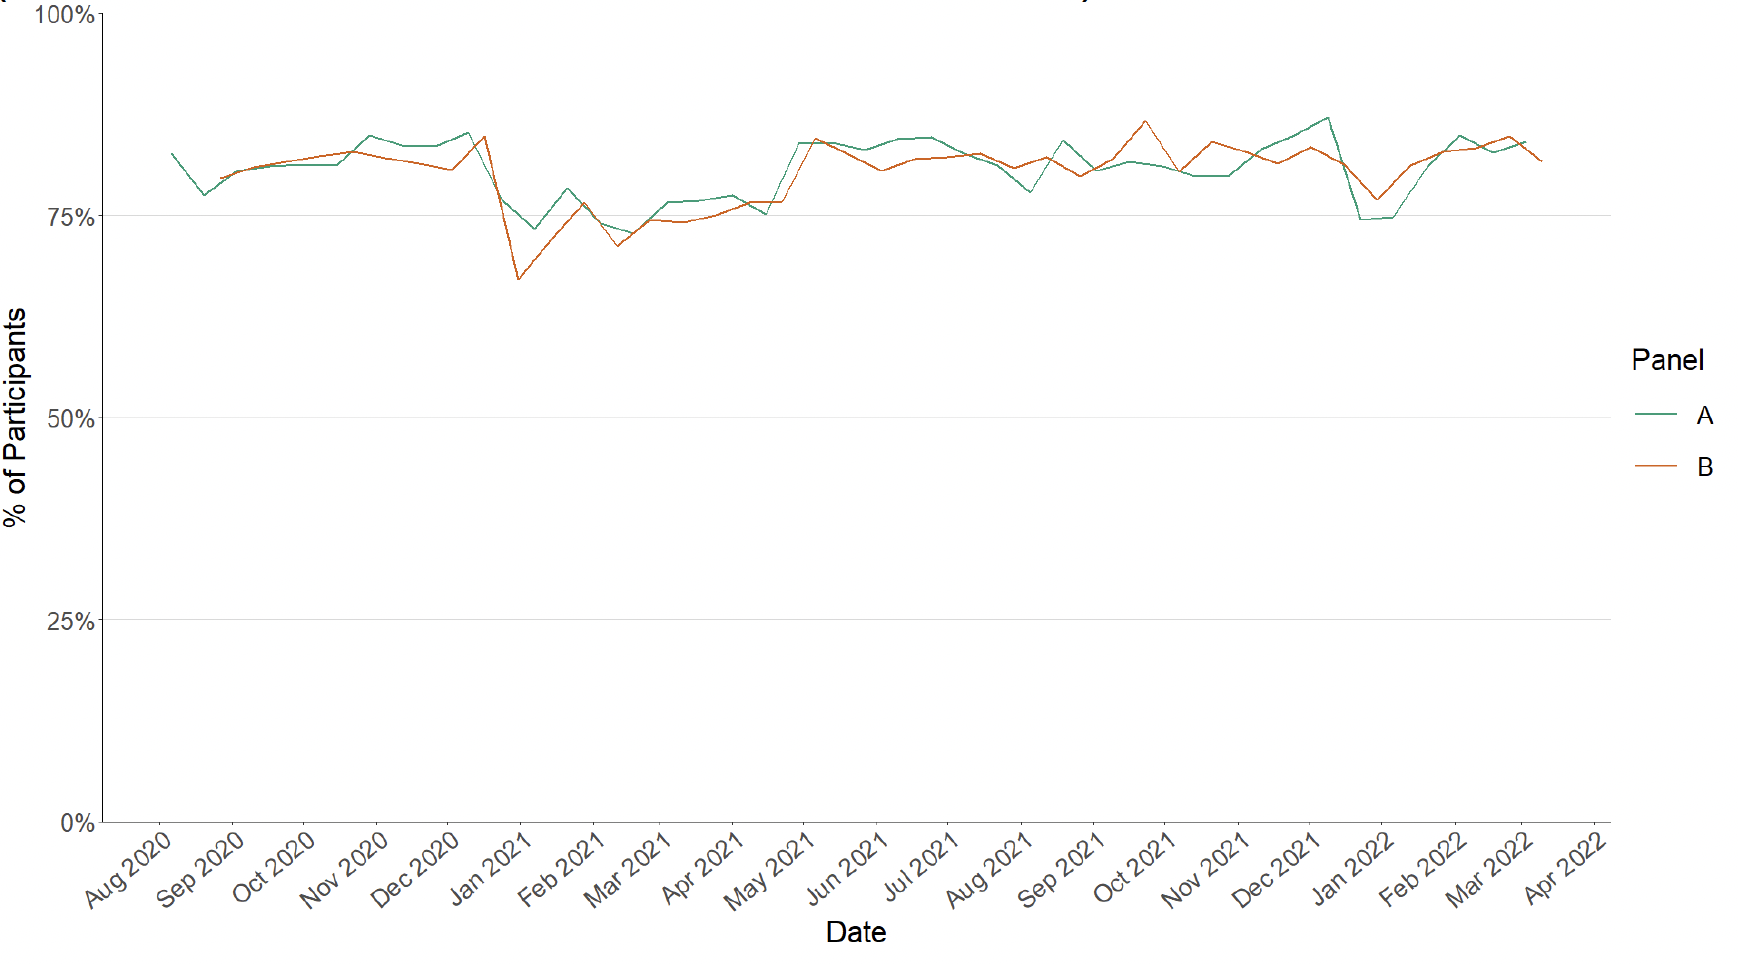
Figure 7 shows the number of people wearing a face covering where they have at least one contact outside of the home. This has decreased in the last two weeks from 85% to 82%.
Approximately 77% of individuals had taken at least one lateral flow test within the last 7 days for the survey pertaining to the 10th March - 16th March, increasing from 76% two weeks prior as shown in Figure 8.
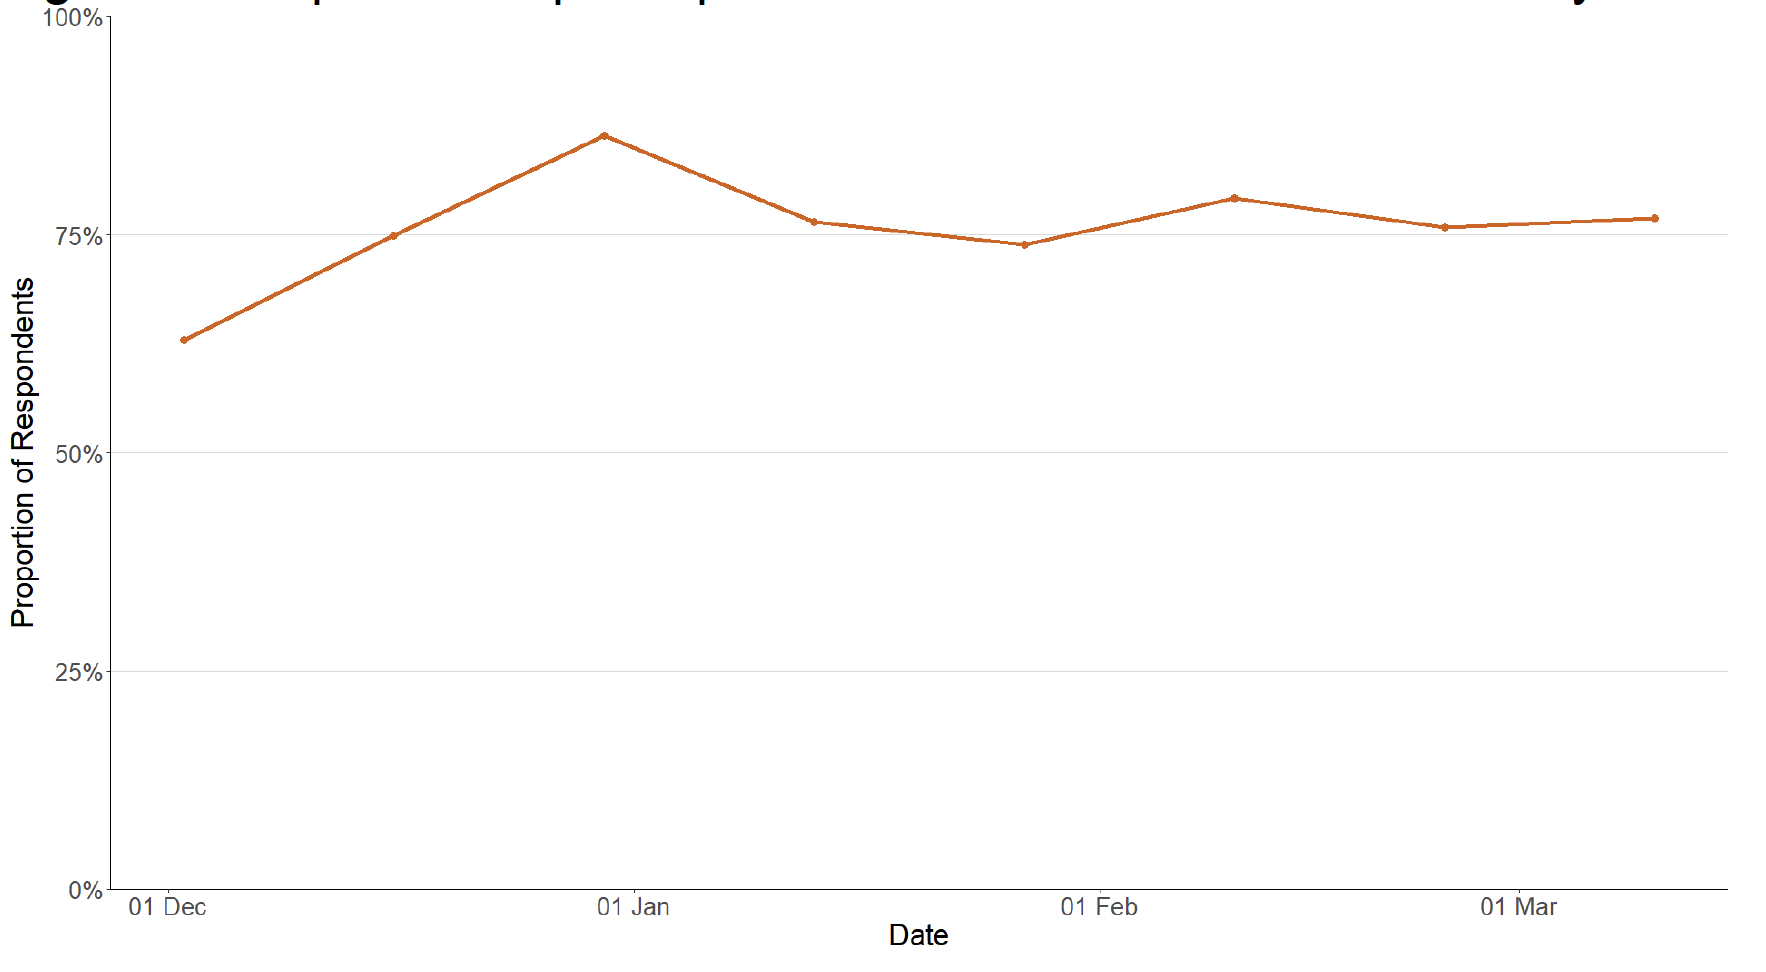
Figure 9 shows that approximately 32% of individuals believe they have had Covid-19 at least once since March 2020. Of those who think they have had Covid-19, 85% have had this confirmed through a test.
What the modelling tells us about estimated infections and hospitalisations
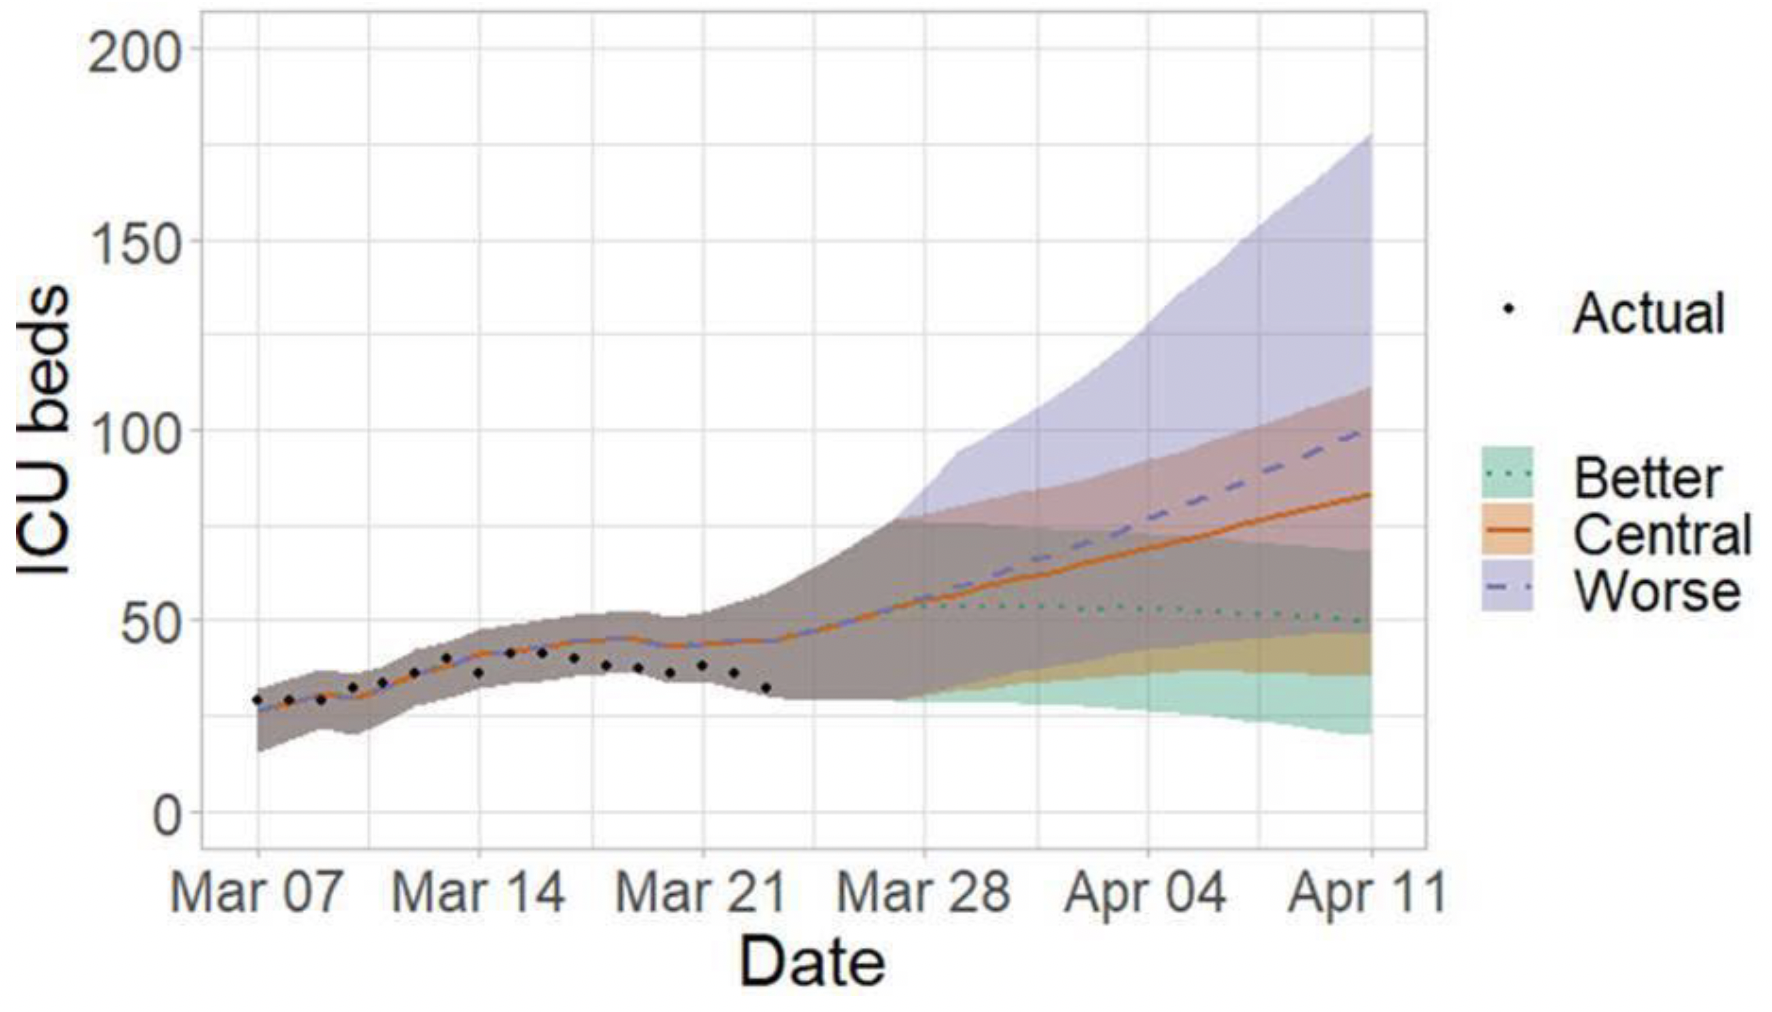
The Scottish Government assesses the impact of Covid-19 on the NHS in the next few weeks. Figures 10 - 12 show projections over three weeks.
These projections include the effect of 3rd dose take up but do not yet account for the rollout of 4th doses. Current vaccine effectiveness within the modelling is derived from Public Health England's most recent vaccine surveillance report[5]. This report provides an indication of the initial effectiveness of the different vaccine products used within Scotland and how this effectiveness reduces over time since the vaccination was administered. Initial protection from infection, protection from hospitalisation, and transmission reduction of natural immunity are assumed to be halfway between initial effectiveness of Moderna and 100%[6] and wanes to 67% after 1-2 years[7]. The 67% is based on Delta and will be updated when information on Omicron is available.
'Central' assumes that transmissibility remains at current levels. This transmissibility is estimated by calculating the current rates of transmission based on the most recent available infections data and then projecting this forward at similar levels over the coming weeks. 'Worse' assumes a higher transmissibility, whereas 'Better' assumes a lower transmissibility. These projections do not include the changes to restrictions announced on 15th March. The changes to restrictions are assumed to result in people's behaviour gradually returning towards pre-pandemic levels over the coming weeks and months, as the impact of this becomes clearer we will revise the modelling. From these transmissibility assumptions we produce the infections curves shown in Figure 10. Changes in transmissibility represent changes in behaviour. The lower transmissibility in 'Better' assumes people behave more cautiously than they do at the moment, while the higher transmissibility in 'Worse' assumes people behave less cautiously. Assumptions around hospitalisation/ICU rates by age and vaccination status and then applying some assumptions around length of stay as derived by matching the numbers calculated from infections to current data are then used to estimate the occupancy for hospital and ICU as shown in Figure 11 and 12 respectively.
The future trajectory of infections is uncertain.
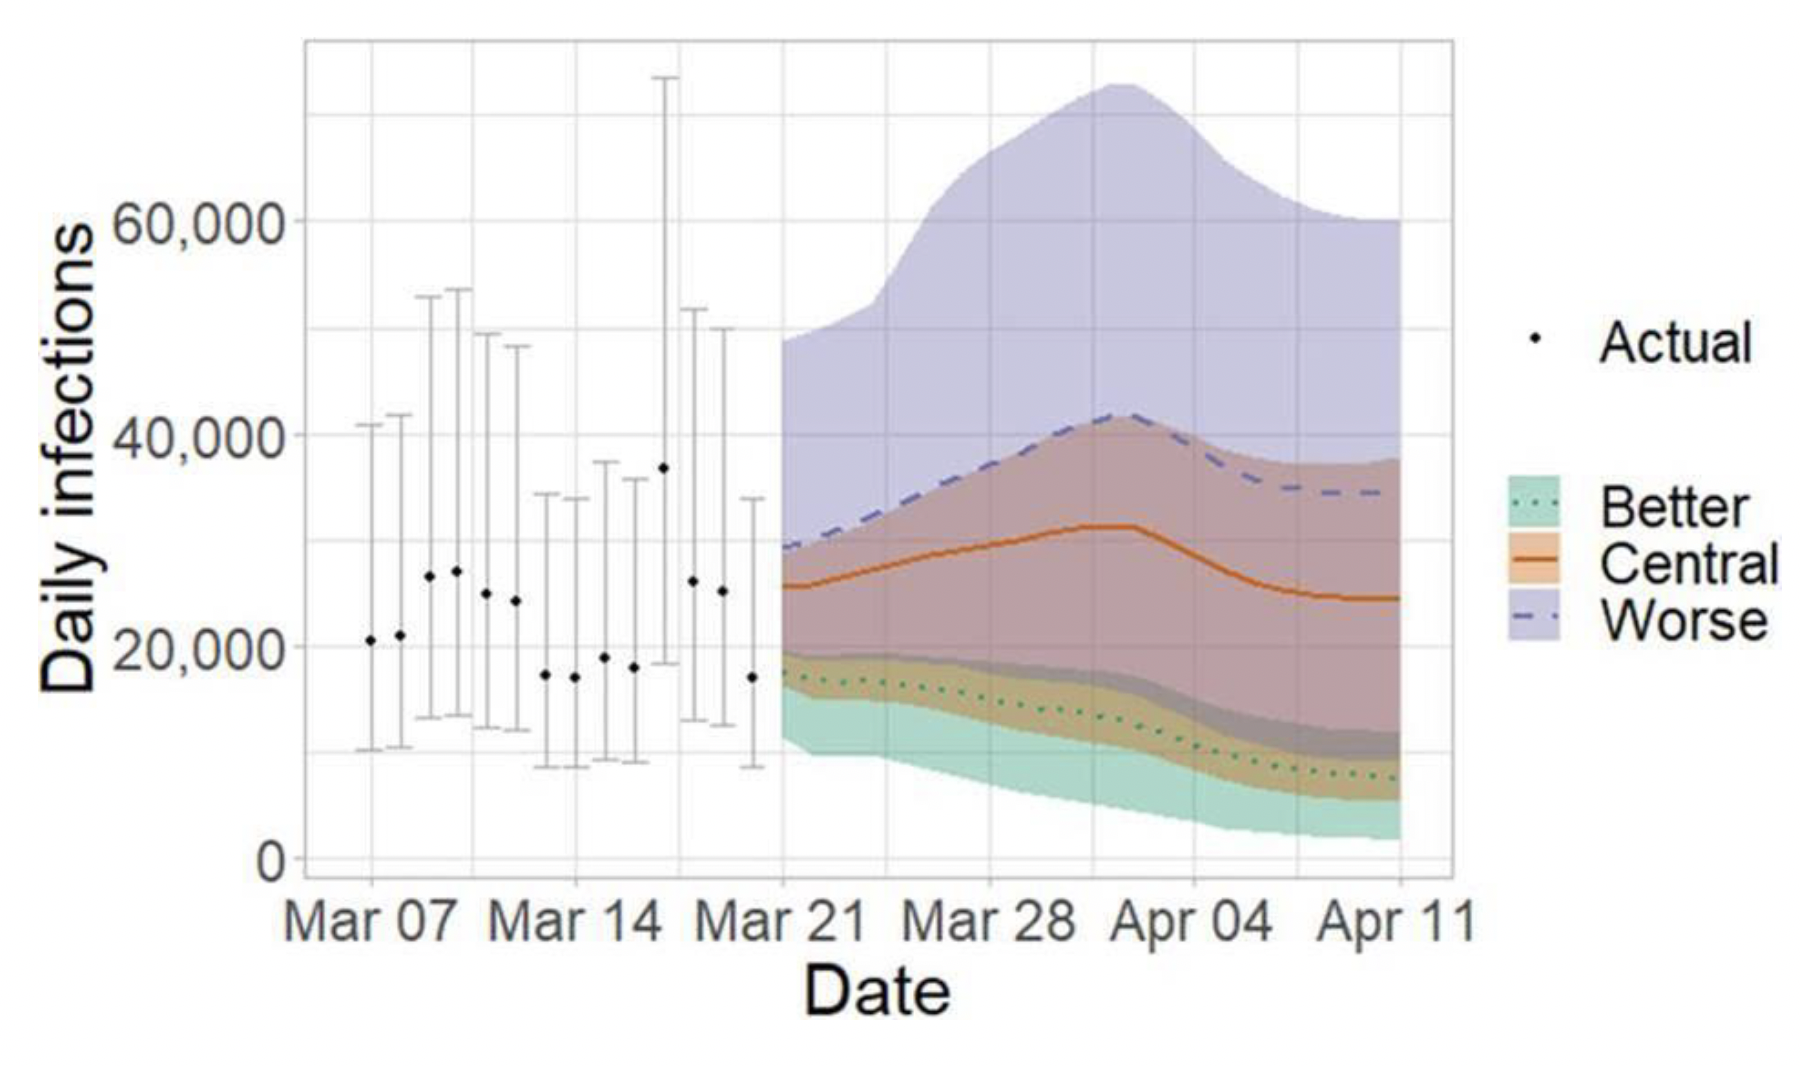
We estimate that daily infections may be up to 60,000 in early April.
Figure 11 shows the impact of the projections on the number of people in hospital. The modelling includes all hospital stays, whereas the actuals only include stays up to 28 days duration that are linked to Covid-19.
There continues to be uncertainty over hospital occupancy and intensive care in the next three weeks.
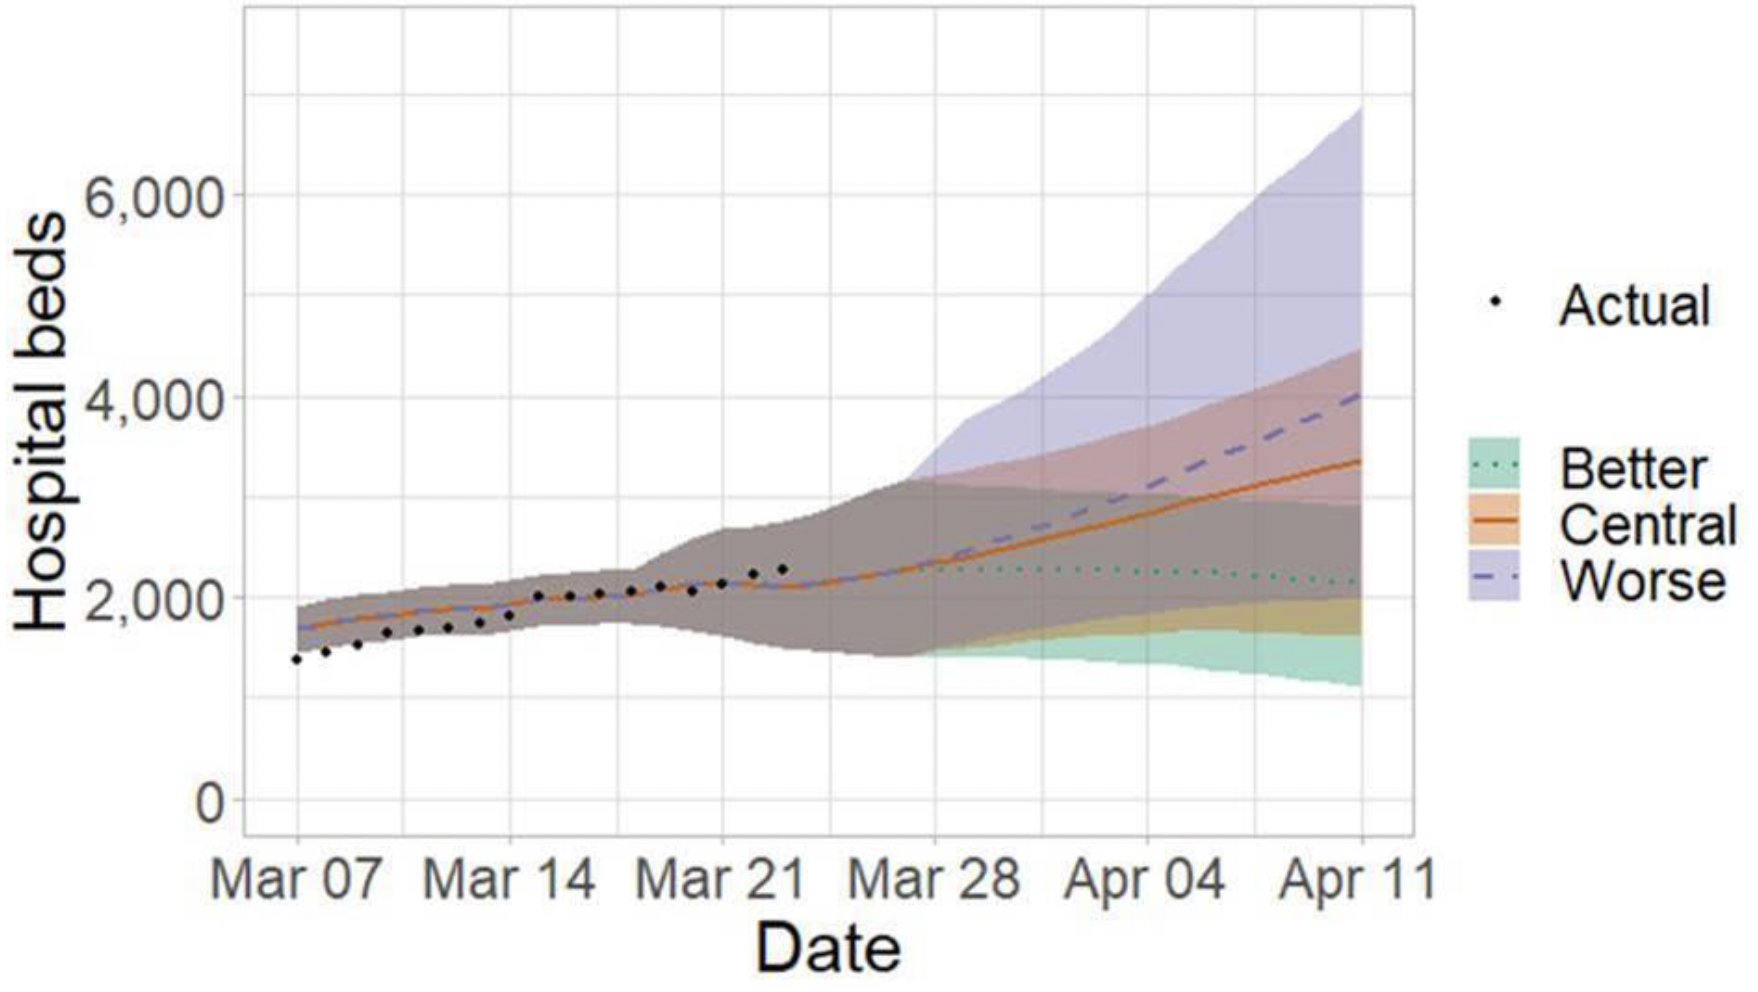
Figure 12 shows the impact of the projection on ICU bed demand.
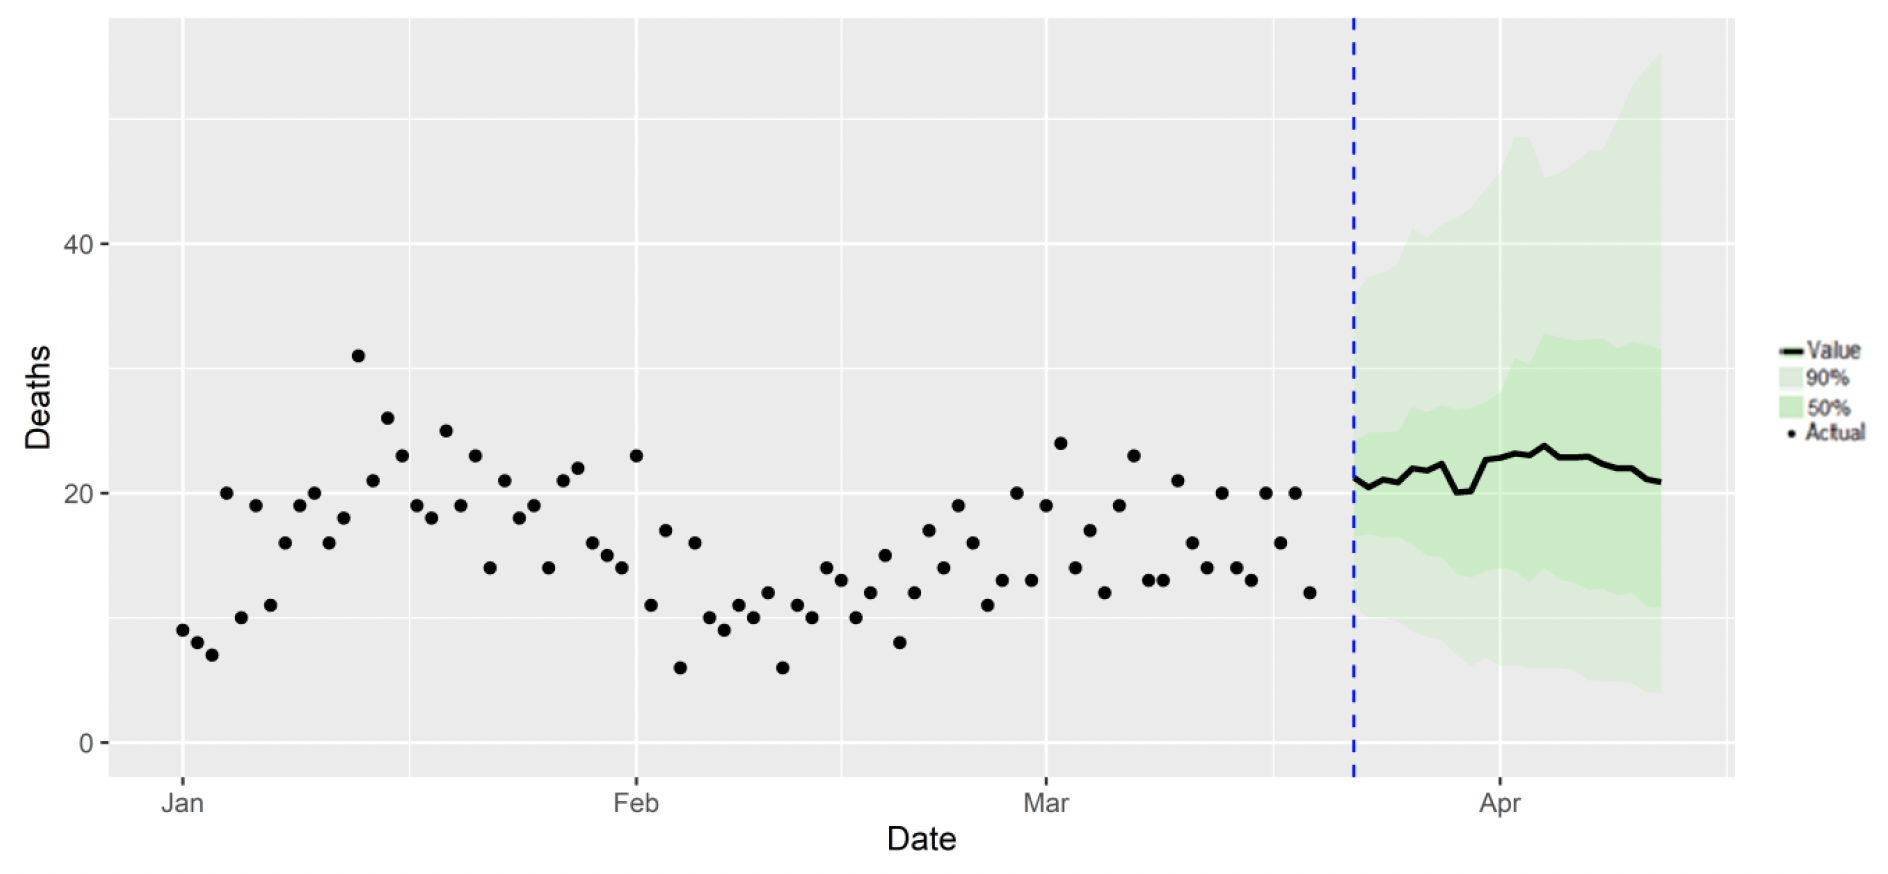
What the modelling tells us about projections of hospitalisations, occupancy and deaths in the medium term
SPI-M-O produces projections of the epidemic (Figures 13 - 15), combining estimates from several independent models. These projections are not forecasts or predictions. They represent a scenario in which the trajectory of the epidemic continues to follow the trends that were seen in the data available to 21st March and do not include the effects of any future policy or behavioural changes.
The delay between infection, developing symptoms, the need for hospital care, and death means they cannot fully reflect the impact of behaviour changes in the two to three weeks prior to 21st March.
The projections include the potential impact of vaccinations over the next few weeks. Modelling groups have used their expert judgement and evidence from UKHSA, Scottish Universities & Public Health Scotland, and other published efficacy studies when making assumptions about vaccine effectiveness.
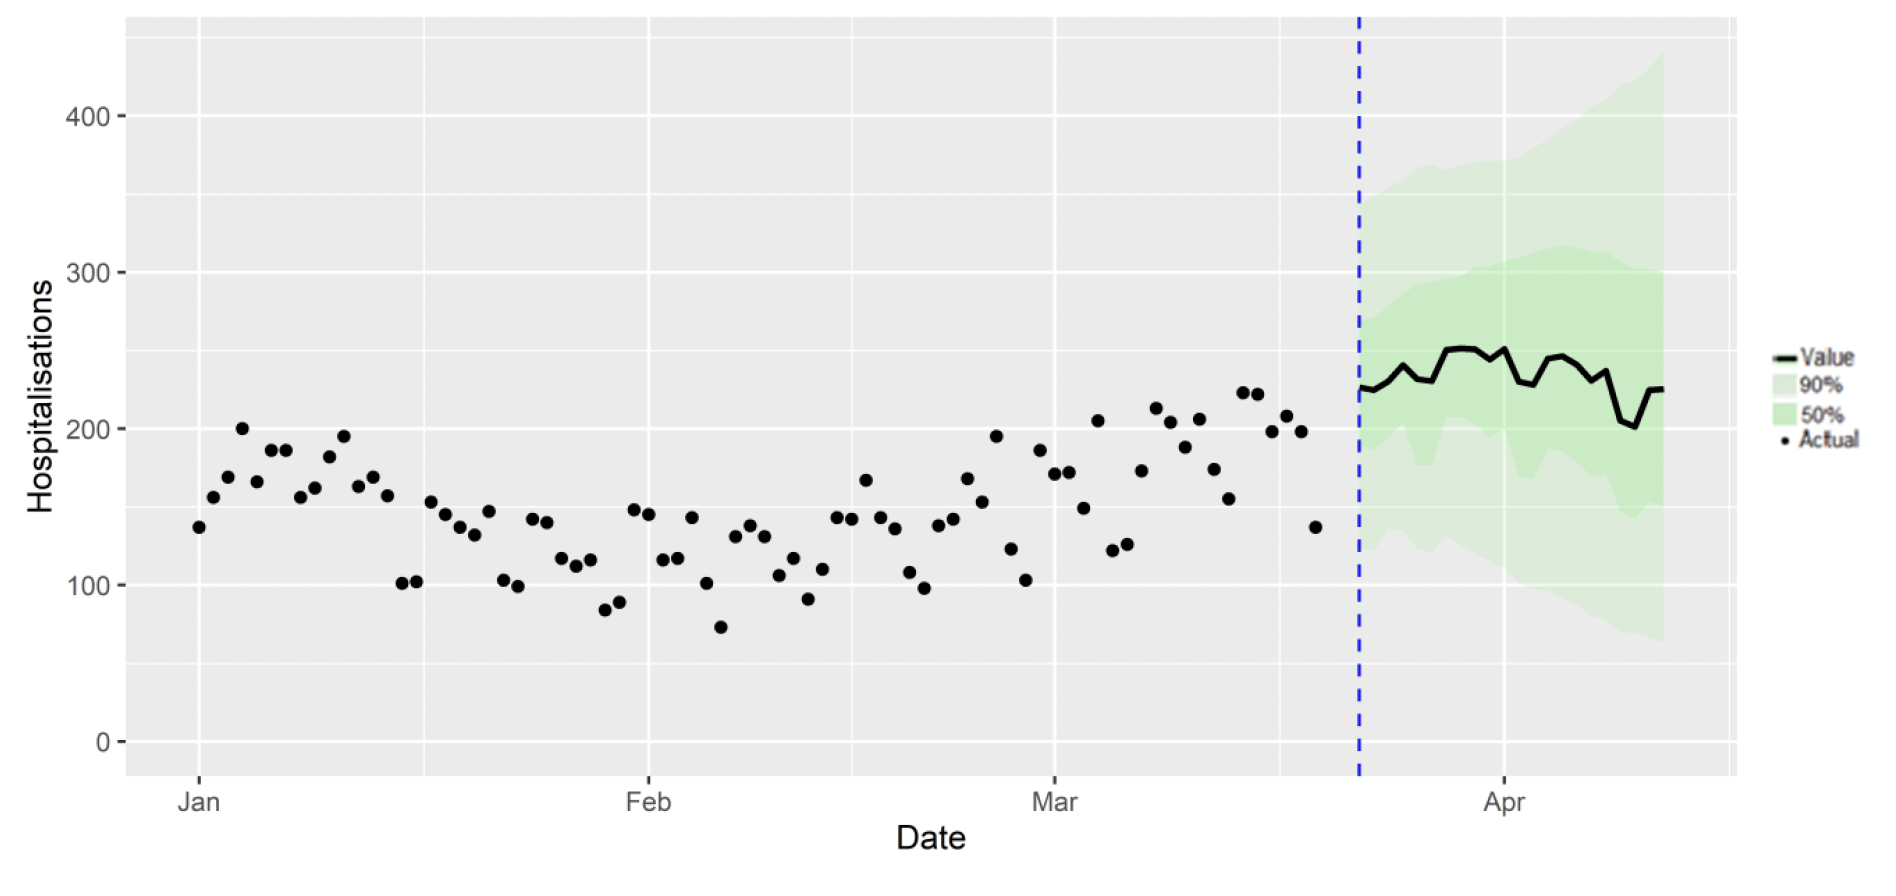
Figure 14 shows the SPI-M-O consensus on hospital occupancy. Hospital occupancy is determined by the combination of admissions and length of stay, the latter of which is difficult to model with confidence.
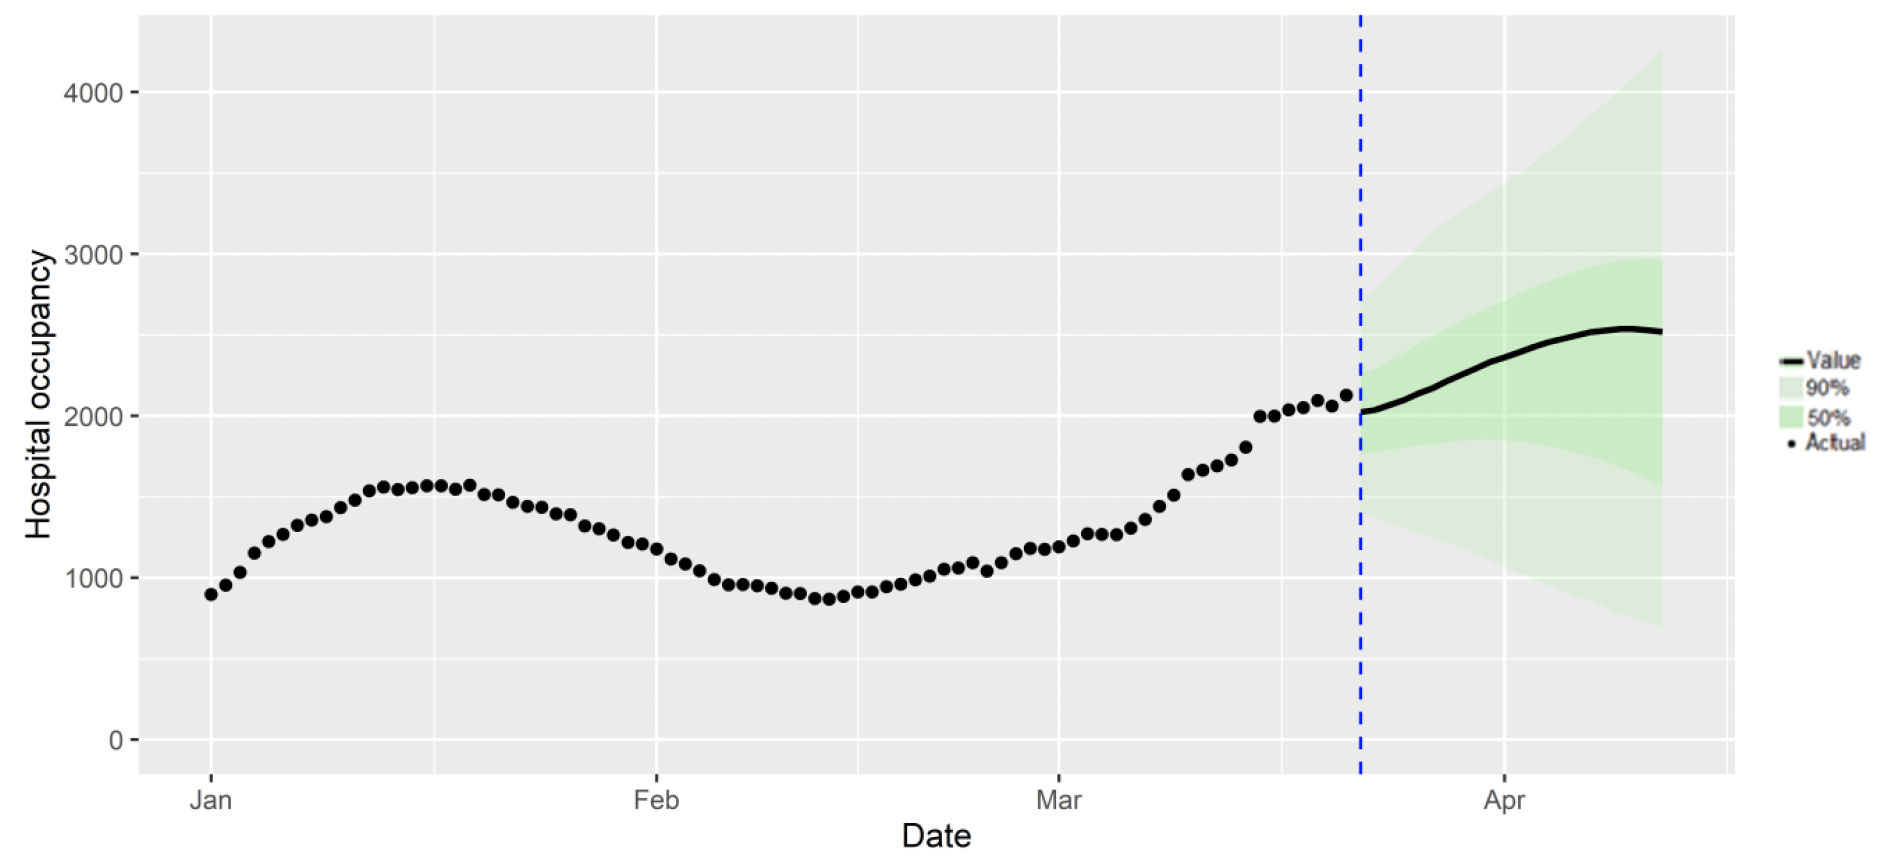
Figure 15 shows the SPI-M-O consensus on daily Covid-19 deaths.
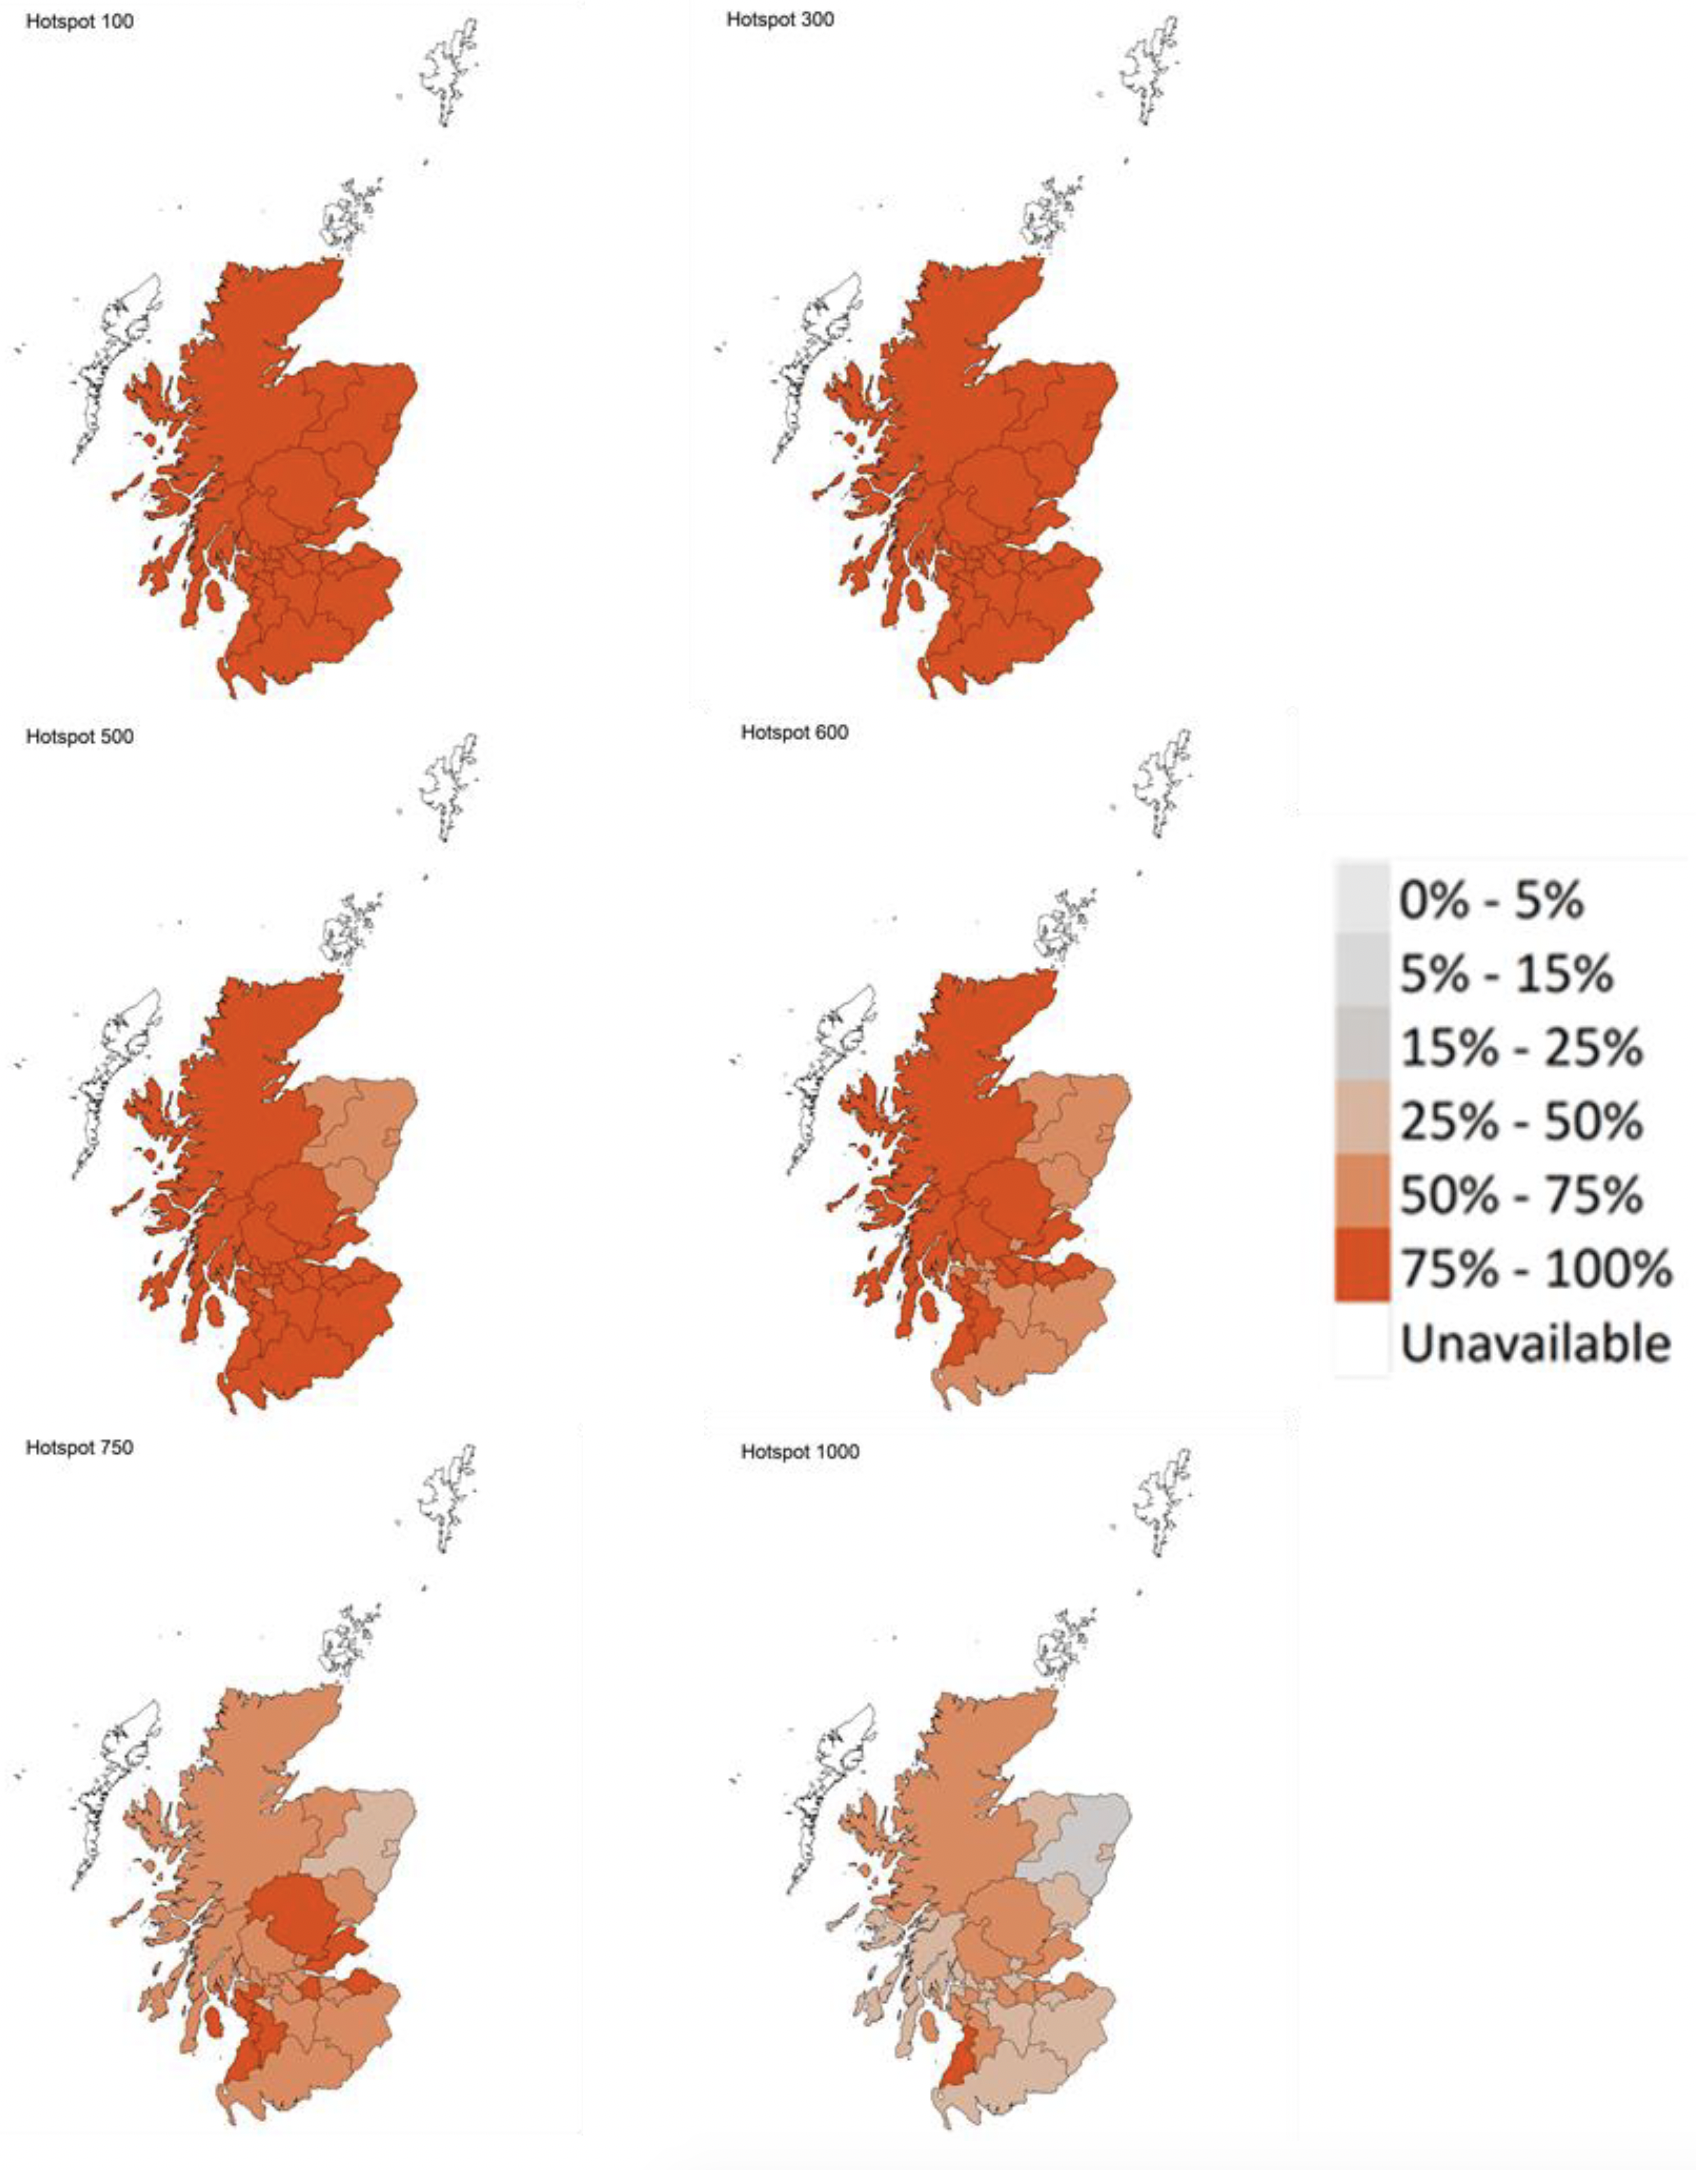
What we know about which local authorities are likely to experience high levels of Covid-19 in two weeks' time
We continue to use modelling based on Covid-19 cases and deaths using data to 21st March from several academic groups to give us an indication of whether a local authority is likely to experience high levels of Covid-19 in the future. This has not been compiled via UKHSA into a consensus this week and is based on one modelling group.
In less populated regions in which case numbers are small, there is a greater variation in model estimates, and hence increased uncertainty. This has led to this analysis not including Na h-Eileanan Siar, Orkney Islands and Shetland Islands this week.
In this, an area is defined as a hotspot if the two week prediction of cases (positive tests) per 100K population is predicted to exceed a threshold, e.g. 500 cases.
Modelled rates of positive tests per 100K using data to 21st March (Figure 16) indicate that, for the week commencing 3rd April, all 29 of the local authorities included are expected to exceed 100 cases per 100K with at least 75% probability. These same 29 local authorities also have at least a 75% probability of exceeding 300 cases per 100K.
24 of the 29 local authorities included are expected to exceed 500 cases per 100K with at least 75% probability. The exceptions are Aberdeenshire, Aberdeen, Angus, East Renfrewshire and Moray.
One local authority (South Ayrshire) is expected to exceed 1000 cases per 100K with at least 75% probability.
We have not included the 50 case per 100K threshold in Figure 16 this week due including some higher threshold levels instead. The threshold levels are the same as for the 100 case threshold. The full set of values are included in Table 1 in the Technical Annex.
Summary of spatial analysis of Covid-19 spread in Scotland
Researchers at the Edinburgh Roslin Institute have conducted spatial analysis of Covid-19 Spread in Scotland. A summary of findings from the week from 14th March to 21st March 2022 is included here. Risk factors indicate where the number of cases are higher than expected geographically (i.e. administrative data zones), but do not necessarily represent the risk to individuals in those areas.
The modelling indicates there remains a substantial variation in risk of infection by average census age in each datazone. Deprivation in this period is not a substantial factor when comparing across local authorities. Risk factors remain stable, when comparing to previous weeks.
The distribution of lateral flow/LFD tests being reported varies substantially by both age and deprivation status, with many fewer tests reported in younger adults across all deciles of deprivation, and for children in more deprived deciles. The high level of LFD positivity in the latter category is marked, and when compared to the high number of positives amongst the least deprived, suggests that ascertainment may be lower in younger people in deprived areas.
What can analysis of wastewater samples tell us about local outbreaks of Covid-19 infection?
Levels of Covid-19 RNA in wastewater (WW) collected at a number of sites around Scotland are adjusted for population and local changes in intake flow rate (or ammonia levels where flow is not available). See Technical Annex in Issue 34 of these Research Findings for the methodology. These reports are based on the most recent data available. Future updates to data may lead to small retrospective changes.
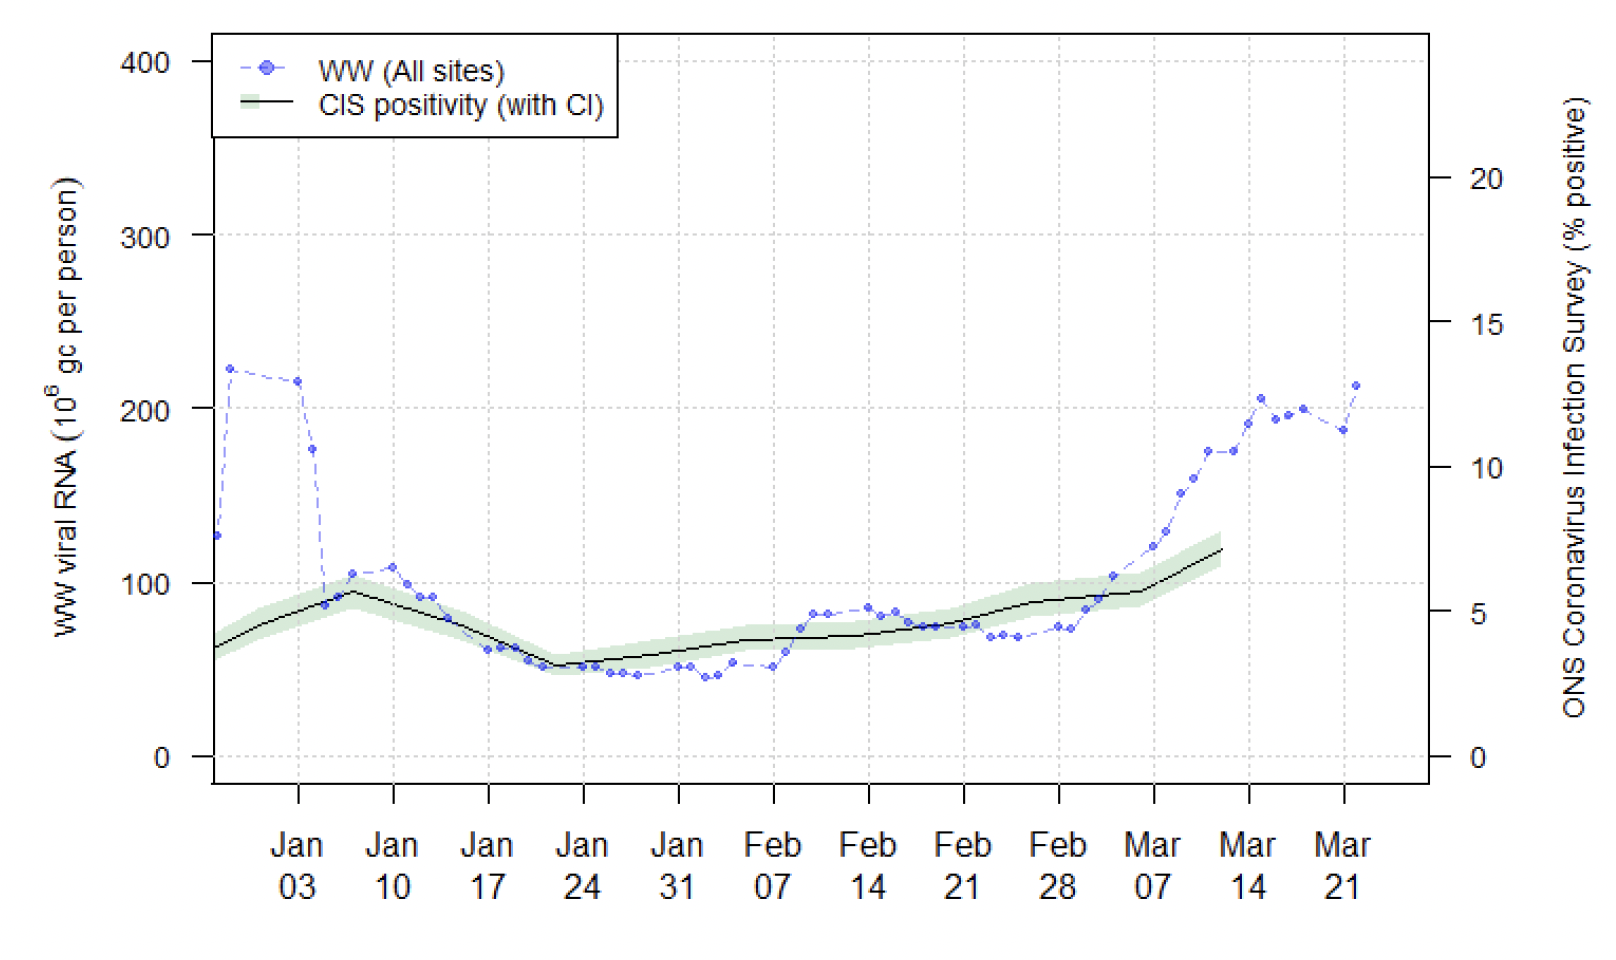
Nationwide, wastewater Covid-19 levels have increased again, albeit at a slower rate than in recent weeks. The week ending on 22nd March saw levels of around 212 million gene copies per person per day (Mgc/p/d), an increase of only 3% from 205 Mgc/p/d the previous week (week ending 15th March).
This week saw wastewater sampling at similar levels to recent weeks at around 200 samples.
In Figure 19, we restrict plotting to the period from January 2022 onwards. The Omicron variant emerged in Scotland around mid‑December 2021. After the end of 2021, S-gene dropout testing data suggest that nearly all cases are from the Omicron variant. During the period of change in the dominant variant, a change to the relationship between the WW Covid-19 levels and case numbers was observed and postulated to be due to different levels of virus shed by the two variants. If this assumption is true, and there is no further change in shedding following the emergence of the Omicron variant BA.2, then from early January 2022, WW Covid-19 levels should have a consistent relationship with the underlying COVID-19 prevalence. In Figure 19, we also superimpose data from the ONS Coronavirus Infection Survey (CIS) to 12th March, with axis scaling chosen to match post-2021 levels of WW Covid-19 and CIS prevalence. Note that this scaling is not the same as that used in reports prior to 1st January 2022, where a scaling based on 2021 data was used.
There is a large increase in WW Covid-19 levels starting from the end of February. However, in the most recent week of data, the rate of increase in WW Covid-19 levels has reduced. Note that case data suggest a similar pattern in the changes in Covid-19 prevalence in recent days. The CIS prevalence estimates, despite showing an uptick in positivity to over 7%, have not yet matched the rate of increase in WW Covid-19 last week. This may change when new data is added, but historically CIS positivity levels have responded more modestly than WW data to large increases in Covid-19 prevalence.
Long Covid
A report on the rate of long Covid has not been included this week. We will report the long Covid projections again once updated estimates of self-reported long Covid prevalence amongst those infected with the less severe Omicron variant become available.
What next?
Modelling will continue to look at the impact of Omicron, particularly the variant BA.2. As the year progresses we will incorporate different models as and when it is appropriate to do so.
We hope to include our analysis on long Covid in future weeks.