Coronavirus (COVID-19): modelling the epidemic (issue no. 55)
Latest findings in modelling the COVID-19 epidemic in Scotland, both in terms of the spread of the disease through the population (epidemiological modelling) and of the demands it will place on the system, for example in terms of health care requirement.
Coronavirus (COVID-19): modelling the epidemic in Scotland (Issue No. 55)
Background
This is a report on the Scottish Government modelling of the spread and level of Covid-19. This updates the previous publication on modelling of Covid-19 in Scotland published on 3 June 2021. The estimates in this document help the Scottish Government, the health service and the wider public sector plan and put into place what is needed to keep us safe and treat people who have the virus.
This edition of the research findings focuses on the epidemic as a whole, looking at estimates of R, growth rate and incidence as well as local measures of change in the epidemic.
In Scotland, the modelled estimate for R is between 1.2 and 1.4, with the growth rate increasing to between 3% and 6% and modelled estimates of infections now increasing over the next four weeks. There has been a rise in hospital beds in use by Covid-19 patients, which is projected to continue over the next four weeks. The increase in Covid-19 cases is also reflected in the wastewater data.
The measures modelled for this week, as described above, indicate that we are seeing a further deterioration in Scotland, with considerable uncertainty as to what this means for future weeks.
Key Points
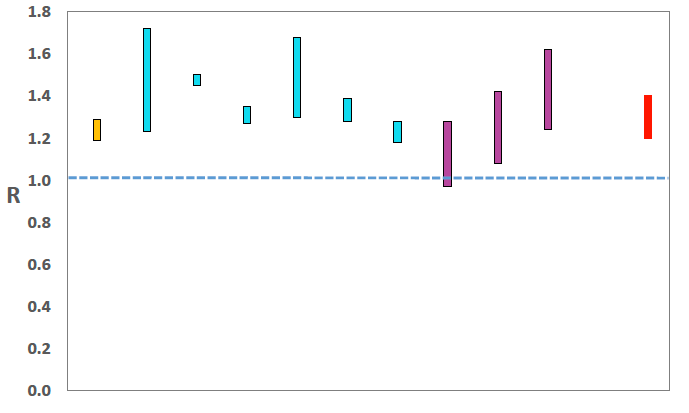
- The reproduction rate R in Scotland is currently estimated as being between 1.2 and 1.4. This is an increase in the bottom and the top of the range since last week.
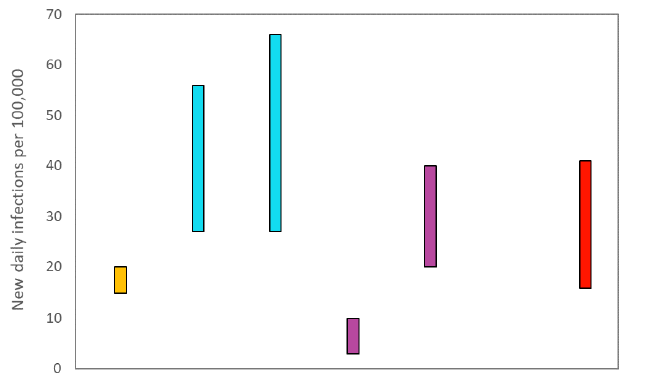
- The number of new daily infections for Scotland is estimated as being between 16 and 41, per 100,000 people. This has increased since last week.
- The growth rate for Scotland is currently estimated as being between 3% and 6%. This is an increase since last week.
- Average contacts have increased by 10% in the last two weeks (comparing surveys pertaining to 13th – 19th May and 27th May - 2nd June) with a current level of 4.6 daily contacts.
- Contacts within the work and school setting have increased, 22% and 20% respectively in comparison to two weeks prior and contacts within the other setting (contacts outside of those in the home, school and work) have increased slightly by 8%.
- All age groups have increased their contacts or remained at a similar level compared to two weeks prior. The increases were largely driven by contacts within the work setting for those aged under 50 and by contacts within the home or other setting for those over 50.
- There has been a rise in interactions with those aged between 18-29 with all other age groups, with the biggest increase in interactions seen between those aged 18-29 with each other.
- The biggest increase in the proportion of participants visiting different locations is seen in those visiting another's home, increasing from 40% to 48% in the last two weeks, followed by visiting a Pub or Restaurant, increasing from 32% to 38%.
- Hospital bed and intensive care unit (ICU) occupancy are projected to rise over the next few weeks.
- Modelled rates of positive tests per 100K indicate that for the week commencing 20 June 2021, there are 22 local authorities with at least a 75% probability of exceeding 50 cases. Of those, 13 local authorities have at least a 75% probability of exceeding 100 cases and one (Edinburgh) had a 75% probability of exceeding 500 cases.
- The overall level of wastewater Covid-19 continues to rise, matching the increase seen in case rates. As well as continued high levels in and around Glasgow, Edinburgh and Dundee, levels of WW Covid‑19 are increasing across a broadening range of sites.
Overview of Scottish Government Modelling
Modelling outputs are provided here on the current epidemic in Scotland as a whole, based on a range of methods. Because it takes a little over three weeks on average for a person who catches Covid-19 to show symptoms, become sick, and either die or recover, there is a time lag in what our model can tell us about any re-emergence of the epidemic and where in Scotland this might occur. However modelling of Covid-19 deaths is an important measure of where Scotland lies in its epidemic as a whole. In addition, the modelling groups that feed into the SAGE consensus use a range of other data along with deaths in their estimates of R and the growth rate. These outputs are provided in this research findings. The type of data used in each model to estimate R is highlighted in Figure 1.
We use the Scottish Contact Survey (SCS) to inform a modelling technique based on the number of contacts between people. Over time, a greater proportion of the population will be vaccinated. This is likely to impact contact patterns and will become a greater part of the analysis going forwards.
The logistical model utilises results from the epidemiological modelling, principally the number of new infections. The results are split down by age group, and the model is used to give a projection of the number of people that will go to hospital, and potentially to ICU. This will continue to be based on both what we know about how different age groups are affected by the disease and the vaccination rate for those groups.
What the modelling tells us about the epidemic as a whole
The various groups which report to the Scientific Pandemic Influenza Group on Modelling (SPI-M) use different sources of data in their models (i.e. deaths, hospital admissions, cases) so their estimates of R are also based on these different methods. SAGE's consensus view across these methods, as of 2nd June, was that the value of R in Scotland was between 1.2 and 1.4 (see Figure 1). This has increased from the range of 1.1 to 1.3 last week[1].
Source: Scientific Advisory Group for Emergencies (SAGE).
The various groups which report to the Scientific Pandemic Influenza Group on Modelling (SPI-M) use different sources of data in their models to produce estimates of incidence (Figure 2). SPI-M's consensus view across these methods, as of 9th June, was that the incidence of new daily infections in Scotland was between 16 and 41 new infections per 100,000. This is an increase since last week. This equates to between 900 and 2,200 people becoming infected each day in Scotland.
Source: Scientific Pandemic Influenza Group on Modelling (SPI-M).
The consensus from SAGE for this week is that the growth rate in Scotland is between 3% and 6% per day. This is an increase in the range from 2nd June.
What we know about how people's contact patterns have changed
Average contacts have increased by 10% in the last two weeks (comparing surveys pertaining to 13th – 19th May and 27th May - 2nd June) with a current level of 4.6 daily contacts as seen in Figure 3. Contacts within the work and school setting have increased, 22% and 20% respectively in comparison to two weeks prior and contacts within the other setting (contacts outside of those in the home, school and work) have increased slightly by 8%. Contacts within the home setting remain at similar levels over the same period.
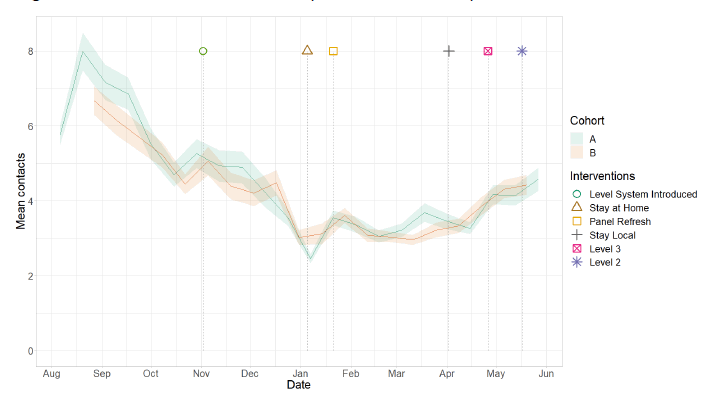
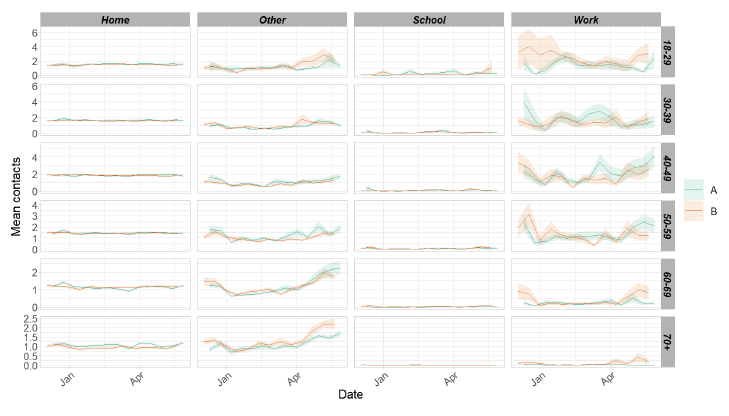
Figure 4 shows how contacts change across age group and setting. All age groups have increased their contacts or remained at a similar level compared to two weeks prior. The increases were largely driven by contacts within the work setting for those aged under 50 and by contacts within the home or other setting for those over 50.
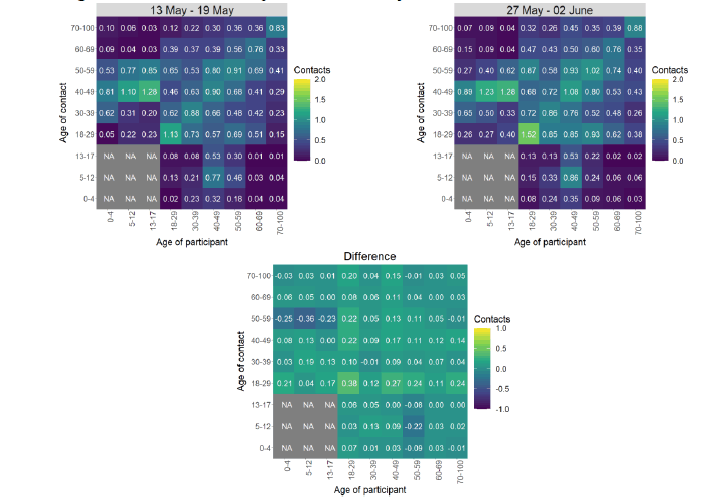
The heatmaps in Figure 5 show the mean overall contacts between age groups for the weeks relating to 13th –19th May and 27th May - 2nd June and the difference between these periods. There has been a rise in interactions with those aged between 18-29 with all other age groups, with the biggest increase in interactions seen between those aged 18-29 with each other.
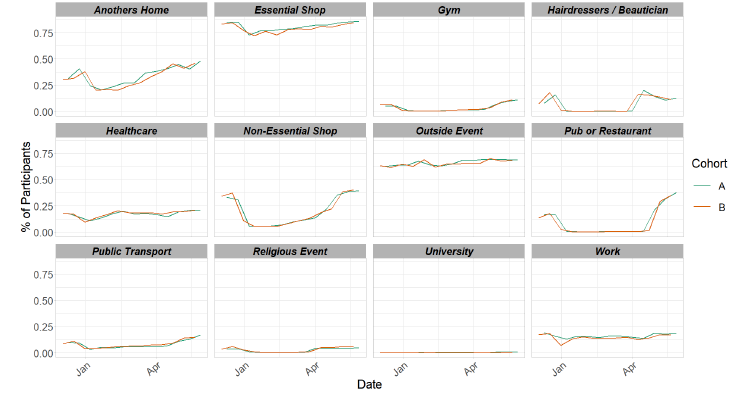
The biggest increase in the proportion of participants visiting different locations is seen in those visiting another's home in Figure 6. This has increased from 40% to 48% in the last two weeks, followed by visiting a pub or restaurant, increasing from 32% to 38%
Vaccinations and contacts patterns
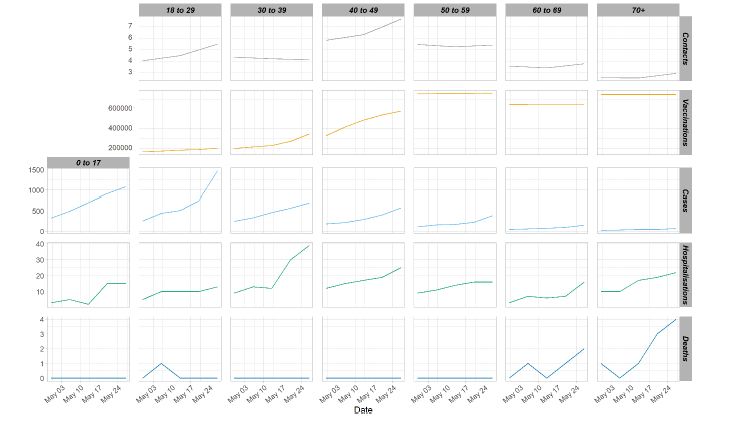
From Figure 7, it can be seen that where contacts have increased or remained level, there has been a steady increase in cases, particularly for the younger age groups and a recent uptick in deaths in the oldest age groups. Covid-19 hospitalisations numbers have also increased all age groups.
What the modelling tells us about estimated infections as well as Hospital and ICU bed demand
The Scottish Government assesses the impact of Covid-19 on the NHS in the next few weeks in terms of estimated number of infections. Figure 8 shows two projections, which take account of new variants (little impact for 'Better' and high impact for 'Worse')[4], as well as the recent increase in infections observed in the last two weeks.
These projections have not been cross-checked against other medium‑term projections produced by modelling groups for SPI-M, which should be taken into account when considering the projections.
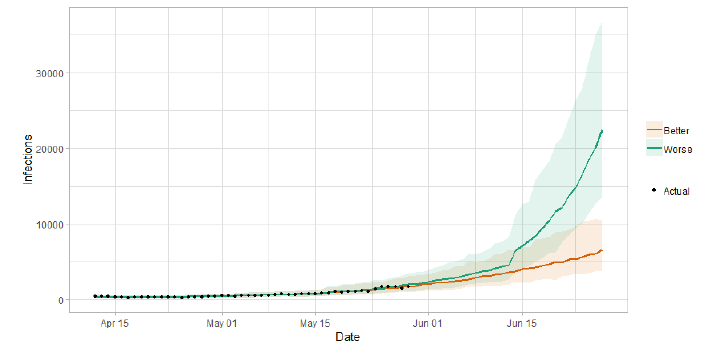
Figure 9 shows the impact of the projections on the number of people in hospital. The modelling includes all hospital stays, whereas the actuals only include stays up to 28 days duration that are linked to Covid-19. Work is ongoing to show the modelled occupancy for stays up to a 28 day limit.
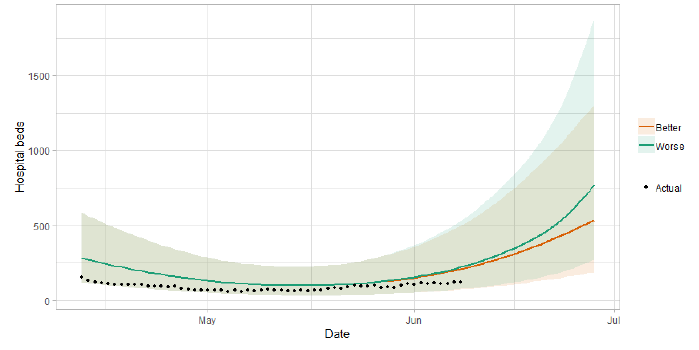
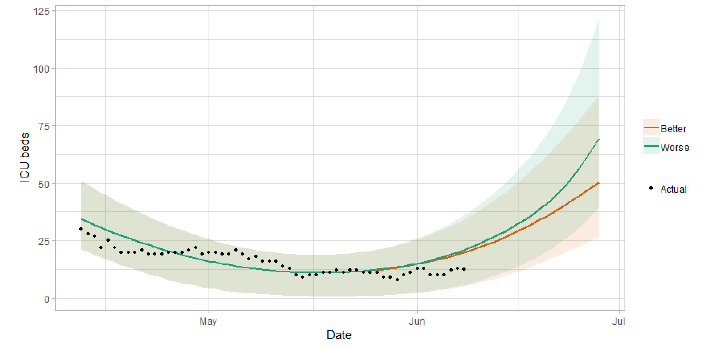
Figure 10 shows the impact of the projection on ICU bed demand.
A comparison of the actual data against historical projections is included in the Technical Annex.
What the modelling tells us about projections of hospitalisations and deaths in the medium term
SAGE produces projections of the epidemic[7] (Figure 11), combining estimates from several independent models (including the Scottish Government's logistics modelling, as shown in Figures 8-10). These projections are not forecasts or predictions. They represent a scenario in which the trajectory of the epidemic continues to follow the trends that were seen in the data up to 31 May.
Modelling groups have used data from contact surveys, previous findings[8] and their own expert judgement and evidence from Public Health England, Scottish universities, Public Health Scotland and other published studies to incorporate recent relaxations on transmission and when making assumptions about vaccine effectiveness.
The projections do not include the effects of any other future policy or behavioural changes.
The delay between infection, developing symptoms, the need for hospital care, and death means they will not fully reflect the impact of behaviour changes in the two to three weeks prior to 31 May. Projecting forwards is difficult when the numbers of cases, admissions and deaths fall to very low levels, which can result in wider credible intervals reflecting greater uncertainty. The interquartile range can be used, with judgement, as the projection from which estimates may be derived for the next four weeks, albeit at lower confidence than the 90% credible interval.
These projections include the potential impact of vaccinations over the next four weeks.
Beyond two weeks, the projections become more uncertain with greater variability between individual models. This reflects the large differences that can result from fitting models to different data streams, and the influence of small deviations in estimated growth rates and current incidence.
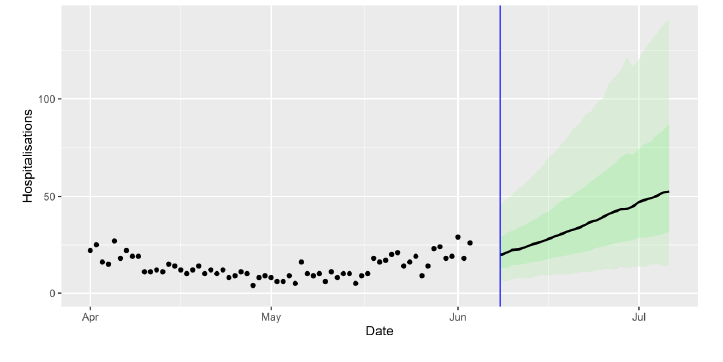
We are not projecting the numbers of people expected to die with Covid‑19 this week. The number of daily deaths has fallen to very low levels over recent weeks. Projecting forwards is difficult when numbers fall to very low levels, therefore SPI-M-O have decided to pause producing medium term projections for daily deaths in Scotland. SPI‑M‑O's consensus view is that the number of deaths will remain very low over the next four weeks.
What we know about who is testing positive with Covid
The Early Pandemic Evaluation and Enhanced Surveillance of Covid‑19 (EAVE) II Study Group[9] has updated the pattern of demographics, clinical risk groups and vaccination status for those who tested positive in Scotland (see Technical Annex in issue 34 of the Research Findings).
This data is based on the evidence presented to SPI-M on 2nd June.
The testing data are linked to the EAVE study data of GP clinical conditions for a clinical and demographic description of the individuals testing positive with the S Gene deletion (a proxy for the alpha variant) in comparison to those who do not have this deletion (a proxy for the delta variant). The laboratory data and GP data are then linked to hospital admissions and deaths.
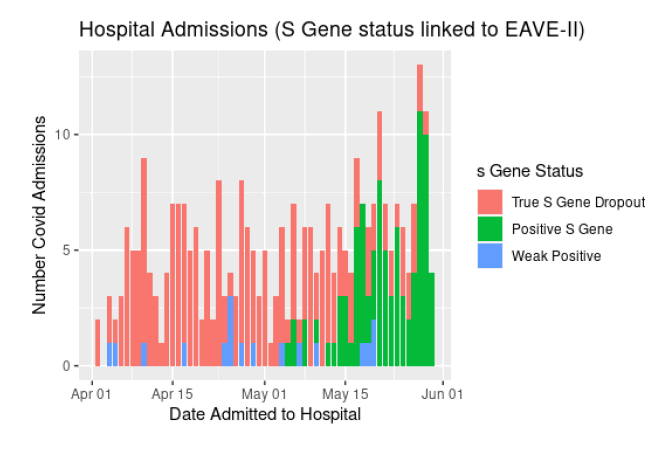
Genomic sequencing shows that most S gene positive cases are the delta variant. Findings indicate that hospital admissions in Scotland are now dominated by delta cases. Figure 12 shows how these cases came to be the majority in the last two weeks of May.
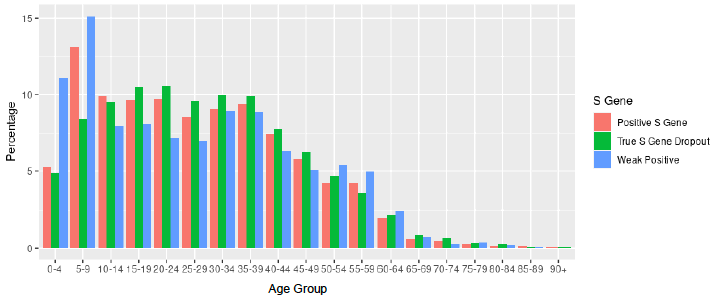
Delta variant cases[10] have slight demographic differences to alpha[11] cases. As shown in Figure 13, there is a greater proportion with the delta variant in the 5-9 year age group.
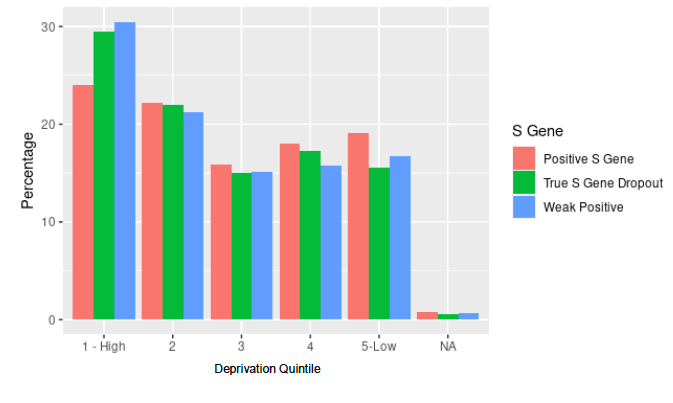
There are also indications that a greater proportion of delta variant cases are from the least deprived group (see Figure 14).
In summary, delta cases have slight demographic differences to alpha (less deprived, slightly more in the 5 to 9 age group). Hospital admissions are few but increasing, and are now dominated by cases associated with the delta variant. There is evidence of a higher risk of hospitalisation associated with delta variant cases, but in this cohort vaccination reduces the risk of hospitalisation.
What we know about which local authorities are likely to experience high levels of Covid-19 in two weeks' time
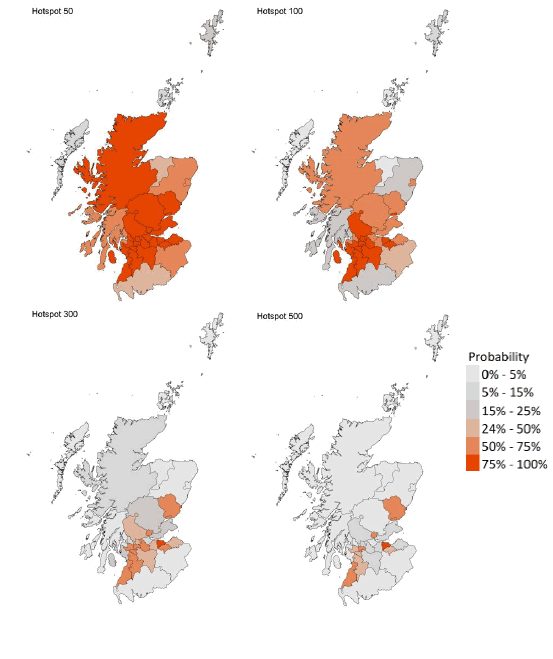
We continue to use modelling based on Covid-19 cases and deaths from several academic groups to give us an indication of whether a local authority is likely to experience high levels of Covid-19 in the future. This has been compiled via SPI-M into a consensus. In this an area is defined as a hotspot if the two week prediction of cases (positive tests) per 100K population is predicted to exceed a threshold, e.g. 500 cases.
Modelled rates of positive tests per 100K (Figure 15) indicate that for the week commencing 20 June 2021, there are 22 local authorities with at least a 75% probability of exceeding 50 cases. Of these, 13 local authorities have at least a 75% probability of exceeding 100 cases (Edinburgh, Dundee, East Ayrshire, East Dunbartonshire, East Renfrewshire, Glasgow, Midlothian, North Ayrshire, North Lanarkshire, Renfrewshire, South Ayrshire, South Lanarkshire and Stirling).
Edinburgh has at least a 75% probability of exceeding 500 cases[12].
What can analysis of wastewater samples tell us about local outbreaks of Covid-19 infection?
Levels of Covid-19 RNA in wastewater collected at a number of sites around Scotland are adjusted for population and local changes in intake flow rate and compared to daily 7-day average positive case rates derived from Local Authority and Neighbourhood (Intermediate Zone) level aggregate data. See Technical Annex in Issue 34 of these Research Findings for the methodology.
Nationwide, wastewater (WW) Covid-19 levels continue to rise, matching the rise in case rates. As well as continued high levels in and around Glasgow, Edinburgh and Dundee, levels of WW Covid-19 and cases are increasing across a broadening range of sites.
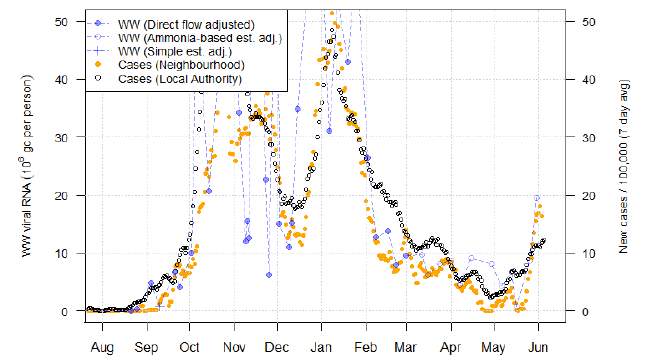
Figure 16 shows the national aggregate for the original 28 sites with long-term records (in blue) and, from January 2021, the aggregate for the full set of up to 108 currently sampled sites (in green). This aggregate shows a continued rise in WW COVID-19 to around 15 million gene copies per person per day (Mgc/p/d), matching the rising rate of new cases and being similar to the levels last seen at the end of February, and to the rising levels at the start October 2020
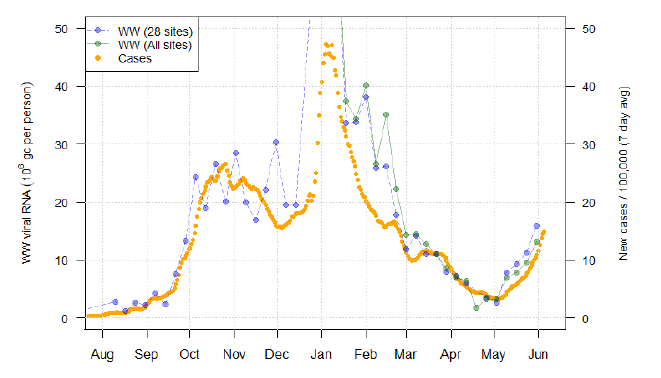
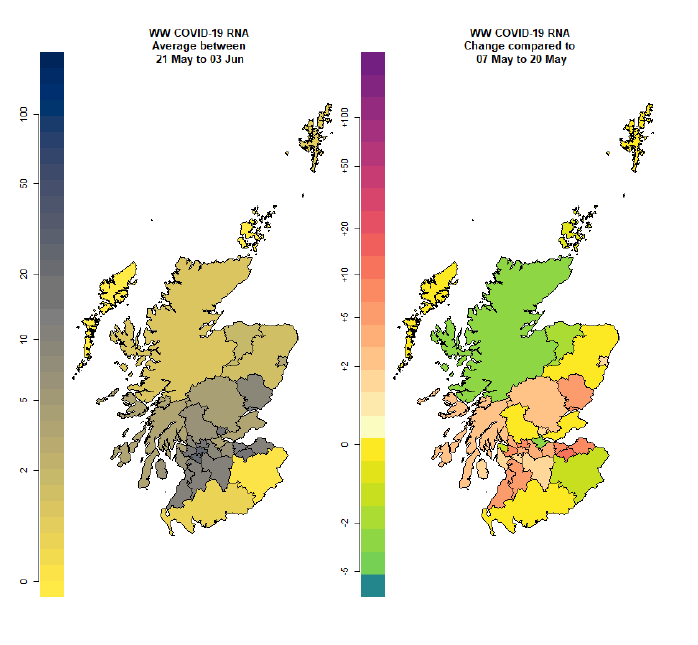
Figure 17 shows the main increases in wastewater Covid-19 levels are concentrated in the central belt, with particularly high increases near Glasgow, Edinburgh, and Dundee. These maps use colours to show (i) the Local Authority average viral Covid-19 levels (in Mgc/p/d) over the 2 week period from 21st May to 3rd June, and (ii) in absolute terms the change in viral Covid-19 levels compared to the previous two week period 7th to 20th May. Darker, or warmer, colours show high levels of virus or large increases in virus respectively.
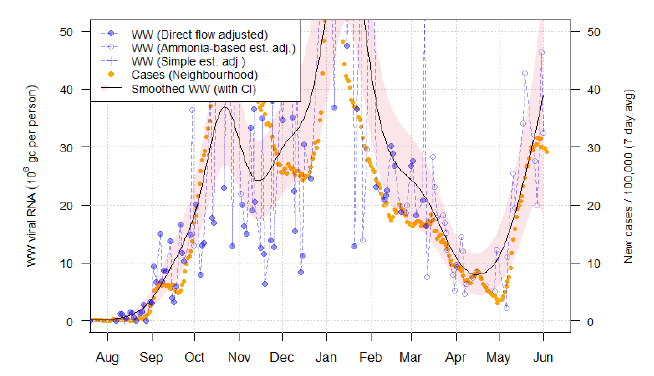
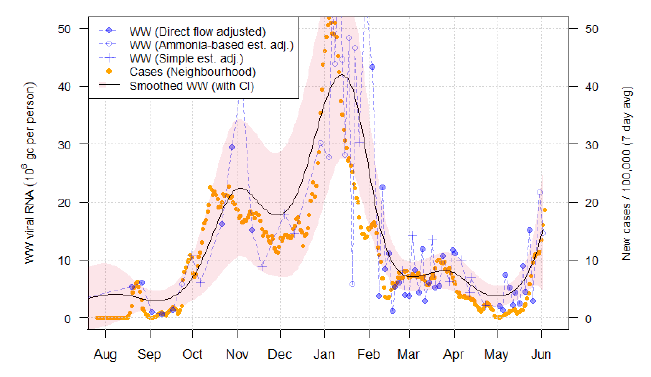
Virus levels at sites in and around Glasgow, such as Shieldhall (Figure 18), continue to increase. Although cases there now appear to be levelling out, this effect is not yet clear in the wastewater measurements, in part due to the variability from this site. In other locations with large populations, like Seafield in Edinburgh and Hatton in Dundee City (Figure 19), levels are also climbing rapidly. A much smaller increase can be seen at Nigg in Aberdeen city, reaching around 5 Mgc/p/day. This may precede a greater rise to come.
In smaller sites further away from large cities, increases in WW Covid-19 and cases are now underway, albeit starting in late May than the start of May as occurred in Glasgow (Figure 18). Examples include Philipshill in Lanarkshire and St Andrews in Fife (Figures 20 and 21). In the case of St Andrews, the increase seems to have been detected first in the wastewater. A similar increase can be seen in Cumnock in Ayrshire.
In some locations, cases are up while WW Covid-19 have not risen. One example is Maybole in Ayrshire. It is unclear whether this is due to a delayed response in the WW signal, or due to other factors relating to the small size of the site (population 4k).
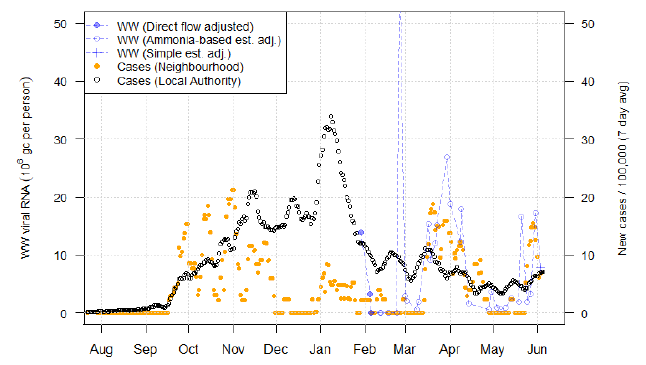
Advancements in detection and interpretation practices allow us to identify when outlying results are anomalous rather than indicators of spikes in Covid-19 levels. Table 2 in the Technical Annex provides population weighted daily averages for normalised WW Covid-19 levels both with and without the outliers removed. It is worth noting that the Dunblane site near Stirling, which registered a very high reading last week, has subsequently provided several much lower readings. This confirms the identification of that reading as anomalous by the new algorithm; although the measurement was probably an over-estimate of Covid-19 levels at the time, it is highly likely that there was Covid‑19 in the wastewater.
What next?
The Scottish Government continues to work with a number of academic modelling groups to develop other estimates of the epidemic in Scotland.
The modelled estimates of the numbers of new cases and infectious people will continue to be provided as measures of the epidemic as a whole, along with measures of the current point in the epidemic such as Rt and the growth rate. Further information can be found at https://www.gov.scot/coronavirus-covid-19.
We may report on exceedance in future weeks when the background levels of Covid-19 reduces so that it can be useful in identifying outbreaks.