Coronavirus (COVID-19): Justice Analytical Services data report- October 2021
This pack provides information on the impact of COVID-19 on the Justice system during October 2021.
Data has been gathered from a number of different sources and may be subject to future revision.
Recorded Crime in Scotland
The recorded crime figures presented below exclude crimes recorded under the coronavirus legislation.
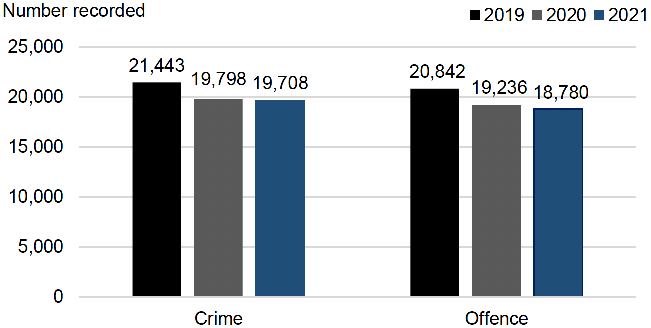
Note: Each set of columns shows from left to right, October 2019, 2020 and 2021
October 2021
The number of crimes reco rded in October 2021 was relatively unchanged than in October 2020 and 8% lower than in October 2019. The number of offences was 2% lower compared to October 2020 and 10% lower than in October 2019.
Non-sexual crimes of violence were 21% higher (or 161 crimes) compared to October 2020, increasing from 780 to 941 crimes, and 11% higher compared to October 2019 (increasing from 848 crimes). Within this, Attempted murder and serious assault decreased by 1% compared to October 2020 (from 290 to 287). Other violence increased by 89% compared to October 2020 (from 178 to 337) and also increased by 108% from October 2019 (from 162 to 337). The increase in Other violence between October 2020 and October 2021 was due to rises in Drugging (from 2 to 119 crimes) and Threats and extortion (from 82 to 147 crimes). The rise in Drugging is likely due to cases of "spiking", whereas the recently published National Statistics bulletin estimated that more than three-quarters (77%) of Threats and extortion recorded in 2020-21 were cyber-crimes. Crimes under the Domestic Abuse (Scotland) Act 2018 decreased by 1% compared to October 2020 (from 146 to 144), and were 13% lower than in October 2019 (decreasing from 165 to 144).
Sexual crimes were 12% higher (or 128 crimes) compared to last October, increasing from 1,093 to 1,221 crimes. This was also 8% higher than in October 2019 (increasing from 1,134 crimes). Sexual assault saw the largest increase since October 2020, increasing by 29% (from 336 to 434). This was almost unchanged compared to October 2019 (from 435 to 434). Rape and attempted rape decreased by 4% compared to October 2020, from 215 to 207 crimes, but this was also a 2% increase compared to October 2019 (from 202 to 207 crimes). Other sexual crimes increased by 6% (from 539 to 570) compared to October 2020 and increased by 17% (from 486 to 570) compared to October 2019. The rise in Other sexual crimes since 2019 was driven by crimes including Communicating indecently, Coercing a person into being present/looking at sexual activity, Disclosure of intimate images and Voyeurism. Research published in the recent 2020-21 Recorded Crime National Statistics showed that the majority of these crimes are likely to be cyber-crimes.
Fire-raising, vandalism etc. was 2% higher (or 63 crimes) compared to October 2020, increasing from 3,735 to 3,798 crimes, but was 11% lower than October 2019. Vandalism etc. has risen 4% since October 2020 (increasing from 3,470 to 3,606). This is 10% lower than October 2019 levels.
Crimes of dishonesty were 3% higher (or 283 crimes) compared to October 2020, increasing from 8,406 to 8,689 crimes. This was 9% lower than in October 2019 (decreasing from 9,571 crimes). Crimes of Fraud have increased throughout the pandemic. There was a 5% increase since October 2020 (from 1,506 to 1,582), and a 71% increase since October 2019 (from 927 to 1,582). The Changes in levels of recorded fraud section in the monthly crime publication provides users with further background on what may be contributing to this change. Other theft has been the biggest contributor (by volume) to the increase since 2020 having risen by 7% compared to October 2020 (from 3,066 to 3,287 crimes), but was 11% lower when compared to October 2019.
Other crimes were 13% lower (or 725 crimes) than in October 2020, decreasing from 5,784 to 5,059 crimes. This is also 10% lower than October 2019 (decreasing from 5,631 to 5,059 crimes). The main contributors to these decreases were Drugs (which fell by 18% compared to October 2020 and 26% compared to October 2019) and Crimes against public justice (which fell by 7% compared to October 2020 but were 16% higher compared to October 2019).
The following chart shows a breakdown of the crime and offence groups, comparing October 2019, 2020 and 2021
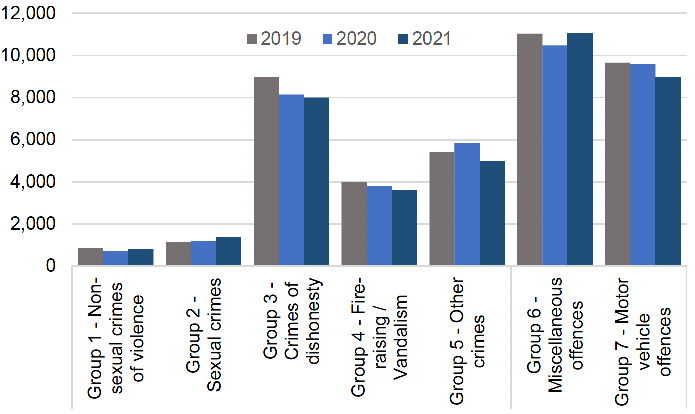
Note: each category shows columns from left to right for October 2019, 2020 and 2021
The biggest decreases from October 2020 to October 2021 were Drugs and Crimes against public justice.
The biggest decreases over this period were:
Drugs
↓ 18% (or 489 crimes)
↓ 26% (or 818 crimes) compared to October 2019
Crimes against public justice
↓ 7% (or 147 crimes)
↑ 16% (or 263 crimes) compared to October 2019
The biggest increases from October 2020 to October 2021 (by volume) were:
Other violence
↑ 89% (or 159 crimes)
↑ 108% (or 175 crimes) compared to October 2019
Other theft
↑ 7% (or 221 crimes)
↓ 11% (or 394 crimes) compared to October 2019
Further Information:
The data in this section comes from the monthly Official Statistics on crimes and offences recorded by the police in Scotland during the COVID-19 pandemic. For more information, please see Recorded Crime in Scotland: October 2021.
Coronavirus legislation intervention activity
This information is drawn from Police Scotland's 'Coronavirus Interventions' application, which relies on manual input from Police Officers. Due to this manual input, these figures should be viewed as indicative only.
This system currently provides the broadest picture of the differing levels of co-operation experienced by Police across Scotland.
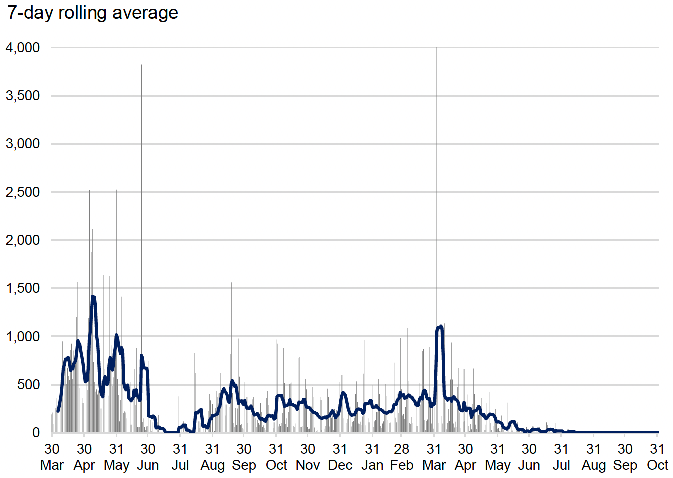
The use of interventions remains at almost zero in October 2021, with only one case recorded (compared to 2 in September). This will likely be due to the lifting of restrictions.
In October, the single intervention was an FPN. Throughout the pandemic, the majority of interventions have been dispersals.
Further Information:
A full breakdown of interventions is available from Police Scotland.
Police Recorded Domestic Abuse Incidents
The number of Domestic Abuse incidents recorded in October 2021 was higher than the level seen in October 2020 and October 2019.
These updates (including the proportion with a crime or offence) will be reflected in future editions of the Official Statistics on Domestic Abuse in Scotland. The most recent edition covers the 2019-20 reporting year.
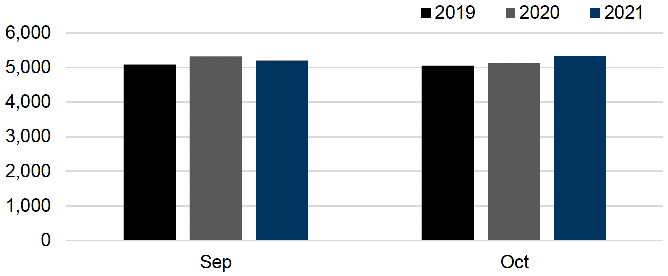
In October 2021:
5,325 Domestic incidents recorded
Up 4% since October 2020 (5,129 incidents)
Up 4% since October 2019 (5,055 incidents)
In April to October 2021:
37,314 Domestic incidents recorded
Down 5% since the same months in 2020 (39,235 incidents)
Up 2% since the same months in 2019 (36,744 incidents)
The proportion of April to October 2021 incidents that included the recording of at least one crime or offence was 42.4%, lower than for the equivalent period in 2020-21, at 43.4%.
In addition to the above, separate figures on crimes recorded under the Domestic Abuse (Scotland) Act 2018 are available from the Recorded Crime in Scotland monthly Official Statistics. There were 144 such crimes recorded by the police in October 2021, this is 1% lower than October 2020 (146 crimes) and 13% lower than October 2019 (165 crimes).
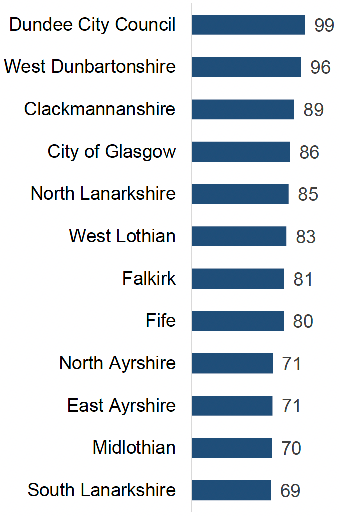
Police Recorded Domestic Abuse Incidents per 10,000 population
Across Scotland as a whole, the police recorded 68 domestic abuse incidents per 10,000 population[1] during the period April to October 2021.
The local authorities with the highest rates were Dundee City (99), West Dunbartonshire (96) and Clackmannanshire (89).
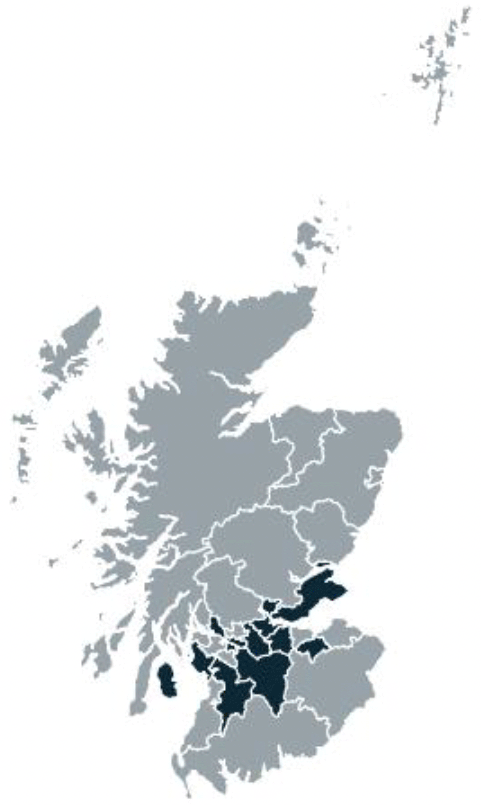
The following map shows local authorities with above the national average (in a darker shading) of Domestic Abuse incidents per 10,000 population, in the period April to October 2021.
Further Information:
The crime data in this section comes from the monthly Official Statistics on crimes and offences recorded by the police in Scotland during the COVID-19 pandemic.
For more information, please see the Monthly Official Statistics on Recorded Crime in Scotland.
Contact
Email: JusticeAnalysts@gov.scot