Commissioner for Fair Access: annual report 2025/26
In the seventh annual report from the Commissioner for Fair Access - and second from the current Commissioner - the Commissioner celebrates the work done so far to make access to higher education fairer, noting that it is now time to pivot and introduce a new phase of work.
3 - The evidence base: on track to achieve fair access by 2030?
First, a reminder of the CoWA Targets is provided (3.1). RoWA evidence is then reviewed, starting with the central CoWA target (3.2), before broadening out to consider the other core CoWA metrics (3.3), and the wider RoWA evidence base (3.4). Moving beyond CoWA/RoWA, key insights are drawn from the Student Finance and Wellbeing Study Scotland report (3.5), the Public Perceptions of Higher Education Funding in Scotland report (3.6) and the wider evidence base (3.7).
3.1 – Introduction to the CoWA Targets
First and foremost, any appraisal of progress should start with the core target/s suggested by CoWA, agreed by the sector, and mandated by the Scottish Funding Council/Scottish Government. These pertain to full-time, Scottish-domiciled, first-time degree entrants at 18 of Scotland’s HEIs,[82] with ‘most deprived backgrounds’ interpreted as those living in one of Scotland’s 20% Most Deprived Areas:
- Interim 2021 Target. By 2021, students from the 20% most deprived backgrounds should represent at least 16% of full-time first degree entrants to Scottish universities as a whole.
- Interim 2026 Target. By 2026, students from the 20% most deprived backgrounds should represent at least 18% of full-time first degree entrants to Scottish universities as a whole.
- Final 2030 Target. By 2030, students from the 20% most deprived backgrounds should represent 20% of entrants to higher education. Equality of access should be seen in both the college sector and the university sector.
- Interim 2021 Target and 2022 Action. By 2021, students from the 20% most deprived backgrounds should represent at least 10% of full-time first-degree entrants to every individual Scottish university. In 2022, the target of 10% for individual Scottish universities should be reviewed and a higher-level target should be considered for the subsequent years.
RoWA data are published retrospectively. For example, the ninth RoWA report published in July 2025 presented data for the 2023-24 academic year. Consequently:
- Interim 2021 Target. Evidence from academic year 2021-22 was presented in the seventh RoWA, published in 2023. This target was achieved in advance (2019-20) and has continued to be met/exceeded.
- Interim 2026 Target. Evidence from academic year 2026-27 will be presented in the twelfth RoWA, which will be published in 2028.
Final 2030 Target. Evidence from academic year 2030-31 will be presented in the sixteenth RoWA, which will be published in 2032.
- As discussed in the previous section, the Scottish Government – with the support of Universities Scotland – has adopted my recommendation from 2023 that the targets CoWA proposed for individual HEIs be altered to a ‘stretch’ target that is bespoke for each institution, as opposed to a flat-rate target to be achieved by every institution. Consequently, the interim targets for individual HEIs have been withdrawn.[83]
3.2 - The Central CoWA Target[84]
3.2.1 – Evidence of progress
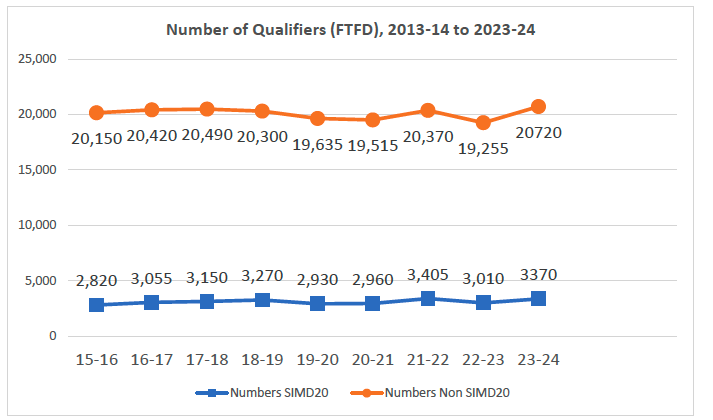
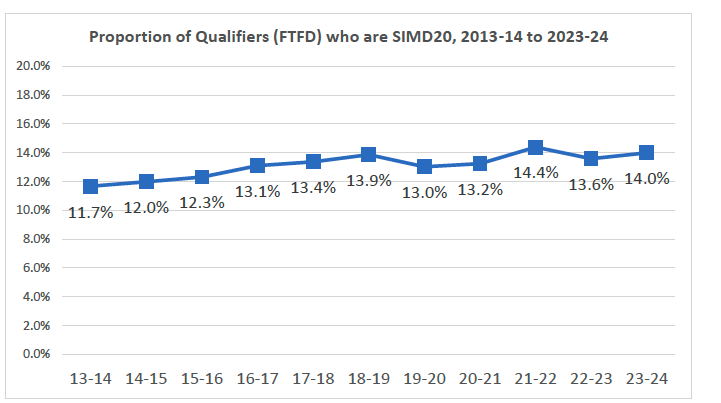
The RoWA for 2023-24 reports an increase in the number (Figure 1) and proportion (Figure 2) of students from SIMD20 areas entering higher education. The 16.7% of entrants from SIMD20 areas matches the highest proportion previously recorded (2020-21) and the number of such entrants (5,445 in 2023-24) is just short of the highest number of such entrants previously recorded (5,595 in 2021-22. It is reasonable to frame these data as the highest proportion and number of SIMD20 entrants outside the exceptional circumstances of entry to higher education during the COVID pandemic.
These data are most welcome following two annual rounds in which the proportion of entrants from SIMD20 areas reduced. The percentage point increase, as reported in the published tables, for 2023-24 (0.4%) is the highest increase for five years (since a 0.5% percentage point increase was reported for 2019-20).[85]
Although there are risks in over-interpreting the significance for trends of a single year of data, there is wider evidence that would suggest that this trajectory will continue in the years ahead.[86] Thus, with three more annual rounds to be reported before the Interim Target for 2026, it is possible that the next target will be met.[87] However, it would be an over-statement to judge this to be probable, as it would require progress at levels that have not been observed in recent years. The same holds for the Final 2030 Target.
3.2.2 - Wider Evidence on the CoWA Target
A further three points should be made in relation to the CoWA target for entrants.
First, as reported in Table 1, five institutions reported their highest ever proportion of entrants from SIMD20 areas in 2023-24,[88] with a further six institutions reporting their highest ever proportion in 2023-24, outside the ‘pandemic years’.[89] Three of the remaining seven institutions attained their highest ever proportion of SIMD20 area entrants during one of the ‘pandemic years’.[90] Recent progress is evident across most institutions.[91]
Second, the number and proportion of care-experienced students continues to increase: 2023-24 marked the seventh annual increase in the number of entrants who are care experienced (620, or 1.9% of all Scottish domiciled, full-time, first-degree entrants in 2023-24).
Third, if a more expansive view of higher education is adopted – one that is grounded on parity of esteem and includes higher education in both FEIs and HEIs – then a much more positive conclusion can be drawn. Although lower than the record number and proportion of entrants pursuing higher education in Scotland in 2020-21,[92] 16,115 (19.2%) of Scottish-domiciled entrants to higher education in FEIs and HEIs in Scotland were drawn from SIMD20 areas in 2023-24.
On the other hand, more progress is required. If each HEI had matched their highest ever proportion of entrants from SIMD20 areas in 2023-24, 17.5% of entrants would have been from one of Scotland’s 20% Most Deprived Areas.[93] This is considerably higher than the 16.7% of entrants that was reported, but still less than the 18% that is the next Interim Target for 2026. Scottish HEIs need to match, and then exceed, their highest ever share of SIMD entrants over the next three rounds of RoWA if the next Interim Target is to be achieved.
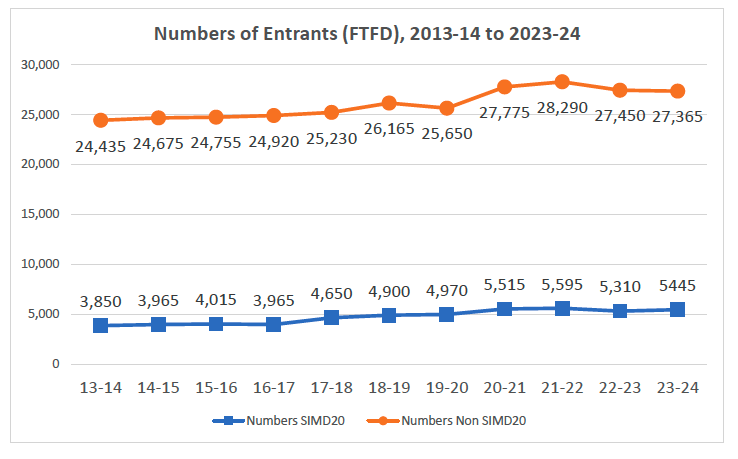
Source: RoWA Background Tables 2023-24: CoWA Table 1 (‘Numbers non-SIMD20’ are author’s calculation – see note below)
Note: Strictly speaking, the numbers of Non SIMD20 is better described as ‘Numbers other than known to be SIMD20’. These data are ‘Total Entrants’ minus ‘% MD20 entrants’ from Table 1 of the RoWA (Scottish domiciled, full-time first-degree entrants). ‘Total entrants’ includes 170 entrants whose SIMD status is unknown, some of whom may be from one of Scotland’s 20% Most Deprived Areas.
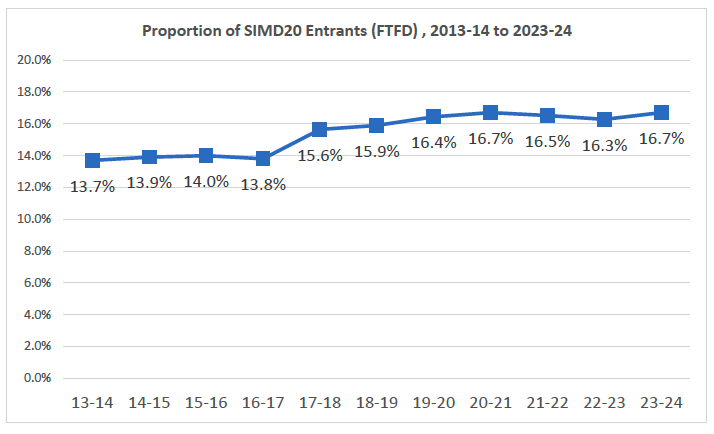
Source: RoWA Background Tables 2023-24: CoWA Table 1
3.3 - The core CoWA metrics
Although not formally presented as a target, the RoWA includes two core metrics in addition to evidence on entrants:
- Retention.[94] The number and proportion of students who progress to a second year of study.
- Qualifiers.[95] The number and proportion of students who completed their studies.
As for the CoWA Target for entrants, 2023-24 marked a return to an increase in rates of retention of students from SIMD20 areas, following two rounds in which retention rates had dropped. Although this is to be welcomed, the reduction in retention was more marked (to 2020-21 and 2021-22) than the recovery in 2023-24: retention rates are lower than at any time before 2022-23 (Figure 3). Although these trends are not unique to those from SIMD20 areas, the retention gap has widened in recent years (Figure 4). One-in-every-seven entrants from SIMD20 areas in 2022-23 did not return to study in 2023-24. As Table 2 in this report highlights, one-half of HEIs recorded their lowest level of retention for SIMD20 entrants in the last two years.
Trends for CoWA Qualifiers replicate the trends for entrants and retention in that there was a return to progress in 2023-24, although not quite to the levels reached beforehand: 3,370 qualifiers were from SIMD20 areas in 2023-24, comprising 14% of all qualifiers (Figure 5). The cumulative effect of attrition (Figure 3 and 4, and Table 2) results in a significant gap between SIMD20 entrants and SIMD20 qualifiers (compare Figure 1 and Figure 5). On the other hand, and as for entrants, there is evidence of recent progress at the level of individual institutions, with one-half reporting the highest ever proportion of qualifiers from SIMD20 areas in 2023-24 (Table 3).
Pandemic experiences may have impacted on progression (retention) and success (qualification). However, ‘pandemic years’ differs across entry, retention and progression:
- 2019-20 is not a ‘pandemic year’ for entry as decisions were made prior to the start of the pandemic. It should be considered a ‘pandemic year’ for retention and qualification, as experiences in higher education will have been influenced by pandemic restrictions.
- 2020-21 is a ‘pandemic year’ for entry (as grades that determined entry were based on Alternative Certification Models), and for retention and qualification.
- 2021-22 – as for 2020-21.
- 2022-23 is a ‘pandemic year’ for entry (as grades that determined entry were partly based on Alternative Certification Models), but not for retention and qualification (as delivery of education was not directly impacted by pandemic restrictions).
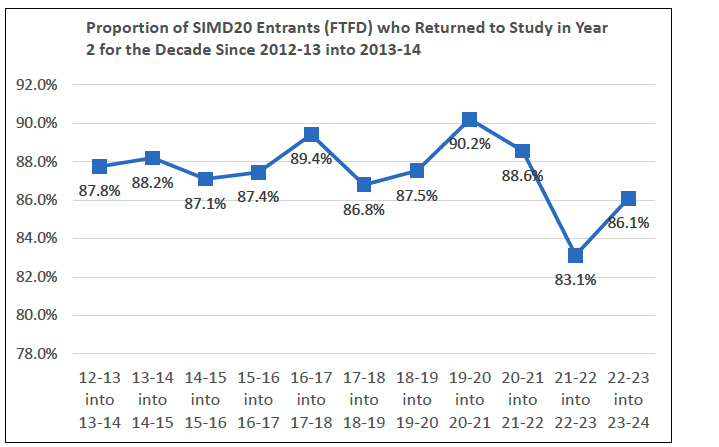
Source: RoWA Background Tables 2023-24: CoWA Table 2
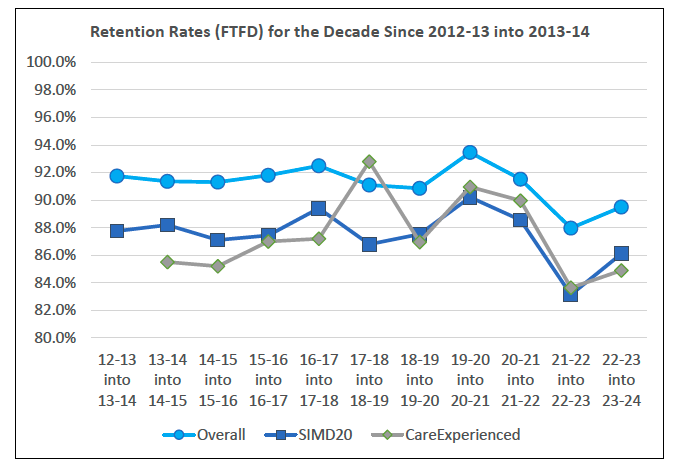
Source: RoWA Background Tables 2023-24: CoWA Table 2
| University | 13-14 | 14-15 | 15-16 | 16-17 | 17-18 | 18-19 | 19-20 *** | 20-21 *** | 21-22 *** | 22-23 | 23-24 |
|---|---|---|---|---|---|---|---|---|---|---|---|
| Aberdeen, University of | 92.0% | 88.4% | 86.5% | 94.6% | 89.5% | 97.1%* | 93.5% | 95.2% | 94.8% | 86.1%** | 91.1% |
| Abertay University | 96.3%* | 88.4% | 84.7% | 73.5%** | 86.5% | 81.5% | 79.5% | 80.9% | 77.6% | 78.8% | 79.7% |
| Dundee, University of | 90.1% | 90.3% | 89.7% | 89.5% | 88.8% | 92.6%* | 91.7% | 91.3% | 92.0% | 85.0%** | 88.8% |
| Edinburgh Napier University | 90.9%* | 88.6% | 84.0% | 84.9% | 84.8% | 87.0% | 88.6% | 86.1% | 87.6% | 79.4%** | 83.5% |
| Edinburgh, University of | 85.5%** | 91.0% | 91.3% | 88.1% | 94.4%* | 90.6% | 88.1% | 94.2% | 92.9% | 87.8% | 89.6% |
| Glasgow Caledonian University | 90.3% | 90.6% | 88.4% | 92.5% | 90.5% | 89.6% | 88.7% | 92.8%* | 89.4% | 86.8%** | 89.3% |
| Glasgow School of Art | 100%* | 100%* | 97.5% | 92.6% | 97.6% | 92.9% | 95.1% | 94.2% | 96.4% | 89.2%** | 94.0% |
| Glasgow, University of | 92.9% | 90.8% | 88.7% | 90.2% | 91.0% | 84.1%** | 89.7% | 92.6% | 94.5%* | 86.4% | 88.6% |
| Heriot-Watt University | 92.3%* | 87.5% | 85.2% | 86.4% | 85.3% | 84.8% | 84.3% | 87.0% | 90.4% | 86.0% | 83.9%** |
| Queen Margaret University, Edinburgh | 86.0% | 87.5% | 76.3%** | 90.3% | 84.4% | 86.2% | 93.2% | 87.0% | 90.0% | 83.6% | 89.0% |
| Robert Gordon University | 90.4% | 91.1%* | 88.8% | 90.0% | 90.7% | 89.2% | 88.3% | 84.5% | 87.3% | 82.7%** | 90.4% |
| Royal Conservatoire of Scotland | 100%* | 100%* | 90.9% | 94.7% | 100%* | 94.4% | 90.0% | 92.0% | 96.3% | 96.0% | - |
| St Andrews, University of | 94.4% | 100%* | 91.4%** | 100% | 100%* | 97.6% | 97.3% | 95.9% | 95.3% | 94.4% | 94.3% |
| Stirling, University of | 88.5% | 93.5%* | 93.4% | 88.7% | 91.6% | 83.3%** | 87.0% | 91.8% | 88.7% | 84.3% | 87.3% |
| Strathclyde, University of | 91.0% | 89.1% | 89.4% | 84.9%** | 91.1% | 86.6% | 89.3% | 91.1%* | 90.2% | 85.5% | 85.5% |
| SRUC | 73.3%** | 83.3% | 87.5% | 90.9% | 76.5% | 90.5% | 90.0% | 93.3%* | 77.4% | - | 80.6% |
| Highlands and Islands, Univ. of the | 87.9% | 78.7% | 87.3% | 88.1%* | 83.7% | 86.0% | 80.3% | 80.3% | 83.3% | 76.5% | 69.9%** |
| West of Scotland, University of the | 79.0% | 81.9% | 83.1% | 84.8% | 88.5% | * | 84.1% | 89.1%* | 83.8% | 76.5%** | 81.1% |
Legend
* Highest proportion
** Lowest proportion
*** ‘Pandemic years’ for retention
Source: RoWA Background Tables 2023-24: CoWA Table 2A (author added highlighting)
| University | 2013-14 | 14-15 | 15-16 | 16-17 | 17-18 | 18-19 | 19-20 *** | 20-21 *** |
21-22 *** |
22-23 | 2023-24 |
|---|---|---|---|---|---|---|---|---|---|---|---|
| Aberdeen, University of | 3.0% | 2.9% | 3.0% | 3.6% | 3.0% | 3.4% | 3.6% | 5.2%** | 4.4% | 6.2% | 6.5%* |
| Abertay University | 12.6% | 14.3% | 12.8% | 12.0% | 15.2% | 16.4%* | 13.9% | 15.7% | 15.9%** | 14.4% | 15.3% |
| Dundee, University of | 8.3% | 8.8% | 9.0% | 12.1% | 12.2% | 12.5% | 14.3% | 13.4% | 15.4%** | 13.3% | 14.6%* |
| Edinburgh Napier University | 9.8% | 9.9% | 9.4% | 11.3% | 9.4% | 9.8% | 10.1% | 9.9% | 11.1%** | 13.6%* | 11.1% |
| Edinburgh, University of | 3.2% | 4.3% | 4.0% | 4.5% | 4.9% | 5.4% | 5.8% | 6.5% | 7.6%** | 8.2%* | 7.9% |
| Glasgow Caledonian University | 18.8% | 19.2% | 20.9% | 20.7% | 21.1% | 22.4%* | 21.7% | 20.6% | 21.5% | 20.8% | 19.8% |
| Glasgow School of Art | 8.5% | 6.4% | 8.2% | 11.0% | 19.3% | 19.3% | 15.0% | 15.7% | 18.2%** | 22.8%* | 21.6% |
| Glasgow, University of | 9.0% | 9.2% | 9.2% | 11.4% | 10.7% | 10.2% | 10.0% | 10.3%** | 10.3%** | 10.2% | 12.4%* |
| Heriot-Watt University | 9.4% | 7.4% | 8.1% | 6.5% | 8.8% | 9.9%* | 8.5% | 11.3%** | 9.0% | 8.0% | 9.9%* |
| Highlands and Islands, Univ. of the | 6.0% | 9.2% | 9.8% | 10.2%* | 6.3% | 7.5% | 10.4% | 7.0% | 10.8%** | 8.7% | 9.9% |
| Queen Margaret University, Edinburgh | 9.7% | 8.6% | 11.5% | 11.2% | 6.6% | 10.6% | 10.1% | 12.4%** | 11.1% | 11.8% | 13.7%* |
| Robert Gordon University | 4.7% | 4.9% | 5.6% | 5.5% | 4.4% | 5.3% | 5.4% | 5.4% | 6.4%** | 6.5%* | 5.3% |
| Royal Conservatoire of Scotland | 8.0% | 7.0% | 9.7% | 6.3% | 10.3% | 13.6% | 10.9% | 16.5%** | 11.0% | 23.5%* | 13.0% |
| SRUC | 10.0% | 5.8% | 8.3% | 3.8% | 7.0% | 13.2%* | 8.3% | 7.3% | 9.4%** | 8.5% | 8.1% |
| St Andrews, University of | 2.0% | 2.4% | 4.1% | 5.4% | 4.4% | 5.2% | 3.4% | 6.3% | 10.5%** | 6.5% | 9.5%* |
| Stirling, University of | 9.6% | 10.1% | 10.1% | 10.7% | 12.2% | 10.8% | 11.6% | 13.1% | 14.4%** | 12.9%* | 12.6% |
| Strathclyde, University of | 10.9% | 9.5% | 11.4% | 10.8% | 11.9% | 12.1% | 13.0% | 13.9% | 16.6%** | 16.1% | 18.1%* |
| West of Scotland, University of the | 24.4% | 25.3% | 24.2% | 25.7% | 27.2%* | 26.9% | 28.5%** | 26.5% | 27.6% | 24.7% | 27.0% |
Legend
* Highest proportion (outside the ‘pandemic years’)
** Highest proportion (during the ‘pandemic years’)
*** ‘Pandemic years’ for qualification
Source: RoWA Background Tables 2023-24: CoWA Table 3B (author added highlighting)
Source: RoWA Background Tables 2023-24: CoWA Table 3 (non-SIMD data are author’s calculation)
Source: RoWA Background Tables 2023-24: CoWA Table 3
3.4 - The wider RoWA evidence base
The Report on Widening Access provides insight beyond the CoWA target and core CoWA metrics. This evidence is described in full in the RoWA. What follows below avoids unnecessary duplication of RoWA findings: rather, it presents seven additional insights from these RoWA data for 2023-24.
1. There is mixed evidence of progress when multiple SIMD thresholds are appraised.
Most Scottish HEIs reported their highest ever intake of entrants (outside the ‘pandemic years’) from areas with the very highest levels of deprivation (10% Most Deprived Areas) in 2023-24 (Table 4). Over the longer term, there is also no evidence of displacement (increased access for those from the Most Deprived Areas at the expense of those who are from areas that are only marginally less deprived), with increases in the share of entrants from both the 20% Most Deprived Areas and from those from SIMD20-40 Areas since 2013-14 (Table 5).[96]
On the other hand, although the share of entrants from the 20% Most Deprived Areas increased in 2023-24, this followed two rounds in which the share decreased (Table 4). Furthermore, since 2021-22, the share of entrants from the 20-40% Most Deprived Areas has decreased (Table 4). There is a need to monitor future trends to ensure that those who are from areas that are only marginally less deprived (SIMD20-40 areas) have fair access to higher education. Similarly, the share of entrants from the 40-60% Most Deprived Areas has decreased in each of the last three rounds.
Some commentators had raised concern that targeting an increase in entrants from the 20% Most Deprived Areas would be at the expense of those from marginally less deprived areas. However, the most significant increases in share of entrants in the last few years have been from Scotland’s Least Deprived Areas – not from those from the Most Deprived Areas (Table 4).
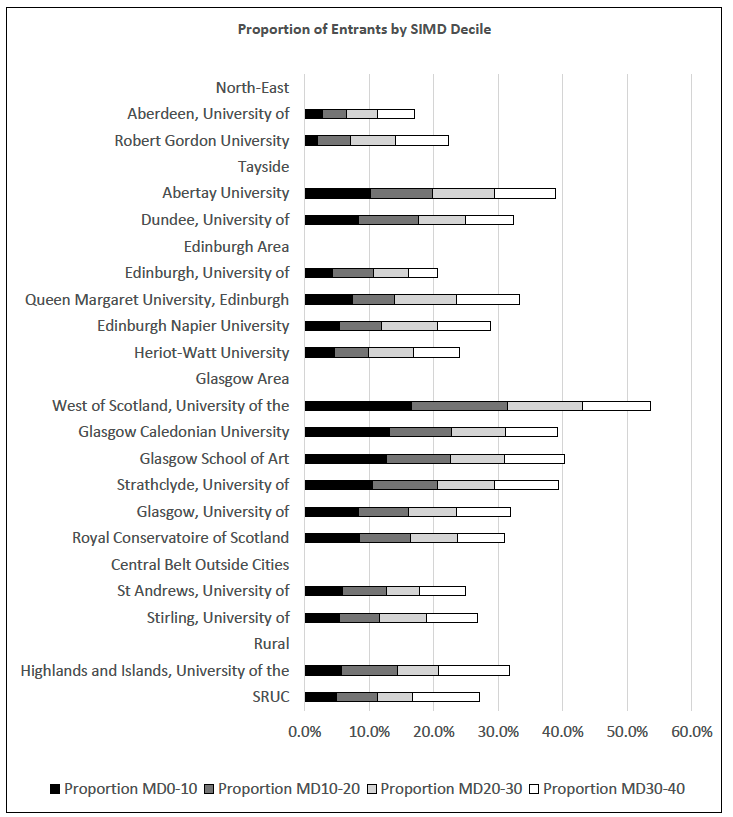
A more granular analysis of SIMD entrant data across HEIs also affirms the importance of a regional perspective. As Figure 7 suggests, there is more similarity than difference in the SIMD profile of entrants across institutions within regions. Figure 7 also confirms the importance of the University of the West of Scotland in facilitating access to higher education for those from disadvantaged areas.
Source: RoWA Background Tables 2023-24: SIMD Decile Table 1B
| SIMD Quintile | 2013-14 | 14-15 | 15-16 | 16-17 | 17-18 | 18-19 | 19-20 | 20-21 *** | 21-22 *** | 22-23 *** | 2023-24 |
|---|---|---|---|---|---|---|---|---|---|---|---|
| SIMD0-20 | 13.7% | 13.9%* | 14.1%* | 13.8%** | 15.6%* | 15.9%* | 16.4%* | 16.7%* | 16.5%** | 16.3%** | 16.7%* |
| SIMD20-40 | 15.2% | 15.9%* | 15.8%** | 15.8% | 16.2%* | 16.1%** | 15.3%** | 16.0%* | 16.8%* | 16.2%** | 16.1%** |
| SIMD40-60 | 18.7% | 18.9%* | 18.8%** | 18.8% | 18.0%** | 18.1%* | 18.2%* | 18.7%* | 18.1%* | 17.5%** | 16.8%** |
| SIMD60-80 | 23.2% | 22.8%** | 22.8% | 22.8% | 21.9%** | 22.1%* | 22.1% | 21.7%** | 22.3%* | 22.5%* | 22.7%* |
| SIMD80-100 | 29.2% | 28.6%** | 28.5%** | 28.8%* | 28.2%** | 27.8%** | 27.9%* | 27.0%** | 26.3%** | 27.5%* | 27.7%* |
Legend
* Increase in population share
Maintenance in population share
** Reduction in population share
*** ‘Pandemic years’ for the purpose of appraising entry
Source: RoWA Background Tables 2023-24: Table 1 (author added highlighting)
| University | 13-14 | 14-15 | 15-16 | 16-17 | 17-18 | 18-19 | 19-20 | 20-21 *** | 21-22 *** | 22-23 *** | 23-24 |
|---|---|---|---|---|---|---|---|---|---|---|---|
| Aberdeen, University of | 1.9% | 1.9% | 1.7% | 1.6% | 1.8% | 1.5% | 3.6%* | 2.8% | 3.4%** | 3.0% | 2.8% |
| Abertay University | 5.9% | 6.3% | 6.5% | 6.6% | 9.3% | 8.0% | 8.4% | 8.1% | 9.2% | 11.6%** | 10.2%* |
| Dundee, University of | 6.0% | 7.1% | 5.4% | 5.6% | 7.4% | 8.1% | 8.4%* | 7.7% | 8.5%** | 7.9% | 8.4%* |
| Edinburgh Napier University | 4.8% | 4.3% | 5.0% | 4.7% | 4.3% | 5.2% | 5.8%* | 5.4% | 6.0%** | 5.3% | 5.3% |
| Edinburgh, University of | 2.6% | 2.7% | 2.5% | 2.7% | 2.8% | 5.0%* | 4.9% | 3.4% | 4.4% | 6.1%** | 4.3% |
| Glasgow Caledonian University | 13.4%* | 11.6% | 13.1% | 12.3% | 13.1% | 12.8% | 12.5% | 13.2%** | 12.0% | 12.3% | 13.2% |
| Glasgow School of Art | 5.9% | 11.0% | 5.9% | 9.7% | 8.5% | 8.5% | 9.8% | 15.5%** | 12.3% | 10.9% | 12.6%* |
| Glasgow, University of | 7.3% | 6.9% | 6.9% | 6.3% | 6.4% | 6.8% | 7.0% | 8.0% | 8.3%** | 7.3% | 8.3%* |
| Heriot-Watt University | 4.0% | 5.2% | 5.1% | 4.2% | 4.3% | 4.2% | 5.3%* | 5.9%** | 4.8% | 3.6% | 4.6% |
| Highlands and Islands, Univ. of the | 3.2% | 5.6% | 2.9% | 2.7% | 3.8% | 4.9% | 4.9% | 4.2% | 5.4% | 6.2%** | 5.7%* |
| Queen Margaret University, | 4.6% | 4.8% | 4.1% | 4.1% | 4.3% | 5.0% | 6.8% | 6.4%** | 5.9% | 5.5% | 7.3%* |
| Robert Gordon University | 2.1% | 2.8% | 3.0%* | 2.4% | 2.5% | 2.1% | 1.9% | 1.9% | 2.1% | 2.7%** | 2.0% |
| Royal Conservatoire of Scotland | 4.1% | 4.7% | 4.8% | 6.7% | 5.9% | 5.3% | 8.5%* | 11.2%** | 6.7% | 7.1% | 8.5%* |
| SRUC | 3.2% | 4.4% | 2.6% | 2.5% | 4.0% | 5.2% | 6.7%* | 6.5%** | 2.2% | 4.9% | 4.9% |
| St Andrews, University of | 1.9% | 2.0% | 0.8% | 1.7% | 3.4% | 4.8% | 4.7% | 4.8% | 6.5%** | 5.9% | 5.8%* |
| Stirling, University of | 4.6% | 6.2% | 5.4% | 5.1% | 6.9% | 6.9% | 6.0% | 6.8%** | 4.8% | 4.7% | 5.4% |
| Strathclyde, University of | 5.7% | 6.7% | 7.1% | 7.7% | 9.1% | 9.4% | 9.6% | 11.9%** | 9.2% | 9.6% | 10.4%* |
| West of Scotland, Univ. of | 13.1% | 14.5% | 14.6% | 16.4% | 17.0% | 14.3% | 15.4% | 15.4% | 17.0%** | 15.3% | 16.5%* |
| Scotland | 6.8% | 6.9% | 7.0% | 7.0% | 7.9% | 7.9% | 8.1% | 8.4%** | 8.2% | 8.0% | 8.4%* |
Legend
* Highest proportion (outside the ‘pandemic years’)
** Highest proportion (the ‘pandemic years’)
*** ‘Pandemic years’ for the purpose of appraising entry
Highest proportion
Highlighting in final column indicates whether the *highest ever proportion was recorded (outside the ‘pandemic years’) or **whether the highest ever proportion was achieved during the ‘pandemic years’.
Source: RoWA Background Tables 2023-24: SIMD Decile Table 1B (author added highlighting)
2. The demographic profile of SIMD entrants varies markedly across institutions.
RoWA also highlights that the profile of entrants from the 20% Most Deprived Areas varies markedly across institutions. In traditional/research intensive universities, entrants from deprived areas tend to be younger (school leavers or recent school leavers), whereas a significantly higher proportion of entrants from deprived areas are older in many of the newer universities (Figure 8). At the extremes, almost 90% of the entrants from the most deprived areas at the Royal Conservatoire of Scotland and the University of Edinburgh in 2023-24 were aged under 21 on entry, whereas at the University of the West of Scotland and Scotland’s Rural College, only slightly more than two-thirds of entrants from the most deprived areas were older than 21. These data highlight that meeting the needs of students from the most deprived areas is likely to present different challenges across institutions.
Source: RoWA Background Tables 2023-24: HESA PI Table (author’s own calculation)
Note 1: HESA data are for full-time undergraduate entrants, rather than full-time, first-degree undergraduate entrants.
Note 2: HESA PI table provides the total of Scottish-domiciled entrants to full-time undergraduate courses at Scottish universities (HEIs), indicating the percentage of these entrants who are from Scotland’s 20% Most Deprived Areas, for both those aged under 21 and 21 and over. From these data, the number of entrants from Scotland’s 20% Most Deprived Areas who are aged under 21 and the number of entrants from Scotland’s 20% Most Deprived Areas who are aged 21 and over can be calculated. The percentage share of entrants aged under 21 are reported in this Figure.
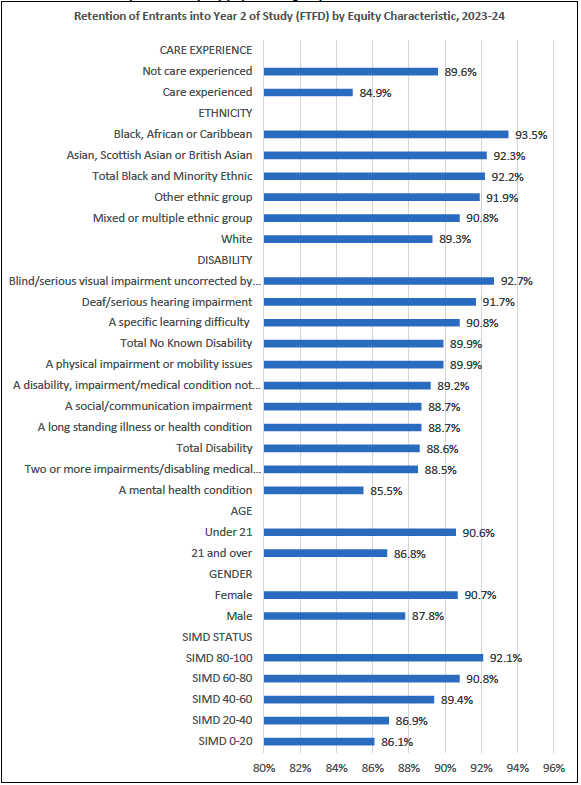
3. Retention is an emergent challenge for the sector, with some populations more susceptible.
Figures 3 and 4 and Table 1 have evidenced the scale of the retention challenge that faces the sector. Although progress must be made to facilitate access to higher education for those from the most disadvantaged areas (and for students with care-experienced backgrounds), Figure 8 also highlights that it is important that fair access work is focused on narrowing other retention gaps that persist between more and less disadvantaged students. Targeted work to reduce attrition should also acknowledge other social gradients. Notably, students who report a mental health condition are more likely than those without to not return to study in year 2. In other respects, retention data challenge our understanding of social disadvantage with, for example, retentions rates higher for minority ethnic students, for some groups of disabled students, for women, and for older students.
Source: RoWA Background Tables 2023-24: Table 3
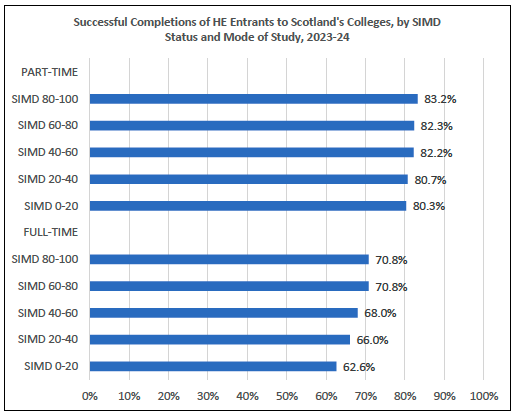
4. Higher rates of successful completion are characteristic of part-time higher education in colleges.
Colleges are important providers of higher education and facilitators of access to higher education. There is a social gradient to successful completion of higher education in colleges, although more marked is the difference in the likelihood of successful completion between students pursuing part-time and full-time courses: as Figure 9 demonstrates, 63% of students from one of Scotland’s 20% Most Deprived Areas who are pursuing full-time higher education in one of Scotland’s colleges successfully completed their course in 2023-24, compared to 80% of those from the same areas pursuing part-time higher education. Given the important role of colleges in facilitating fair access, it would be helpful to understand why one-third of students pursuing higher education on a full-time course in one of Scotland’s colleges did not achieve a successful completion in 2023-24 and why successful completion is much more likely for part-time students. It would also be helpful to understand whether the relatively higher levels of successful part-time completion reflect that these courses require: (i) fewer hours of commitment per week for a shorter period of study, (ii) fewer hours of commitment per week for the same period, (iii) fewer hours of commitment per week for a longer period, (iv) the same level of weekly commitment, but for a shorter period, (v) the same level of weekly commitment for the same period, or (vi) the same level of weekly commitment, but for a longer period.
Source: RoWA Background Tables 2023-24: Table 6
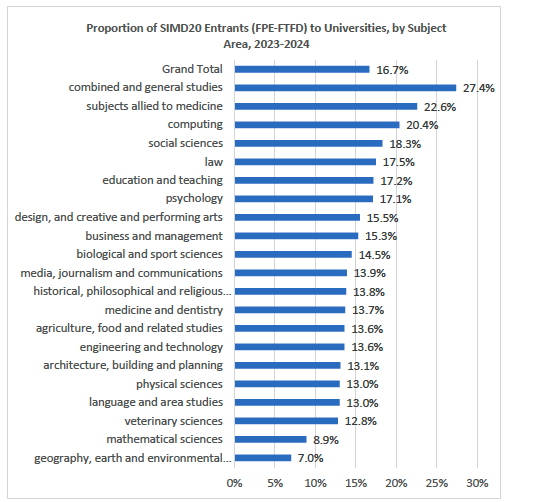
5. Fair access work must strengthen its focus on subject area variation
Fair access work is sensitive to the need for bespoke interventions to facilitate access to high demand/tariff degrees, with the National Schools Programme including two schemes to promote access to high demand professions (covering law, medicine, veterinary medicine, dentistry, economics, art, design, and architecture).
There is significant variation across disciplines in the proportion of entrants from the most deprived areas (Figure 10). Interestingly, it is not always the high tariff/high demand professions that have the lowest rates of participation: of particular note is that the share of entrants from Scotland’s 20% Most Deprived Areas for Law is greater than that for Scotland as a whole (17.5% in 2023-24, compared to 16.7% for Scotland as a whole).
Source: RoWA Background Tables 2023-24: Table 8a
Note: Full-person equivalents is HESA's method for counting enrolments across subjects where a student may be on a course covering more than one subject, such as a joint honours degree in Maths and Physics
The share of entrants from the most deprived areas has been fairly consistent for most subject areas through time. However, more marked progress has been made for some of the subject areas that are served by the Access to High Demand Professions programme (Figure 11) – in particular Medicine and Dentistry, and Law – as well as the Physical Sciences.
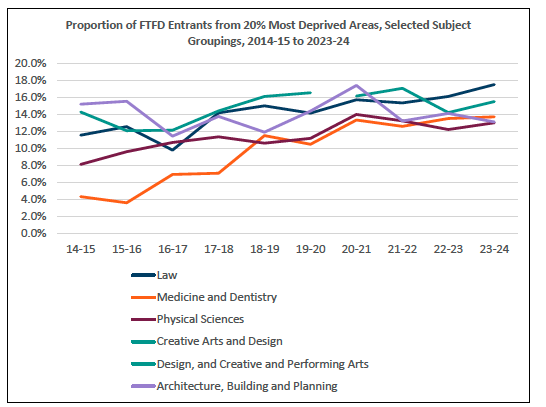
Source: RoWA Background Table 8a, 2014-15 through 2023-24
Note: Subject classifications changed in 2019-20 - after this point, ‘Creative Arts and Design’ was reported as ‘Design, and Creative and Performing Arts’: hence, the break in the line for this time series
Medicine and dentistry is also the subject area with highest proportion of entrants from a minority ethnic background (36.6%) and the lowest proportion of entrants with a known disability (14.6%).[97] In contrast, Agriculture, food and related studies is the subject area with the lowest proportion of entrants from a minority ethnic background (2.0%) and the highest proportion of entrants with a known disability (36.0%).[98] Clearly, there is scope for more disciplinary reflection (and action) on the composition of the student body that is accessing that education.
It also important to acknowledge the subject areas that facilitate access for a substantial share of students from Scotland’s most deprived areas. Almost one-quarter of Scottish domiciled, full-time, first-degree students from Scotland’s 20% Most Deprived Areas entered in 2023-24 to study subjects allied to medicine (1,240 entrants, or 22.6% of the total), with Business and Management (12.2%) and Social Sciences (9%)[99] also well-represented.
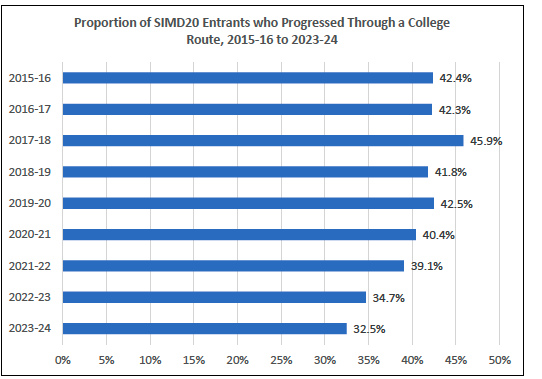
6. Articulation
Recommendations are made later in this report for ways in which data on articulation could be strengthened and that the language of articulation be modified to be consistent with the parity of esteem that is sought through the Scottish Credit and Qualifications Framework.
Although progression from college has played an important role in facilitating access to higher education in universities for those from the 20% Most Deprived Areas, it is important to acknowledge, and express some concern, over recent reductions in the proportion of those progressing from colleges to higher education in universities. This has fallen in each of the last four years, and in all but one of the last six years (Figure 12). Whereas when the CoWA reported, articulation was making strides toward one-half of entrants to university higher education passing through colleges, that proportion has fallen to below one-third of entrants in 2023-24.
Articulation continues to fulfil a central role in achieving fair access to higher education. However, recent trends should not be ignored. Worthy of further consideration is the juxtaposition of modest increases in number and proportion of students from Scotland’s Most Deprived Areas entering higher education (Figures 1 and 2, and Table 1 of this report), the modest reduction in retention rates over this period (Figures 3 and 4, and Table 2 in this report) and these articulation data.
Source: RoWA Background Tables 2023-24: Table 14d.
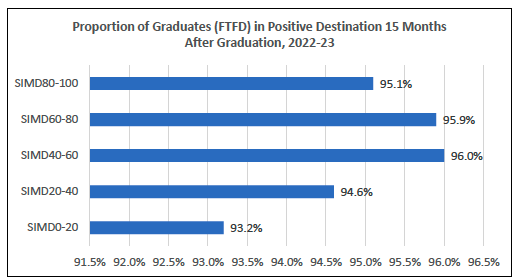
7. Destinations
It is accepted that fair access must be about more than entry to higher education, and should be equally concerned with equity in the quality of learning experience and graduate outcomes. RoWA reports on the proportion of students who are deemed to have attained a ‘positive outcome’ 15 months after graduation. The latest data confirm that most graduates who entered higher education from one of Scotland’s Most Deprived Areas reach a positive destination (93.2% in 2022-23) (Figure 13). However, there is a small, but not insignificant gap, with those from Scotland’s Most Deprived Areas more likely than others to report a negative destination. This affirms the need for fair access work to be concerned with experiences after entry to, and exit from, higher education.
Source: RoWA Background Tables 2023-24. Table 18.
3.5 - Student Finance and Wellbeing Study Scotland
The publication in October 2025 of the survey background tables from the Student Finance and Wellbeing Study[100] further strengthened the value of this Scottish Government-funded research, the main report from which was published in December 2024.[101] Although not the only research to provide contemporary insight into the financial circumstances of students in tertiary education in Scotland,[102] it provided a most welcome update of the Student Income and Expenditure Survey[103] that was administered in Scotland in 2007-2008, and published by the Scottish Government in 2009.
The study provides insight into students’ income, expenditure, borrowing, financial difficulty, perceptions of the adequacy of financial support, views on student support, changes to course of study, and the impact of finances on study decisions, academic achievement, wider student experience, health and wellbeing. The report is structured to report on the experiences of three student cohorts – those in Further Education; those in Higher Education (pursuing Higher National qualifications or an undergraduate degree), and postgraduate students, with the background tables providing data on variations by age, sex, residential status, parental experience of higher education, and whether or not they live in one of Scotland’s 20% Most Deprived Areas. Data are also presented for ‘students from under-represented groups’, a collective that comprises those who are estranged from their parents/legal guardians/carers, care experienced students, disabled students, student carers and student parents (the collective includes students in further, higher and postgraduate education).
The breadth of issues discussed and the coverage across tertiary education, and the presentation of data by Area of Deprivation status and full/part time status are particular strengths, although the fair access agenda would have been better served if the higher education category had been disaggregated according to whether it was pursued in FEIs or HEIs, and macro-geography (urban-rural status). Although not able to answer every question that is pertinent to the fair access agenda, it provides critical insight into the financial reality of contemporary student life.
The evidence should not be ignored, a selection of which is presented in Table 6:
- Most students report that they are struggling financially (56% of HE students).
- Most students report that financial difficulties had affected their studies.
- Student wellbeing is closely linked to financial circumstance.
- Many of the behavioural changes made to manage financial hardships are common to those reported by the broader population in Scotland who are living in poverty, such as skipping meals and reducing heating in the home.
- Those able to draw on regular financial support (from a partner, parent, or full-time employer) fared better, although students with additional costs (for example, childcare, or those living away from home) fared worse.
- Many students are worried about student loan debt.
- Three-quarters of HE students were combining study with some form of paid work. The median number of hours undertaken by HE student was 16 hours per week, in excess of the levels recommended by Cubie back in 1999 (10 hours per week),[104] and most recently by Student Information Scotland (10-15 hours per week).[105]
- More than one-third of HE students had considered leaving their course, with the most common reason given being the challenge of balancing paid work and study.
Some students are managing financially and report that support is sufficient. However, many more are not managing well financially and do not perceive that support is sufficient. As might be expected, the students who fare less well are from the groups that are the focus of fair access work in Scotland – living in the 20% Most Deprived Areas and care-experienced students. As might be expected, population share of problems experienced is greater for those living in one of Scotland’s 20% Most Deprived Areas who are part of another student group that is under-represented in the sector (Column 4 in Table 6).
The report authors acknowledge the challenging fiscal climate, the ways in which student support has increased in recent years, the targeted support that is available to some groups of students, and that free tuition lowers the student debt burden. However, they challenge the Scottish Government to better target resources to groups with greatest need, and caution that the fair access goals may be “hampered” if funding continues to be offered predominately in the form of student loans.
These data add to an existing body of contemporary evidence that highlights concerns over students’ financial circumstances and the implications on academic study and wellbeing. It is important that the financial realities of student life are considered as Scotland embarks on a review of higher education funding.[106]
| Issue | All Full-time HE – HN / undergraduate | Full-time HE from Most Deprived Areas | Full-time HE: Outside Most Deprived Areas | HE, FE & PG from Under-Represented from Most Deprived Areas | HE, FE & PG Under-Represented Outside Most Deprived Areas | Source Table in SFWS |
|---|---|---|---|---|---|---|
| Applied for hardship or discretionary funds | 9% | 14% | 8% | 19% | 12% | 5.39 / 5.70 |
| Not applied for as they ‘don't need funds’ | 35% | 19% | 39% | 15% | 30% | 5.53 / 5.80 |
| Working less 10 hrs week in last 7 days (if working) | 21% | 14% | 22% | 11% | 15% | 6.16 / 6.37 |
| Median total savings | £2,000.00 | £1,250.00 | £2,500.00 | £750.00 | £2,000.00 | 8.18 / 8.69 |
| Have savings | 70% | 58% | 74% | 34% | 56% | 8.24 / 8.71 |
| Issue | Including Part-time | Including Part-time | Including Part-time | As above | As above | Source SFWS Table |
|---|---|---|---|---|---|---|
| Receiving income from paid work | 76% | 68% | 79% | 50% | 68% | 6.14 / 6.36 |
| In arrears with debt | 22% | 37% | 19% | 46% | 27% | 8.39 / 8.77 |
| Faced financial difficulty | 56% | 75% | 52% | 77% | 63% | 9.6 / 9.14 |
| Skipped meals due to financial difficulty | 32% | 42% | 30% | 52% | 38% | 9.8 / 9.16 |
| upport from food banks due to financial difficulty | 6% | 13% | 4% | 18% | 9% | 9.8 / 9.16 |
| Would not have studied without funding | 54% | 60% | 54% | 62% | 60% | 10.8 / 10.21 |
| Financial difficulty - caused worry and stress | 94% | 95% | 93% | 95% | 95% | 11.8 / 11.16 |
| Financial difficulty - having to miss lessons | 28% | 31% | 28% | 27% | 30% | 11.8 / 11.16 |
| Financial difficulty - buying course resources | 29% | 35% | 27% | 35% | 30% | 11.8 / 11.16 |
| Financial difficulty - high impact on mental health | 20% | 32% | 18% | 38% | 29% | 13.4 / 13.8 |
| Considered leaving course | 40% | 45% | 38% | 47% | 43% | 14.12 / 14.26 |
| Reasons consider: not enough money to survive | 41% | 49% | 40% | 56% | 48% | 14.15 / 14.29 |
| Reasons consider: responsibilities outside studies | 21% | 33% | 19% | 37% | 28% | 14.15 / 14.29 |
| Reasons consider: balancing paid work and study | 52% | 58% | 50% | 46% | 51% | 14.15 / 14.29 |
| Perceive financial support to be insufficient | 54% | 64% | 52% | 60% | 58% | 15.6 / 15.14 |
Source: Scottish Government. (2025). Student Finance and Wellbeing Study (SFWS) Scotland 2023-2024 - Background tables. [Online].
3.6 - Public perceptions of Higher Education funding in Scotland
To inform its work, as it embarked on a strategic review of its own priorities, the Carnegie Trust for the Universities of Scotland commissioned Ipsos UK to conduct a survey of public perceptions of higher education.[107] This survey focused on funding. Among the key findings were that:
- Two-thirds of the Scottish public viewed attending university as worthwhile (63%), the main reasons for which related to career training or improving employment prospects. Notably, one-half of felt that study in courses with no clear career path was a ‘waste of time’ (49%).
- Two-fifths agreed that too many people face barriers to access university (43%), although the same proportion considered that anyone in Scotland who wants to attend university can do so (44%).
- Three-quarters considered the cost of living as the main barrier in applying to and attending university in Scotland (72%). This was the only barrier that was identified by the majority of respondents.
- Although there was support for the Scottish Government to cover costs for all first-time undergraduate students living in Scotland (44%), there was an equal amount of support for contributions being made by higher-income households.
- Two-thirds supported Scottish Government support for students from low-income households (65%).
- The population was evenly split between those who agreed that too many people go to university (33%), those who were unsure (33%) and those who disagreed (29%).
On the whole, there is broad support for university education and an acknowledgement of access issues. However, there is not universal support. This work emphasises that argument and evidence in favour of fair access must continue to be promoted in the public domain. As noted above (end of section 3.5) It is important that fair access is a central concern as Scotland embarks on a review of higher education funding.[108]
Contact
Email: clara.pirie@gov.scot