Role of incineration in the waste hierarchy - review: call for evidence
The call for evidence seeks your views and evidence relating to the review of the role of incineration in the waste hierarchy.
10. Annex 1 – Methodology for the Capacity analysis
The modelling undertaken for this project was broken down into a four-stage approach which is outlined below, with further detail on each item provided within the following sections.
- Waste forecasting – examining how waste arisings may change in the future under different scenarios.
- Capacity gap modelling – examining how much waste is recycled and composted and, for the remaining waste quantities, how this compares to the available capacity of treatment infrastructure (current and planned).
- Carbon modelling – examining the impacts of the modelled scenarios with relation to their associated carbon footprints.
- Calorific value modelling – examining the calorific value of the remaining residual waste under the modelled scenarios.
The approach is similar to that used in the Waste Markets Study[30] undertaken in 2018, which used 2016-2017 waste data to forecast future waste arisings, recycling and residual waste quantities. Whereas the previous Waste Markets Study examined exports to energy from waste (EfW) facilities and landfills outside Scotland, this report focuses on Scotland managing all its waste within Scotland. Additionally, this report uses more recent data (2018 data) and does not examine the opportunities and costs related to exporting RDF.
10.1 Modelled Scenarios
Through discussion with the project steering group the following scenarios were modelled:
- Scenario 1: Baseline – where current performance would continue as 'business as usual'.
- Scenario 2: Approaching Targets – where performance is improved beyond business as usual but only reaches half-way to the targets.
- Scenario 3: Achieving Targets – where all applicable waste performance targets are met.[31]
Each scenario was broken down further into two (i.e., Scenario 1a and 1b etc.) to allow for comparative analysis between the BMW ban and the extended biodegradable non-municipal waste bans under the different scenarios. outlines the details and key assumptions within each of these scenarios.
The Scottish Government's waste reduction and recycling targets encompass all three major waste sources (household, commercial and industrial (C&I), and construction and demolition (C&D)). This project focused only on Household and C&I waste due to two reasons:
a) C&D waste is low in biodegradable content, which was the focus of this project.
b) C&D waste historically has very high recycling rates compared with Household and C&I waste.
Therefore, the modelling has sought to reach overall recycling targets without "assistance" from C&D recycling contributing to the overall recycling rates. This means that if C&D recycling is included, Scenarios 2 and 3 would likely exceed the predictions in this report.
| Baseline (Scenarios 1a and 1b) | Approaching Targets (Scenarios 2a and 2b) | Achieving Targets (Scenarios 3a and 3b) | |
|---|---|---|---|
| Total waste arisings | No waste reduction, arisings follow the growth assumptions in Section 10.2 | Reduction in total waste arisings by 7.5% (compared to 2011 levels) by 2025 | Reduction in total arisings by 15% (compared to 2011 levels) by 2025 |
| Food waste arisings | No food waste reduction target applied, follow the 'total arisings' trend | Reduction in food waste by 16.5% (compared to 2013 levels) by 2025 | Reduction in food waste by 33% (compared to 2013 levels) by 2025 |
| Recycling and Composting | Recycling rate remains at current level (48.6% across household and C&I) | Recycle 59% of remaining (household and C&I) waste by 2025 | Recycle 70% of remaining (household and C&I) waste by 2025 |
| Waste to landfill | Current proportion of waste to landfill (36.7%) continues | No more than 16-18% of remaining waste to landfill; diversion of all BMW from landfill (BMW landfill ban) | No more than 5% of remaining waste to landfill; diversion of all BMW from landfill (BMW landfill ban) |
10.2 Waste Forecasting and Capacity Gap Analysis
Modelling Approach
For the waste forecasting and capacity gap modelling, Ricardo utilised an existing Residual Waste Model previously developed for the Scottish Government in 2015. This approach was undertaken as the model has already been verified and validated by the Scottish Government and provided trusted results.
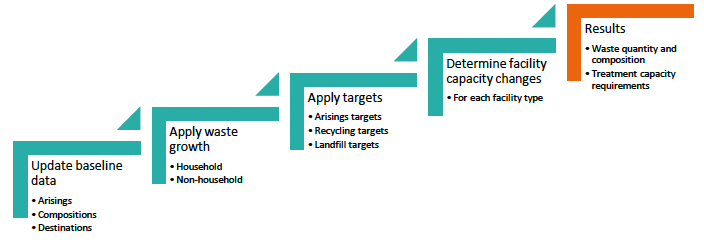
The waste forecasting and capacity gap modelling approach is summarised in Figure 6: Waste forecasting and capacity gap modelling approach. The existing model was updated with the latest available data, which was for 2018, which is referred to as the 'baseline' year throughout this report. The relevant waste growth rates were then updated and applied to the baseline data.
Following the update to the baseline waste quantities and assumptions, a new component was added to the model to progress towards the waste targets outlined in scenarios 1 and 3. Additionally, facility capacity information (facility type, status, year of commissioning, throughput capacity etc.) was reviewed and updated.
10.3 Data and Assumptions
The existing Residual Waste Model relies upon numerous data sources and assumptions, which are detailed in the following sections.
Arisings, Composition and Destinations
The waste arisings and compositions are based upon 2018 data from the Scottish Environmental Protection Agency (SEPA)[32],[33]. The arisings data excludes hazardous waste, as advised by the project steering group. The waste destinations (i.e., how much of each material is recycled, landfilled etc.) was derived using SEPA data for household waste33 and the Scottish Carbon Metric (SCM) data from Zero Waste Scotland for commercial and industrial waste[34].
The resulting baseline waste quantities for 2018 were applied consistently across all the modelled scenarios for the baseline year.
Waste Growth
The following growth assumptions were applied consistently to all scenarios:
- Household waste arisings - growth as per the Scottish Government population projections[35].
- Commercial and Industrial (C&I) waste arisings - growth as per estimated Scottish GDP growth[36].
Waste Reduction Targets
Scottish Government waste reduction targets have been based on 2013 data[37] for food waste targets and 2011 data for total waste arisings targets[38]. Ricardo liaised closely with the steering group to confirm assumptions around particular material streams in the baseline data, in preparation for the scenario modelling, as follows:
1. Food waste arisings reduction target: SEPA indicated that the quantity of food waste in the published 2013 SEPA data (246k tonnes in the 'Animal and mixed food waste' material line) was too low. SEPA suggested that additional food waste could be contained within the 'Household and similar wastes' material line, which totalled 2.37M tonnes in the same year. SEPA proposed a re-allocation of this hidden food waste from the 'Household and similar wastes' material line to the 'Animal and mixed food waste', to the amount of 753k tonnes. This figure has been derived from the estimated 1 Mt of total food waste in 2013[39] minus the amount already in the 'Animal and mixed food waste' material line. This proportion[40] of 'hidden food waste' was used to determine the estimated total amount of food waste (identified and hidden) in 2018, in order to model the total food waste reduction to meet 2025 targets.
2. Total waste arisings reduction target: this has been calculated for all waste except food waste to avoid double counting the food waste reduction performance to meet the target summarised above. As such, food waste arising reductions were modelled first, followed by total waste arisings (minus food waste) reductions. For all four scenarios that are modelled to reach specific targets, it was found that applying the food waste reduction target on its own meant that the total waste arisings reduction target was met in its' entirety. This is because of the high total waste arisings in 2011, (the year that the total waste arisings reduction target is based on), compared to the baseline year (2018) for this analysis. For this reason, the total waste arisings reduction target was not applied to any of the scenarios.
SEPA recommended that various commercial and industrial materials be re-allocated as household waste arisings. For this reason, the modelling examined total waste reduction targets, instead of separate targets for household waste and C&I waste.
Food waste arisings reduction targets are summarised in Table 3 and total waste arisings reduction targets are summarised in Table 4.
| Approaching targets scenarios | Achieving targets Scenarios | |
|---|---|---|
| Baseline food waste arisings (2018) | Total: 1.0M tonnes[41] | Total: 1.0M tonnes[42] |
| Food waste target (2025) | Total: 835k tonnes[43] | Total: 670k tonnes[44] |
| Approaching targets scenarios | Achieving targets Scenarios | |
|---|---|---|
| Baseline total waste arisings (2018) | Total: 5.2M tonnes | Total: 5.2M tonnes |
| Total waste target (2025) | Total: 5.9M tonnes[45] | Total: 5.5M tonnes[46] |
Recycling Targets
Scenario 1 examines the achievement of the recycling target (70% by 2025), and Scenario 3 examines achievement of 'halfway to the recycling target' (59% by 2025). The baseline recycling rate for household and C&I waste is 48.6% (2018), so in order to meet the targets of Scenarios 1 and 3, assumptions were required to determine which materials would be expected to have greater recycling rates in the future. SEPA provided guidance on material groups that were deemed to have a higher potential for recycling, and the recycling rates for these materials were increased in order to meet the overall targets. Based on this guidance from SEPA, it was assumed that the recycling rates of the following materials would increase in order to meet the overall targets:
- Household waste:
- Household and similar wastes
- Commercial and Industrial waste:
- Used oils
- Chemical wastes
- Plastic wastes
- Wood wastes
- Textile wastes
- Animal faeces, urine and manure
- Other mineral wastes.
Materials Included in the Bans
SEPA provided advice on the materials to be included in the current BMW landfill ban and the extended biodegradable non-municipal waste ban.
10.4 Infrastructure Landscape
Approach
In addition to quantifying potential future waste tonnages under the different scenarios, an equally important task is to establish the available infrastructure treatment capacity. When overlaid with the waste quantities this allows for analysis to determine whether a capacity gap exists, where there is insufficient treatment capacity, when the ban is due to be implemented or whether there is potential for there to be excess treatment capacity.
To identify suitable facilities, Ricardo utilised its own FALCON (Facilities, Arisings, Location, Contracts) database in addition to publicly available data and discussions with the steering group. To model the treatment capacity for each facility, the quantities of waste received at each facility were compared to the consented capacity, refined by intelligence known for each facility through the steering group. This was to enable Ricardo to model the true operational capacity of each facility. Whilst the total waste quantities a facility can accept will be consented through the planning and permitting process, the true throughput or processing capability of the facility may differ. This approach was therefore taken as a conservative approach to try and reflect the true operational capacity of the identified facilities.
Assumptions were also made relating to the lifespan of each facility from its' first operational date. These assumptions are outlined in Table 5.
| Technology Type | Estimated Lifespan (Years) |
|---|---|
| Advanced Thermal Treatment (ATT) | 20 |
| Energy from Waste (EfW) | 40 |
| Mechanical Biological Treatment (MBT) | 30 |
Within the study period of interest, to 2025 no current operational facilities are expected to close based upon the lifespan assumptions in Table 5 Assumed lifespan of treatment facilities by technology type. However, consideration will need to be made to aging infrastructure which may need to be replaced to ensure that process efficiency and cost effectiveness is maintained, along with ensuring compliance with the latest regulatory requirements. Any alterations in facility size and capacity will need to be considered alongside new pipeline infrastructure potentially becoming available.
Operational Facilities
A total of 12 operational facilities were identified which are currently managing these waste types. The facilities are listed in Annex 2.
The total modelled capacity of these facilities is approximately 1.32 Mt.
Pipeline Facilities
Pipeline facilities within the development stage were also considered. Should these progress to completion and commercial operation, they could potentially change the infrastructure landscape.
Discussions were undertaken with the steering group to identify the facilities most likely to become operational by 2025. A total of 3 additional facilities were assumed to become operational by this date and these are outlined in Appendix 2. These would result in an approximately 0.45 Mt of additional treatment capacity. These facilities are 'relatively secure' in the pipeline as they are already within the stages of construction or commissioning at the time of writing. However, it is still possible for delays to occur during the later stages of project development which could still impact upon pipeline infrastructure becoming operational. The modelled capacity for each facility was taken as 95% of the stated capacity for each facility, to factor in facilities ramping up to full operations and potentially becoming operational midway through the year. The modelled capacity was set at 50% for its first operational year, with 95% of the stated capacity modelled thereafter.
There are a number of other pipeline infrastructure projects within the earlier stages of development that have not yet reached key project milestones such as financial close or start of construction. Whilst the analysis has focussed upon 2025, there is still the potential for additional infrastructure to be developed after that date, should key project milestones be met to reach commercial operation. This is difficult to quantify as not all projects that are currently proposed, achieved planning and/or permit consent will make it through to commercial operation.
Contact
Email: incineration-review@gov.scot