Attainment Scotland Fund Evaluation - Headteacher Survey: 2020 report
The Attainment Scotland Fund Evaluation: Headteacher Survey – Full Report 2020 presents key findings from the fifth survey of headteachers of schools in receipt of Attainment Scotland Fund (ASF) support, covering the 2019/20 academic year including the period of school building closures from March.
2. Methodology
2.1. This section summarises the survey fieldwork approach, and the level and profile of response.
Survey design and fieldwork
2.2. This is the fifth survey of headteachers of schools in receipt of ASF support and cove red the 2019/20 academic year. Surveys in 2016 and 2017 included headteachers across the Challenge Authorities and Schools Programmes, with a sample of PEF-only schools included for the first time in the 2018 survey. The survey sample was expanded for the 2019 survey to include all schools in receipt of CA, SP and/or PEF support.
2.3. The present survey coincided with the COVID-19 pandemic, with fieldwork conducted in January and February 2021 during a period of school building closures and increased remote learning. The survey sample was therefore reduced to limit the burden on schools affected by the pandemic and school building closures. All CA and SP schools, and 50% of schools in receipt of PEF only were invited to participate. The survey methodology otherwise remained consistent with that used in previous surveys.
2.4. The survey sought headteacher views and experiences relating to the 2019/20 academic year. Survey content was adapted from that used in the 2019 survey. Key indicators were maintained where survey findings are used to track trends over time, alongside the introduction of new questions looking specifically at schools’ experience of ASF during the first period of school building closures from March to June 2020. The survey design kept a close focus on key questions which can inform the ongoing ASF evaluation, to limit survey completion time and the associated burden on schools.
2.5. The profile of schools across the three ASF streams and urban/rural geography[1] is summarised below.
| Urban/Rural area | Challenge Authority | Schools Programme | PEF-only | All |
|---|---|---|---|---|
| Urban area | 525 | 49 | 392 | 966 (60%) |
| Small town | 47 | 8 | 113 | 168 (10%) |
| Rural area | 61 | 8 | 341 | 410 (25%) |
| Unknown | 25 | 8 | 38 | 71 (4%) |
| Total | 658 (41%) | 73 (5%) | 884 (55%) | 1,615 |
Note: ‘Unknown’ urban/rural location is recorded where school postcode information could not be matched to geocoding data.
2.6. Consistent with previous surveys, survey invites were issued directly to schools, supported by promotion via Education Scotland and local authorities. The survey was issued in January 2021 and the fieldwork period extended to enable the broadest possible response, running to mid-February 2021. The survey response and approach to survey weighting is summarised over the following pages, with further detail provided in the Technical Report included in the Supporting Documents.
Survey response
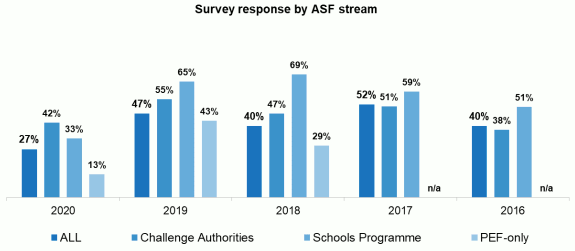
2.7. A total of 420 responses were received by survey close, equivalent to an overall response rate of 27%. This represents a 20-point decrease in survey response since 2019, primarily due to a 30-point decrease in response from PEF-only schools (13% compared to 43% in 2019 – see Figure 1 over the page). As noted above, survey fieldwork took place in early 2021 during a period of school building closures, and associated increase in pressure on school resources. In this context, we very much appreciate those schools able to participate. Moreover, the volume of response is sufficient to produce robust statistical results to inform the wider ASF evaluation.
2.8. The table below summarises the profile of survey respondents and compares this with all schools in receipt of ASF support. In terms of the profile of respondents, the largest groups are Challenge Authority schools, primary schools, schools in urban areas, and schools with a middle or upper PEF allocation. This differs from the profile of all ASF-supported schools on a number of indicators, in part due to the change in sampling approach for the present survey:
- Challenge Authority schools are over-represented by survey respondents, and PEF-only schools under-represented. This is due to the 50% sample taken of PEF-only schools (compared to the 100% sample of CA schools), compounded by a lower response rate from PEF-only schools. Survey weighting has been used to correct for this response bias.
- Schools with lower PEF allocations are under-represented, and those with higher allocations are over-represented. This is also in part due to the under-representation of PEF-only schools (which typically have lower PEF allocations) and over-representation of CA schools (which typically have higher PEF allocations because of the higher concentration of deprivation in their community resulting in higher numbers of pupils registered for free school meals).
- Schools in rural areas are under-represented, and schools in urban areas over-represented. Again, survey weighting has been used to correct for this.
| Attainment Scotland Fund | Respondents (n=420) | All schools in receipt of ASF | Differential |
|---|---|---|---|
| Challenge Authorities | 58% | 27% | 31% |
| Schools’ Programme | 11% | 3% | 8% |
| PEF-only | 31% | 67% | -36% |
| PEF allocation[2] | Respondents (n=420) | All schools in receipt of ASF | Differential |
| Lower | 10% | 22% | -12% |
| Middle | 43% | 42% | 0% |
| Higher | 40% | 21% | 19% |
| Unknown | 7% | 14% | - |
| School sector | Respondents (n=420) | All schools in receipt of ASF | Differential |
| Primary schools | 80% | 80% | -1% |
| Secondary schools | 15% | 15% | 1% |
| Special schools | 5% | 5% | 0% |
| Unknown | 0% | 0% | - |
| Urban/rural location | Respondents (n=420) | All schools in receipt of ASF | Differential |
| Urban | 64% | 49% | 15% |
| Small town | 10% | 10% | -1% |
| Rural | 15% | 33% | -18% |
| Unknown | 11% | 7% | - |
Analysis and reporting
2.9. Survey responses have been weighted by ASF stream and urban/rural location to adjust for response bias; all results presented in the remainder of this report are weighted. Base numbers for each survey question vary due to question non-response – i.e. the results exclude non-respondents to the question unless stated otherwise.
2.10. Survey analysis has used hypothesis tests with a 5% significance level to identify significant differences from previous survey findings, and across key respondent groups. These included:
- ASF stream;
- PEF allocation;
- School sector; and
- Urban/rural location.
2.11. Where variation across these groups is noted in the body of the survey report, this is based on a statistically significant difference between groups.
2.12. Survey data showed some inconsistency between responses and data on ASF support provided to schools - for example, 28 Challenge Authority respondents indicated that their school received only Pupil Equity Funding. The categorisation of respondents used in our analysis has been based on Scottish Government records rather than self-reporting.
2.13. The survey included a number of questions giving headteachers the opportunity to respond in their own words. This feedback has been coded into broad themes, and the results presented in the survey report. This includes the percentage of respondents coded into each theme – note that these percentages are based on those answering the question, and respondents can be assigned to multiple themes. Presentation of written feedback also includes direct quotes - this material has been edited for brevity and to ensure anonymity.
2.14. A full list of survey questions, tabular survey results and follow-up pro forma are provided in the associated Technical Report included in the Supporting Documents for this report and available at http://www.gov.scot/ISBN/9781802010114
Contact
Email: Fiona.Wager@gov.scot