Tackling child poverty delivery plan 2022-2026 - annex 4: cumulative impact assessment
This report is an annex to Best Start, Bright Futures: the second tackling child poverty delivery plan 2022 to 2026 and assesses the cumulative impact of a package of our policies on child poverty.
6. Detailed Methodology
6.1 Microsimulation model
UKMOD is a microsimulation model which is maintained, developed, and managed by the Centre for Microsimulation and Policy Analysis (CeMPA) at the University of Essex. The model applies the rules of the tax and benefit system to a set of microdata based on three years of the Family Resources Survey (FRS), in this case 2017/18, 2018/19, and 2019/20. UKMOD is a static model; it does not take into account demographic changes which occur over time or behavioural changes which result from policy interventions. The results presented here are based on UKMOD version A3.0+. The results and their interpretation are the sole responsibility of Scottish Government.
UKMOD uprates income components and other monetary variables from each year of data to each year of analysis using a range of sources, primarily the OBR's Economic and Fiscal Forecasts.[14] We assume that benefit rates which are currently frozen, such as the benefit cap and Local Housing Allowances, remain frozen over the period of the projections. A full list of uprating indices, along with further information on the model, can be found in the UKMOD Country Report.[15] These forecasts take into account the range of factors which determine macroeconomic outcomes, but no specific adjustments are made to reflect demographic change or the changes in the labour market. Previous Scottish Government analysis using UKMOD has applied an unemployment shock to reflect the impacts of Covid-19, but the latest data and forecasts indicate that higher unemployment will not be a lasting legacy of Covid-19, although there remains a concern that labour-market participation will remain lower with older workers retiring early.[16]
UKMOD models the transition to Universal Credit (UC) by setting a target for the proportion of all claimants projected by the OBR to be on UC in each year of analysis and randomly selecting individuals to transition based on this target.[17] For those individuals who meet the eligibility criteria for both legacy benefits and UC, published take-up rates are used for the legacy benefits in question. For individuals who are only eligible for UC, the take-up rate for Income Support for people without children is used. Again, take-up is based on random selection.
6.2 Interpretation of results
Our methodology is based on comparing two scenarios: one in which the package is included and one in which it is excluded. However, assessing the impact of the policy package is complicated by the fact that Scottish Government benefits are linked both to reserved benefits and to wider economic factors.
For example, recent reforms to Universal Credit (UC) have the effect of increasing the UC caseload, which will tend to reduce the child poverty rate in both the counterfactual scenario and the policy scenario. However, since UC acts as a qualifying benefit for a number of Scottish benefits, the caseload of these benefits will also increase. As a result, the child poverty rate may fall more in the policy scenario than in the counterfactual scenario, meaning the impact of the policy package will increase as a result of the UC reforms.
Similar dynamics pertain to inflation, which will trigger an increase in UC rates. This will not only impact household incomes directly, but will also make more people eligible for UC, with spillover effects on devolved benefits for which receipt of UC is an eligibility criterion. Scottish benefit rates which are linked to inflation will also increase. Changes in real incomes and demography will have similar effects, although the latter is not modelled in UKMOD.
The policies in the package also interact with external factors through the way that poverty is measured, in a similar way that the policies within the package interact with each other. For example, if we attempted to separate the impacts of the recent changes to UC and the impacts of the introduction of Scottish Child Payment, we would face a predicament when considering households which received both benefits – particularly those which required both policies to cross the poverty line or which would have exited poverty through either policy.
The outcome of this discussion is that we cannot disaggregate a temporal change in poverty levels into the impact of Scottish Government policies and the impact of other factors. To do so, we would need to either introduce policies into our model sequentially, even if they were actually concurrent, or to simulate a scenario in which the exact same people received the exact same amount of Scottish benefits in each year of analysis. Neither approach would reflect reality. Instead, our estimate of the impact of the policy package includes any impacts on household incomes which are the result of interactions with the policies in the package, even if they are not the result of substantive changes in those policies.
6.3 Sensitivity testing
To demonstrate the uncertainty surrounding our estimates, we can repeat our analysis after varying one or more factors and then compare with the original results. Given the salience of inflation in the current economic climate, we repeat our analysis while assuming that a Consumer Price Inflation rate of 6.7%, the rate forecasted by the Bank of England for the third quarter of 2022 in its latest Monetary Policy Report, continues over the forecasted horizon.[18] Benefit rates, housing costs, tax rates, and a number of other parameters increase as a result; although any parameters which are currently frozen remain frozen in the sensitivity test. This is purely an illustrative exercise, with the purpose of testing the sensitivity of our projections with respect to a particular variable – it does not represent an alternative projection.
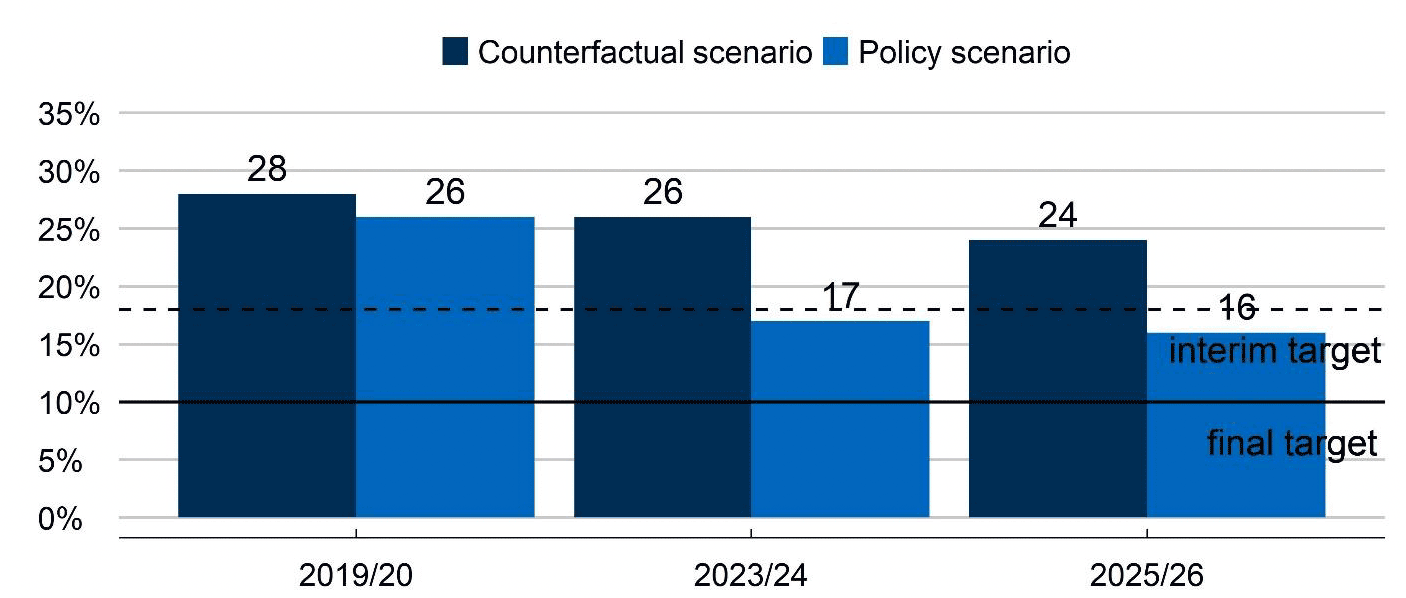
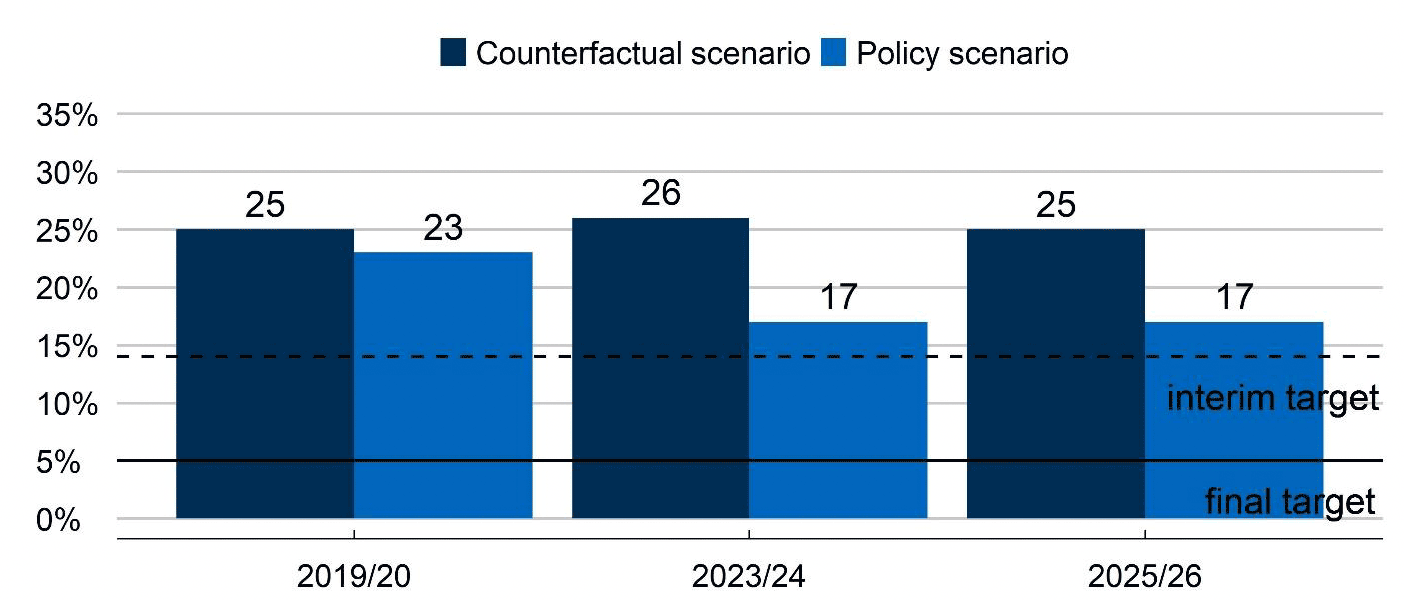
The results of the sensitivity test are shown in Figures 5.1 and 5.2 for relative and absolute child poverty respectively. A number of insights can be drawn by comparing these results to our projections in Figures 4.1 and 4.2. Firstly, the projections are sensitive to changes in inflation, to a greater or lesser degree. Although the variation in poverty rates does not exceed 2 percentage points, inflation is one of many factors which generate uncertainty. Furthermore, the results also demonstrate that the variation increases over time as the inflation rates in our projections and those in the sensitivity test diverge, in particular due to the compound nature of inflation. On the relative measure of child poverty, there is no change to the projected rate in 2023/24, but by 2025/26 the rate falls by 1 percentage point relative our original projections. On the absolute measure the impacts are evident earlier, with the child poverty rate increasing by 1 percentage point in both 2023/24 and 2025/26.
A second observation, which was discussed in the body of this report, is that increases in inflation tend to have differential effects on the two measures of poverty: relative poverty tends to fall, largely due to increases in benefit income, whereas absolute poverty tends to rise, largely due to increases in the poverty line. In fact, the magnitude of the sensitivity test is such that the two measures of poverty converge by 2023/24, with the absolute poverty line actually overtaking the relative poverty line thereafter. By 2025/26, the relative child poverty rate falls to 16% in the sensitivity test, compared to 17% in our projection. By contrast, the absolute child poverty rate only falls to 17%, compared to 16% in our projection.
The impact of the policy package exhibits similar changes on both measures of poverty when inflation is increased, with the difference between the policy and counterfactual scenarios falling from 10 to 9 percentage points in 2023/24 and from 9 to 8 percentage points in 2025/26 on both measures. However, for relative child poverty, it is primarily the counterfactual scenario which is affected: the poverty rate in this scenario falls considerably more steeply when inflation is higher, reaching 24% in 2025/26 compared to 26% in our projection. The poverty rate also reduces in the policy scenario, but not to the same degree. Meanwhile, the opposite is true for absolute poverty, with the poverty rate increasing in the policy scenario but remaining broadly unchanged in the counterfactual scenario.
This implies that the impacts of inflation on absolute child poverty largely depend on the policy package, whereas on the relative measure the impacts are largely independent of the policy package. In other words, absolute child poverty is more sensitive to inflation when the policy package is in place, likely because more children are clustered around the rising poverty line. Conversely, relative child poverty is less sensitive to inflation when the policy package is in place, indicating the diminishing impacts of further increases to benefit rates on moving children over the poverty line.
Source: Scottish Government Analysis using UKMOD
Source: Scottish Government Analysis using UKMOD
6.4 Poverty calculations
In each year of analysis, we run the policy scenario at the UK level to calculate the relative poverty line as 60% of median net (disposable) equivalised household income after housing costs. We then hold the poverty line constant when comparing to the counterfactual scenario. In reality, the policy package could have an effect on median UK income, and thus on the poverty line, but any such effect would be minor. Absolute poverty is estimated by performing a simulation at the UK level for 2010/11, calculating the poverty line as 60% of median net equivalised household income, and uprating the poverty line by CPI in each subsequent year.
Note that all child poverty rates are rounded to the nearest percentage point and numbers of children are rounded to the nearest 10,000. This is in line with the presentation of the official poverty statistics, which are themselves subject to a degree of uncertainty and sit within a confidence interval of around 2 percentage points.[19] Further information on the definitions of income and poverty can also be found in the official statistics publication.[20]
UKMOD generally simulates lower poverty rates than the official statistics, primarily because it corrects for the under-reporting of benefit income which is known to affect the FRS.[21] We therefore need to calibrate our results so that, as far as possible, they are consistent with the statistics which will be used to determine whether or not the targets have been met. This introduces an additional layer of uncertainty into our estimates.
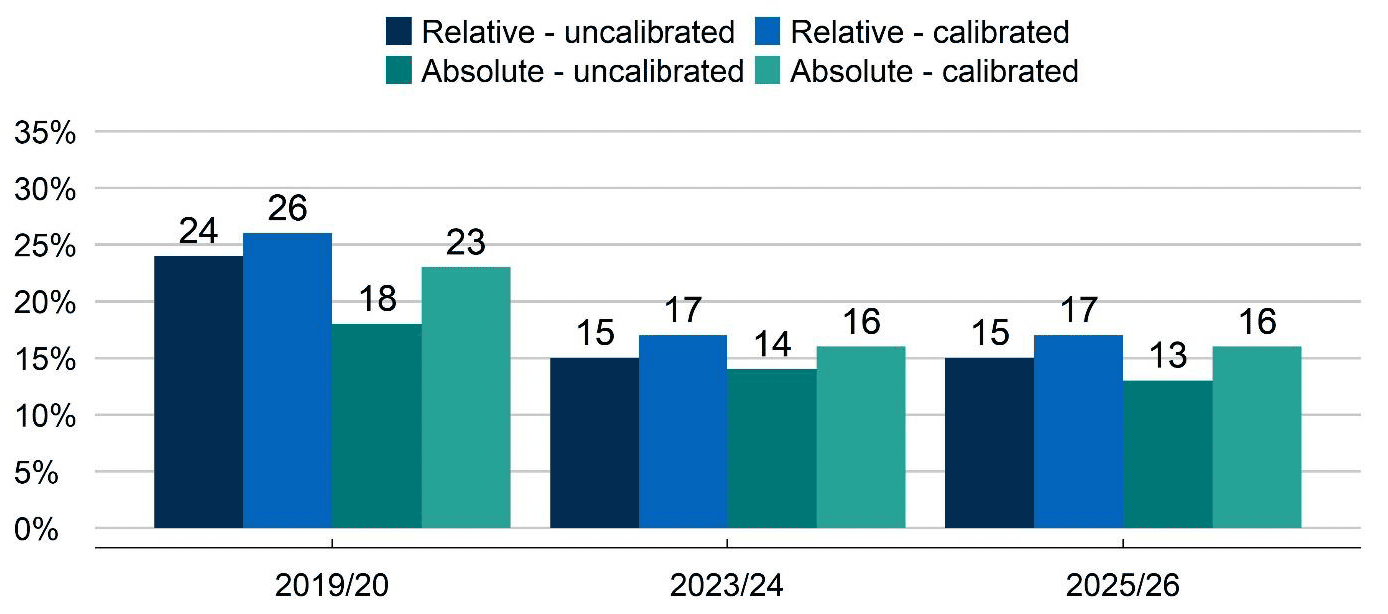
For relative child poverty, we firstly calculate the difference between the simulated poverty rate and the official poverty rate in the latest year of official statistics, i.e. 2019/20. We use the single-year statistic because UKMOD simulates a single year, even though the input data pools three years of FRS data. Specifically, the simulated poverty rate in 2019/20 is 24%, compared to the official poverty rate of 26%. This yields a difference of two percentage points, which we then apply to all other simulations for relative poverty. Thus, in 2025/26, our simulated projection is 15%, which increases to 17% after the calibration is applied.
For absolute child poverty, we firstly compare the difference between the simulated relative and absolute poverty rates with the difference between the official relative and absolute poverty rates, again in 2019/20. The difference between the simulated rates in that year is 6 percentage points, whereas the difference between the official rates is 3 percentage points, giving a ratio of 2. We then ensure that this ratio is held constant in all other simulations for absolute poverty, using the calibrated relative poverty rate as the reference point in each year of analysis. For example, in 2025/26, the difference between the simulated rates is 2 percentage points, with relative child poverty at 15% and absolute poverty at 13%. Dividing this difference by the ratio of 2 yields a calibration term of 1 percentage point to subtract from the calibrated relative poverty rate of 17%, giving a calibrated absolute poverty rate of 16%.
Figure 5.3 sets out the calibrated and uncalibrated child poverty rates on both measures, in each year of the policy scenario.
Source: Scottish Government Analysis using UKMOD
The same calibration terms are applied to the counterfactual scenarios and policy scenarios in each year of analysis. Thus, in 2025/26, the uncalibrated relative poverty rate is 24% in the counterfactual scenario, which becomes 26% when the calibration term of 2 percentage points is applied. The absolute poverty rate is then calibrated by subtracting the calibration term of 1 percentage point from the calibrated relative poverty rate, coming to 25%. This method allows us to preserve the percentage-point difference between the policy and counterfactual scenarios – i.e. the number of children kept out of poverty by the policy package – as simulated by the model. This is important because, as noted previously, estimates of policy impacts are likely to be more robust than estimates of observable outcomes.
The reason we do not use the same method for absolute poverty as we do for relative poverty – i.e. taking the difference between the simulated and official poverty rates in 2019/20 and applying this difference to all other simulations – is that this method would result in absolute child poverty being higher than relative child poverty even though the absolute poverty line is modelled to be lower. This is because the difference between the simulated and official rates is significantly narrower on the relative measure. For the same reason, we use relative child poverty as the reference point rather than absolute poverty. Our method therefore attempts to adjust for the difference between the simulated and official poverty rates while also preserving the relationship between the absolute and relative poverty measures, which changes over time.
We also experimented with a more granular approach to calibration, which is also used in the literature on poverty simulation.[22] Instead of comparing aggregate poverty rates, this approach compares the income of each household in the latest FRS data to its income in the simulation for that year, and corrects for the difference in all subsequent simulations. This approach to calibration can result in some households having negative incomes before housing costs, which is not possible in reality and introduces analytical complications. In addition, the official poverty statistics are based on the secure version of the FRS, whereas UKMOD (like other microsimulation models) is based on the end-user version. Technical developments may allow us to improve our calibration method in the future.
6.5 Benefit policies
We model the total impacts of the benefit policies in the policy package, including those which have counterparts in the rest of the UK. For example, we measure the impact of Best Start Grant by comparing to a scenario in which the Grant was not awarded at all, rather than to a scenario in which the UK Government's Sure Start Grant was implemented instead.
For all benefit policies, our approach to modelling partial take-up is as follows:
1. For policies which are taken directly from the FRS rather than simulated based on eligibility, or which are fully dependent on policies which have already been adjusted for take-up, there is no need to adjust for partial take-up since this is already taken into account. This includes Carers Allowance Supplement and Discretionary Housing Payments.
2. For policies which are simulated based on eligibility, we apply published take-up rates or equivalents where available. Policies in this category include Best Start Foods, Best Start Grant, Scottish Child Payment, and Council Tax Reduction.
3. For policies which are simulated based on eligibility but do not have published take-up rates or equivalents, we do not apply a take-up adjustment. Policies in this category include Free School Meals and School Clothing Grant.
To validate this approach, we compare the simulated caseload and expenditure with the outturn caseload and expenditure for each benefit in 2019/20, provided the benefit was in place for the duration of the year. The simulated figures are within 10% of the outturn figures for all benefits except Carers Allowance Supplement, for which they are within 15%.
We model Best Start Grant according to the eligibility criteria of the policy. We do not model pregnancies for the Pregnancy and Baby Payment as this information is not recorded in the FRS. For the Early Learning Payment, we do not include children who are over 2 years old, even though children are eligible up to the age of 3 and one half. This is because the FRS only contains the age of children in whole numbers. The payments are increased by 6% in 2022/23 and held constant thereafter. We use the take-up rates estimated in the Scottish Government's Benefit Take-up Strategy and hold these constant when projecting to future years.[23] We additionally disaggregate take-up of the Pregnancy and Baby Payment for first and subsequent births.[24]
We model Best Start Foods according to the eligibility criteria of the policy, with the income limits assumed to be removed by 2023/24. The payment amounts are increased in 2021 from £4.25 per week to £4.50 for children aged 1 to 2 and from £8.50 to £9.00 for children under 1, and held constant thereafter. We use the take-up rates estimated in the Scottish Government's Benefit Take-up Strategy and hold these constant when projecting to future years. We do not model the policy in 2019/20 as it was only launched in September 2019.
We model Scottish Child Payment according to the eligibility criteria of the policy. The model incorporates the increase of the payment to £25 in 2023/24 and uprates the payment by inflation each year, as per the policy regulations. We do not model bridging payments as these will only be paid in 2021 and 2022. Take-up rates for 0-to-6 year olds and 7-to-15 year olds are both taken from the Scottish Fiscal Commission's forecasts, with an increase of 1 percentage point in each take-up rate to reflect a possible increase in take-up as the benefit increases.[25]
We model Council Tax Reduction according to the eligibility criteria of the policy. For 2023/24 and 2025/26, we incorporate the changes to the scheme which are planned from 2022 to equalise treatment of cases on Universal Credit and legacy benefits.[26] Due to missing information in the FRS, council tax is imputed based on average amount by region, band and household type.[27] Twenty-five percent of the council tax bill is then assumed to be water and sewerage charges, which are discounted at 25% of the proportion of the remaining council tax bill which is reduced through CTR, with this discount rising to 35% from 2022/23.[28] Additional discounts, for example for single-person households, are not included. To model partial take-up, we apply the default take-up rates for this policy in UKMOD, which vary by tenure.
We model Free School Meals according to the eligibility criteria of the policy, with income limits uprated by inflation when projecting to future years. We exclude students in private or tertiary education, define each stage of education using the most common age group, and model the extension of universal eligibility to all primary school students for 2023/24 and 2025/26. We do not model Free School Meals for children in funded childcare. Children in special schools are included in the model but not modelled separately. We translate meals into monetary amounts using the cost per meal for primary and secondary schools in 2019/20 as reported in the Local Government Finance Statistics, multiplied by the number of days which children spend in school each year.[29] These amounts are uprated for inflation when projecting to future years. We do not model holiday meals and no take-up adjustments are made.
For School Clothing Grant, eligibility criteria and payment amounts both vary by local authority. We apply the same eligibility criteria as Free School Meals and use the average grant amount as reported in the Local Government Finance Statistics for 2019/20.[30] In subsequent years, we assume that local authorities offer the new minimum amounts, i.e. £120 for primary school students and £150 for secondary school students. No take-up adjustments are made.
For Discretionary Housing Payments, we model a benefit which fully mitigates the Removal of the Spare Room Subsidy from Universal Credit and Housing Benefit, also known as the bedroom tax. Exemptions from the bedroom tax are not modelled by default in UKMOD due to a lack of requisite information in the FRS. To ensure that we do not overestimate the impacts of DHPs, we therefore stipulate that any household with someone receiving disability benefits is exempted from the bedroom tax. Benefit cap mitigation is added in a similar manner, with the condition that a capped household can only be mitigated up to the level of their eligible rent (if on Housing Benefit) or housing element (if on Universal Credit). We do not incorporate the partial mitigation of the benefit cap which currently occurs through DHPs.
We model Carers Allowance Supplement by allocating the supplement to those who report receiving Carers Allowance. This information is taken directly from the FRS, since there is insufficient data to simulate eligibility for the benefit. The amount of the supplement is uprated by 6% in 2022/23, as per the commitment in the Delivery Plan, and thereafter by the specific uprating mechanism for this policy which is based on Jobseekers' Allowance. We do not model the temporary doubling of the payment in summer 2020 and winter 2021.
6.6 Employment policies
We model two policies from the Delivery Plan which aim to increase income from employment, namely the Employability Offer to Parents and the Social Innovation Partnership. Although these policies may have an impact in 2023/24, we only model their cumulative impacts up to and including 2025/26. The modelled outcomes are taken to be additional (i.e. over and above those which would have occurred in the absence of the policy, for example due to the natural churn of the labour market) and sustained (i.e. excluding cases in which employment status or earnings only change temporarily).
Table 5.1 outlines the number of parents which we target in our model to experience outcomes by 2025/26, along with the indicative costs. Note that the numbers of parents which we model to experience outcomes are somewhat lower than these targets. This is because we use survey data, in which each record is weighted to represent multiple individuals. We therefore select parents iteratively until the point at which selecting any additional parents would cause the total, weighted number of selected parents to exceed these targets. Note also that these outcomes are lower than the outcomes presented elsewhere in the TCPDP. This is because the numbers presented here reflect the outcomes that could be achieved up to and including 2025/26, as opposed to the ultimate potential outcomes. The modelling does not include the stretch aim of moving 12,000 parents into sustained employment.
| Employability Offer to Parents | Social Innovation Partnership | Total | |
|---|---|---|---|
| Move into work | 6,225 | 610 | 6,835 |
| Increase earnings | 2,160 | - | 2,160 |
| Cost | £455,640,000 | £46,250,000 | £501,890,000 |
For the Employability Offer to Parents, the numbers of parents modelled to experience outcomes are based on the policy reaching an anticipated 86,000 parents by 2025/26, with 51,600 supported through out-of-work support and 34,400 through in-work support. Conversion rates of 20% and 10% from reach to sustained outcomes are then applied to out-of-work and in-work participants respectively, reflecting possible improvements over the conversion rates of 8-16% observed in Fair Start Scotland for out-of-work participants and the conversion rate of 6% implied in the Work Programme Evaluation for in-work participants. 31 32 A lag of one year (for both in and out of work support) and an attrition rate of 1 percentage point per year (for out of work outcomes only) is also assumed. These are assumptions, and the rate at which the outcomes are achieved, or the period over which they are realised, may vary. Furthermore, the impacts as they appear in the FRS will depend on which of the parents who move into employment are sampled and at what point throughout the year.
We model movements into employment through the Employability Offer to Parents by first running a logit regression on the input data to predict employment status, with the data subsetted to individuals in the UK who are of working age and are not students, retired, self-employed, or receiving Carers Allowance or Employment Support Allowance. We then select non-employed parents in Scotland who are in poverty, are in at least one of the priority groups, and are predicted to have the highest probabilities of being employed until the target number is met. In reality, the policy may reach other parents, such as those who are not in poverty. For parents who move into employment, we allocate them the average working hours and wages of Fair Start Scotland participants between 2018 and 2020, with wages deflated to the price levels of each year of FRS data.[33] The modified input data are then run through UKMOD to ensure that changes in benefit eligibility and tax liability are taken into account. Similar methods have been used with UKMOD in the existing literature.[34]
We perform a similar procedure to model the in-work component of the Employability Offer to Parents. First we run a linear regression at the UK level to predict (log) earnings and assume that employees with the largest differences between actual earnings and predicted earnings are most likely to experience an increase in earnings. We then select parents in Scotland with the largest differences who are earning less than the median for their occupation and industry, are in poverty, and are in at least one of the priority groups. For those selected to experience an increase in earnings, we assign them the median level of earnings for their occupation and industry. The modified input data is then run through UKMOD.
For the Social Innovation Partnership, numbers of parents modelled to move into employment by 2025/26 are based on analysis of project-level data and the profile of projected costs. We use an assumed conversion rate of 20%, as per the Employability Offer to Parents, and select parents to move into employment using the same method. Parents selected to move into employment through the Social Innovation Partnership are modelled to work for 15 hours per week at the Real Living Wage. We will monitor employability conversion rates alongside the many other positive outcomes anticipated from the SIP and refine modelling as required.
Contact
Email: TCPU@gov.scot