Tackling child poverty delivery plan 2022-2026 - annex 4: cumulative impact assessment
This report is an annex to Best Start, Bright Futures: the second tackling child poverty delivery plan 2022 to 2026 and assesses the cumulative impact of a package of our policies on child poverty.
4. Results
4.1 Relative poverty
The latest official statistics indicate that 26% of children in Scotland lived in relative poverty in 2019/20.[5] With the policies in the Delivery Plan included, we project that the child poverty rate will fall to around 17% by 2023/24. Meanwhile, we estimate that the counterfactual poverty rate was 28% in 2019/20, falling to 27% by 2023/24. Taking the difference between these scenarios, we estimate that the child poverty rate would have been 2 percentage points higher in 2019/20 if the policy package had not been in place, with 20,000 more children living in poverty. This impact is projected to increase to 10 percentage points by 2023/24, meaning that Scottish Government policies will be keeping around 90,000 children out of poverty.
A large part of the increase in impact between 2019/20 and 2023/24 is due to the introduction and doubling of the Scottish Child Payment, followed by the further increase to £25 per child per week set out in the Delivery Plan. A number of other policies also come into effect, including mitigation of the Benefit Cap through Discretionary Housing Payments, the introduction of Best Start Foods along with the removal of income limits, the increase in minimum levels of School Clothing Grant, and the extension of universal Free School Meals to all primary school children. The interactions between the policies in the package will also contribute to the cumulative impact.
The impact of the policy package is also determined by external factors which increase the caseloads and payment amounts of the policies in the package, and which interact with these policies to lift Scottish households out of poverty. For example, high rates of forecasted inflation will trigger higher payment levels for some Scottish benefits. Meanwhile, inflationary uplifts to reserved benefits and recent reforms which increase the amount that households can earn before losing their Universal Credit award – namely the increase in work allowances and the reduction in the taper rate – will make more people eligible for those Scottish policies which use Universal Credit as a qualifying benefit.
External factors are also responsible for the steady reduction in the counterfactual poverty rate. Recent reforms to Universal Credit are likely have a particularly strong impact on measured levels of relative child poverty because they are targeted at households with children and only affect households in employment, which are likely to be closer to the poverty line than households which have no earnings. Uprating of reserved benefits can also have a significant impact on relative child poverty, particularly when inflation is high. Finally, after a slump in 2020/21, wage growth is projected to stay above trend for the subsequent three years.
A final factor which acts to drive down the child poverty rate in both scenarios is changes in the relative poverty line, which is based on median UK income. In particular, recent decisions around Income Tax (freezing the Personal Allowance) and National Insurance Contributions (the introduction of the Health and Social Care Levy) will have a greater impact on households in the middle of the income distribution than on low-income households. This will cause the poverty line to rise at a slower rate, causing more households to cross the poverty line as their incomes increase.
It is clear from this discussion that reductions in measured levels of relative poverty should be treated with caution – not only because they rely on macroeconomic forecasts and are sensitive to changes in the income distribution, both of which are uncertain, but also because they do not necessarily reflect improvements in living standards. While high rates of inflation will trigger an increase in benefit payments, in practice they will erode the living standards of many low-income households, particularly in the short term as most benefit rates are only uprated once per year based on the previous year's inflation rate. These effects will not necessarily be reflected in the relative measure of poverty, which is primarily based on nominal income.[6] Similarly, the lived experience of households in poverty may not materially improve if they exit poverty through a marginal increase in income which happens to nudge them over the poverty line, or indeed through changes elsewhere in the income distribution which shift the poverty line.
By 2025/26, the child poverty rate continues to fall in the counterfactual scenario to reach 26%, but remains broadly constant at 17% in the policy scenario. As a result, the impact of the policy package falls to 9 percentage points. This could reflect a number of factors. For example, as inflation returns to trend, relative poverty rates may be determined less by benefit income and more by wages, with some households who would have previously required benefits to stay out of poverty now staying out of poverty by virtue of their earnings. In any case, these results will depend heavily on the impacts of the Delivery Plan as well as changes in reserved policies and the wider economy.
Figure 4.1 and Table 4.1 summarise the headline results of our analysis in terms of the relative child poverty rate.
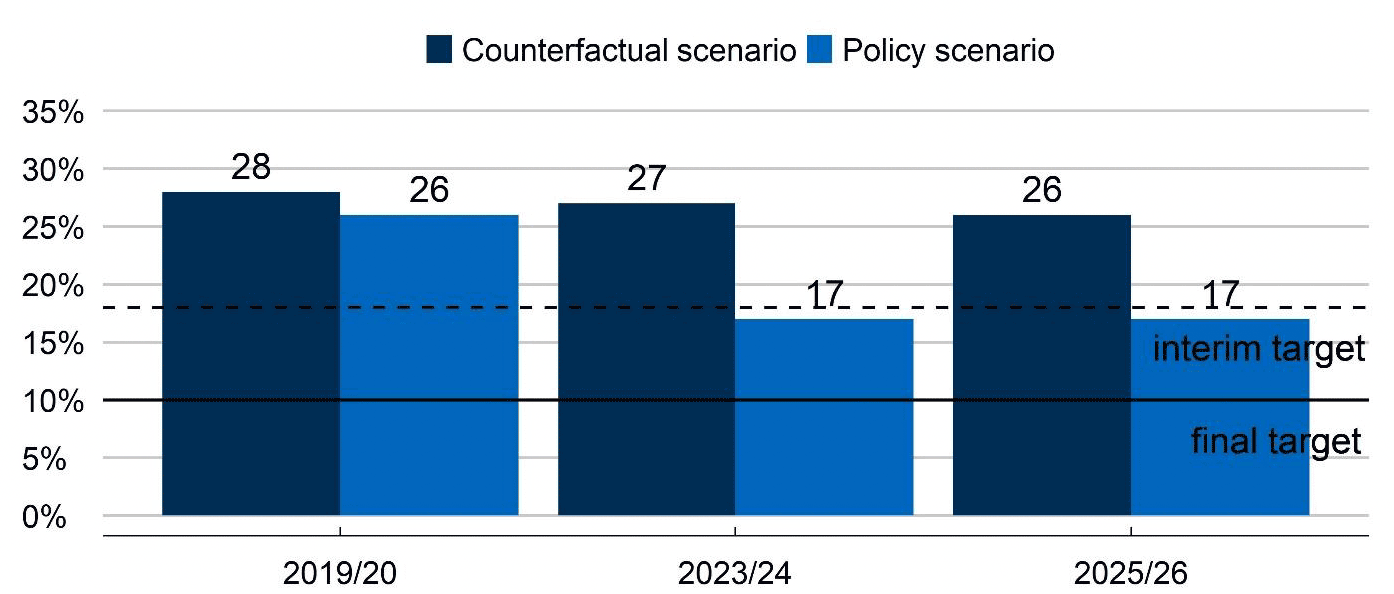
Source: Scottish Government Analysis using UKMOD
| 2019/20 | 2023/24 | 2025/26 | Change | |
|---|---|---|---|---|
| Counterfactual scenario | 28% | 27% | 26% | - 2 ppts |
| Policy scenario | 26% | 17% | 17% | - 9 ppts |
| Impact of policy package | - 2 ppts | - 10 ppts | - 9 ppts | - 7 ppts |
4.2 Absolute poverty
The latest statistics indicate that 23% of children in Scotland lived in absolute poverty in 2019/20.[7] Using the latest data at the time of writing, the modelling indicates that the child poverty rate will fall to around 16% by 2023/24. Meanwhile, we estimate that the counterfactual poverty rate was 25% in 2019/20, rising to 26% by 2023/24. Taking the difference between these scenarios, we can estimate that the child poverty rate would have been 2 percentage points higher in 2019/20 if the policy package had not been in place, with 30,000 more children living in absolute poverty. This impact is projected to increase to 10 percentage points by 2023/24, meaning that Scottish Government policies will be keeping around 90,000 children out of absolute poverty each year.
The reason that absolute poverty is not projected to fall as rapidly as relative poverty is not because the policy package has less of an impact on this measure. In fact, the measured impacts on the two measures are similar. The variance in outcomes is instead explained by the counterfactual scenario, in which child poverty is expected to rise on the absolute measure even while falling on the relative measure. This points to differences in the way that external factors feed through to measured levels of child poverty.
For example, the effects of income tax and national insurance on curbing the relative poverty line do not apply to absolutely poverty, which is not sensitive to median income. The absolute poverty line is instead uprated by inflation, which also means that inflationary increases in benefits are offset on this measure. Indeed, we project that the absolute poverty line will rise by 10% between 2019/20 and 2023/24, whereas the relative poverty line will only rise by 4%, causing the difference between the two measures to narrow. Furthermore, recent changes to Universal Credit are likely to have less of an impact on absolute poverty since they only affect households in employment, which tend to have higher incomes.
As with relative child poverty, the outlook beyond 2023/24 becomes increasingly uncertain. Our modelling indicates that absolute child poverty will fall back to 25% in the counterfactual scenario, while the projected child poverty rate will remain broadly constant at 16% in the policy scenario. As a result, the impact of the policy package reduces to 9 percentage points. This could again reflect an increasing contribution of wage growth relative to price levels as inflation returns to trend.
Figure 4.2 and Table 4.2 summarise our analysis on absolute child poverty.
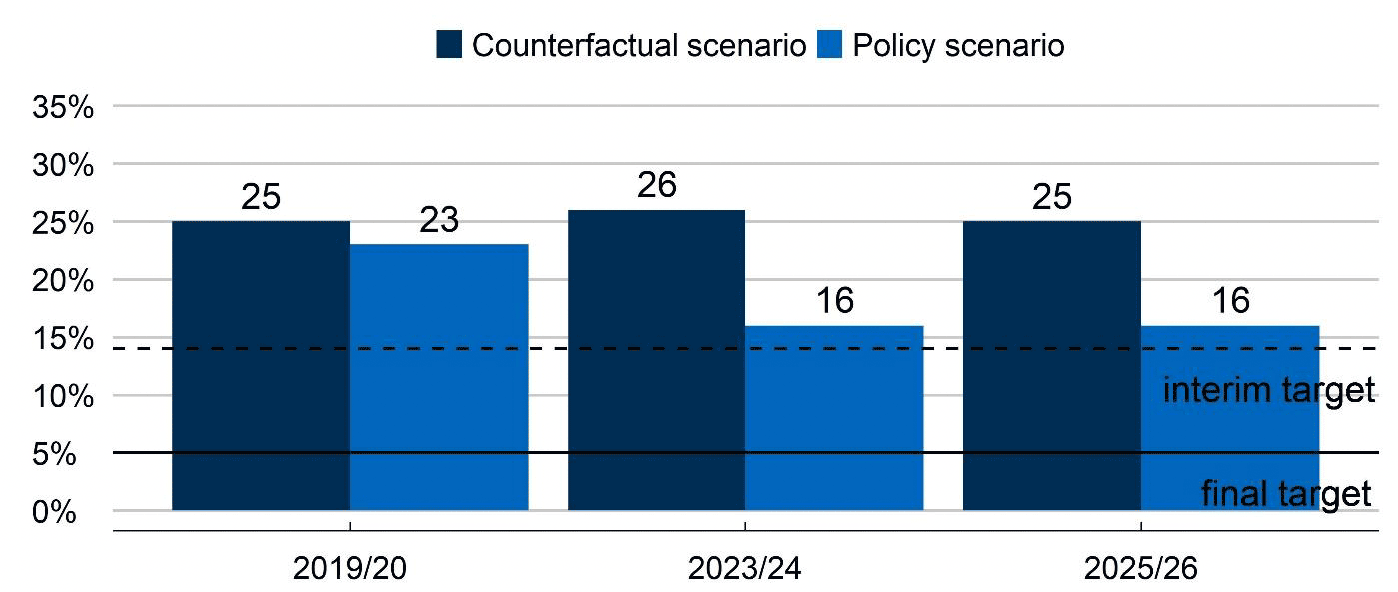
Source: Scottish Government Analysis using UKMOD
| 2019/20 | 2023/24 | 2025/26 | Change | |
|---|---|---|---|---|
| Counterfactual scenario | 25% | 26% | 25% | 0 ppts |
| Policy scenario | 23% | 16% | 16% | - 7 ppts |
| Impact of policy package | - 2 ppts | - 10 ppts | - 9 ppts | - 7 ppts |
4.3 Distributional impacts
In addition to considering aggregate poverty rates, we can assess how the policy package impacts different groups. Figure 4.3 shows the number of children affected by the policy package, with these children grouped into ten equally sized groups (deciles) of the overall population based on household income. The figure shows that more children are affected in lower-income households. Over time, an increasing number of children are affected in households across the income distribution.
However, a number of children are still not reached even in the lowest deciles. This reflects the partial take-up of benefits, including those in the policy package as well as the reserved benefits which act as qualifying benefits, underscoring the importance of maximising income for households in poverty. Note the precise results of this analysis will be sensitive to the assumptions made around take-up, as set out in the final section of this report.
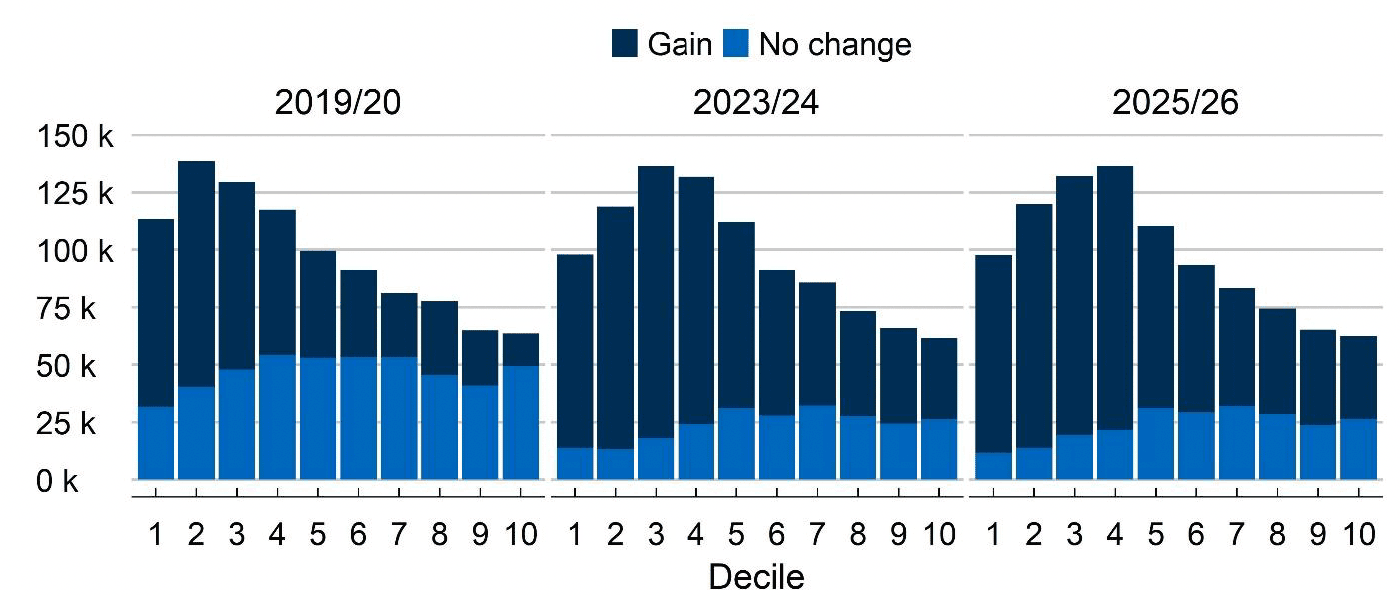
Source: Scottish Government Analysis using UKMOD
Figure 4.4 shows the average change in income among households with children, with households grouped into the same deciles as in Figure 4.3. The figure shows that households with lower incomes gain proportionately more on average, with these impacts increasing over time. For example, in 2019/20, households with children in the second decile experienced an average gain of around 5%; by 2023/24 this will increase to around 15%. However, these figures should be treated with caution, as the data on households which report very low incomes may not always be reliable.[8]
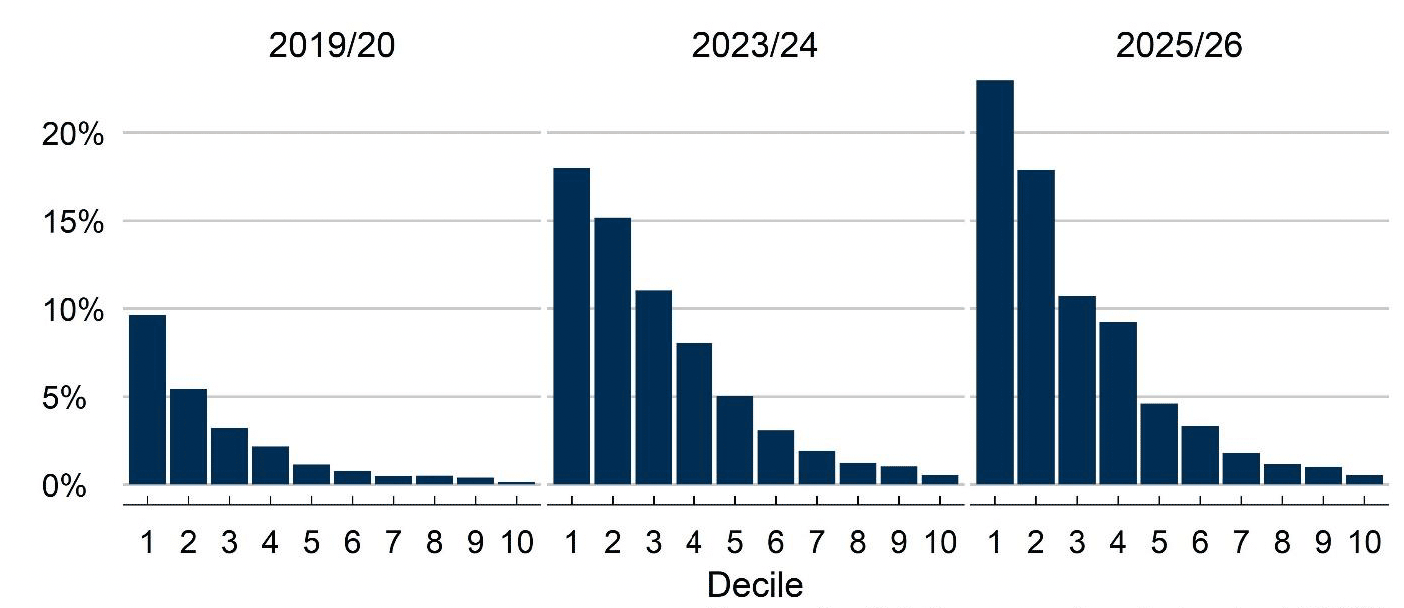
Source: Scottish Government Analysis using UKMOD
Table 4.3 presents a range of additional analysis on the impacts of the policy package. The table shows that most of the children kept out of relative poverty each year are in at least one of the priority groups, reflecting the fact that the priority groups collectively contain the majority of children in poverty. The table also shows that around half of the children kept out of poverty each year are in households with at least one adult in employment. This is somewhat lower than the proportion of children in poverty who fall within this group, which is around two-thirds.[9] Finally, measuring the impact on severe poverty allows us to assess how the policy package is affecting children in deeper poverty. The table shows that this impact increases over time, but not as much as the impacts on the headline measures. This could reflect the added penalty of incomplete take-up when new benefits are introduced, or existing benefits increased, which are conditional on taking up other benefits.
| 2019/20 | 2023/24 | 2025/26 | |
|---|---|---|---|
| Impact on relative child poverty rate (below 60% of UK median household income after housing costs) | 2 ppts (20,000 children) | 10 ppts (90,000 children) | 9 ppts (90,000 children) |
| Impact on priority child poverty rate (relative child poverty among priority group households) | 4 ppts (20,000 children) | 12 ppts (80,000 children) | 13 ppts (80,000 children) |
| Impact on working child poverty rate (relative child poverty among households in employment) | 1 ppts (10,000 children) | 6 ppts (50,000 children) | 6 ppts (50,000 children) |
| Impact on absolute child poverty rate (below 60% of 2010/11 UK median household income after housing costs) | 2 ppts (30,000 children) | 10 ppts (90,000 children) | 9 ppts (90,000 children) |
| Impact on severe child poverty rate (below 50% of UK median household income after housing costs) | 4 ppts (30,000 children) | 7 ppts (70,000 children) | 7 ppts (70,000 children) |
4.4 Targeting
The extent to which the policy package is targeted at children in poverty can help us assess its cost effectiveness. This is not completely straightforward, however. One limitation is that we do not have full information on which households take up benefits. Most of the modelling here assumes that all eligible households are equally likely to take up a given benefit, but in reality take-up may be higher among households in greater need. As a result, we may underestimate the extent to which households in poverty are reached by a given policy. A second limitation is that poverty is a relatively strict criterion for assessing cost effectiveness. Most of the policies in the package are targeted at low-income households by design, and therefore help households maintain a decent standard of living in addition to helping households move out of poverty as defined by the targets.
Table 4.4 provides breakdowns of expenditure on the policy package, with separate analysis for policies which are specifically targeted at children. This expenditure includes the modelled cost of benefit transfers, but not the associated administration costs. For employment policies, the total cost is spread equally across recipients. Because we model the cumulative impacts of these polices in 2025/26, we also include the cumulative cost rather than only the cost in that year. All expenditure figures are in nominal terms, so increases over time are to be expected in the total figures. Households in poverty include households which are kept out of poverty by the policies being measured.
In 2019/20, we estimate that around half of total expenditure on all policies in the policy package will go to households with children. With the introduction of Scottish Child Payment and Best Start Foods, the extension of universal Free School Meals to all primary students, and other changes in the policy package, this proportion increases to nearly three-quarters by 2023/24. The proportion of spend which is received by households with children in poverty also increases over this time period, but by a lower proportion, reflecting a mixture of means-tested and universal policies as well as the reduction in the counterfactual poverty rate. In terms of their poverty impacts, the cost-effectiveness of these policies is projected to improve between 2019/20 and 2023/24, with the cost per child kept out of poverty reducing from £26,000 to £14,000 per year.
Policies which are targeted at households with children include Scottish Child Payment, Best Start Grant, Best Start Foods, Free School Meals, School Clothing Grant, and the employment policies in the Delivery Plan. We estimate that around one-third of expenditure on these policies each year will go to households with children in poverty, with this proportion falling slightly in 2023/24. This reflects the fact that the new benefits (Best Start Foods and Scottish Child Payment) have similar eligibility criteria as existing benefits while other changes in the policy package (particularly the extension of universal Free School Meals) reduce the extent to which the package is targeted at low-income households. The cost effectiveness of these policies is projected to remain roughly equal over this time period, at around £10,000 per year for every child kept out of poverty.
By 2025/26, a further increase in the proportion of expenditure received by households with children is generated by the employment policies in the Delivery Plan. A particularly large increase is observed in the proportion received by households with children in poverty; among the policies targeted at children, this proportion exceeds 50%. However, these results reflect the assumptions of the model and in practice will depend on how well the policies are targeted. The flipside is that the cost per child lifted out of poverty increases, reflecting the higher per-capita cost of these policies. However, these policies may actually be more cost-effective in the long run. Whereas benefit payments represent recurring costs, the outcomes of employment policies will persist beyond the years in which costs are incurred. Furthermore, the model does not include the costs of administration for benefit payments.
| 2019/20 | 2023/24 | 2025/26 | |
|---|---|---|---|
| All policies | |||
| Proportion of expenditure received by households with children | 49% | 73% | 80% |
| Proportion of expenditure received by households with children in relative poverty | 24% | 30% | 49% |
| Expenditure required to keep each child out of relative poverty | £26,000 | £14,000 | £20,000 |
| Policies targeted at children | |||
| Proportion of expenditure received by households with children10 | 99% | 100% | 100% |
| Proportion of expenditure received by households with children in relative poverty | 39% | 34% | 59% |
| Expenditure required to keep each child out of relative poverty | £11,000 | £10,000 | £17,000 |
4.5 Work incentives
UKMOD is a static model, meaning it assumes people will not change their behaviour in response to a change in policy. However, as households receive more in means-tested benefits, they stand to lose more if their earnings increase, and this could affect their behaviour. This is important because paid work is the most sustainable way to escape poverty for many families, although work-related decisions will be determined by a wide range of factors in addition to the direct financial rewards, including the costs of transport and childcare, the conditionality attached to benefit payments, and the availability of alternative employment opportunities. The impact on work incentives can be particularly strong when it comes to benefits which are conditional on receipt of other benefits, or which have fixed income thresholds, as is the case with a number of the policies in the package. This is because recipients can face a 'cliff edge', whereby their entitlement for a given benefit can be fully withdrawn once their earnings exceed a certain level.[11]
Table 4.5 presents high-level analysis on the impact of the policy package on work incentives. To measure work incentives, we use Marginal Effective Tax Rates (METRs), defined as the proportion of additional gross earnings which are lost due to an increased tax liability and/or a reduction in benefit entitlement. For example, if a parent earns an additional £100 per week, but as a result their tax bill increases by £20 and their benefit award reduces by £55, their net gain is only £25 (£100 - £20 - £55). The METR is therefore 75% ((£100 - £25) / £100) as from the perspective of the parent 75% of the additional earnings are effectively lost. Accordingly, a higher METR indicates a lower incentive to increase earnings.
Here we assume that parents in employment take up their full benefit entitlements and then increase their gross earnings by 10%. We exclude self-employed workers and those who move into work as a result of the policy package, and do not model the incentive to enter employment in the first place. The analysis uses the UKMOD METR tool, which calculates METRs for each individual in employment on the basis of the change in household income which would occur if that individual increased their earnings. As above, poverty is defined in the counterfactual scenario, so it includes parents who are kept out of (relative) poverty by the policy package.
The table shows that a higher proportion of employed parents in poverty experience a deterioration in work incentives than employed parents overall. In 2025/26, over one-third of employed parents in poverty experience higher METRs as a result of the policy package, compared to 8% of employed parents overall. This reflects the fact that parents with lower household incomes are more likely to be eligible for means-tested benefits. On the other hand, among parents who experience a deterioration in work incentives, the average impact is lower for employed parents who are in poverty than it is for employed parents overall.[12] This is likely because, among employed parents who do experience a reduction in work incentives, those who are not in poverty are more likely to be close to a cliff edge, since their earnings are likely to be higher.[13]
| 2019/20 | 2023/24 | 2025/26 | ||
|---|---|---|---|---|
| All employed parents | Proportion experiencing higher METRs in the policy scenario | 7% | 8% | 8% |
| Among these, median METR in the counterfactual scenario | 73% | 63% | 63% | |
| Among these, median METR in the policy scenario | 79% | 83% | 81% | |
| Difference in median METRs between the two scenarios | 6 ppts | 20 ppts | 18 ppts | |
| Employed parents in poverty | Proportion experiencing higher METRs in the policy scenario | 29% | 31% | 34% |
| Among these, median METR in the counterfactual scenario | 75% | 70% | 69% | |
| Among these, median METR in the policy scenario | 82% | 83% | 80% | |
| Difference in median METRs between the two scenarios | 7 ppts | 13 ppts | 11 ppts |
Contact
Email: TCPU@gov.scot