Affordable Housing Securing Planning Consent, 2005-2008
Numbers of units granted consent for affordable housing.
2. COMPARATIVE ANALYSIS
- Section 2 provides analysis on the location of affordable housing granted planning consent relative to a) The Scottish Index of Multiple Deprivation 2006 ( SIMD) and b) The Scottish Government Urban-Rural Classification Scheme (2007-2008).
- The SIMD 2006 project identifies small areas of multiple deprivation across all of Scotland. Further information on SIMD 2006 is available in the Annex.
- Table and Chart 2 below show the amount of affordable housing granted planning consent for each deprivation decile, and how this is split between affordable housing contributed solely by the public sector and affordable housing containing a form of developer contribution.
Chart 2: Contribution Towards Affordable Housing by Deprivation Decile, 2005/08
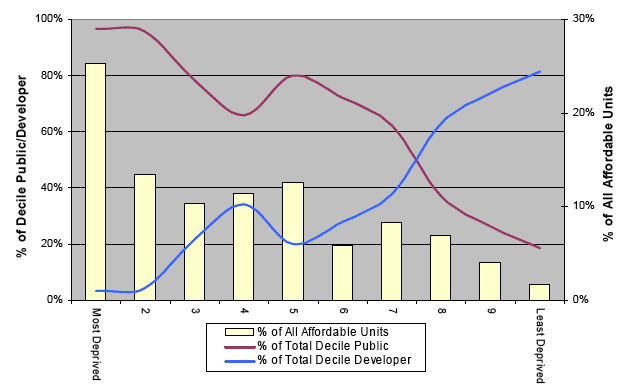
Table 2: Contribution Towards Affordable Housing by Deprivation Decile, 2005/08 1-2
Deprivation Decile ( SIMD 2006) |
Type of Affordable Housing Contribution (Units) |
||||||
|---|---|---|---|---|---|---|---|
Entirely Public |
% of all Public |
Developer |
% of all Developer |
% of All Affordable Units |
% of Total Decile Public 3 |
% of Total Decile Developer 3 |
|
Highest Deprivation |
4,605 |
32% |
162 |
4% |
25% |
97% |
3% |
2 |
2,405 |
17% |
112 |
3% |
13% |
96% |
4% |
3 |
1,523 |
11% |
428 |
10% |
10% |
78% |
22% |
4 |
1,414 |
10% |
736 |
17% |
11% |
66% |
34% |
5 |
1,875 |
13% |
474 |
11% |
13% |
80% |
20% |
6 |
795 |
6% |
309 |
7% |
6% |
72% |
28% |
7 |
964 |
7% |
585 |
13% |
8% |
62% |
38% |
8 |
478 |
3% |
817 |
18% |
7% |
37% |
63% |
9 |
201 |
1% |
563 |
13% |
4% |
26% |
74% |
Lowest Deprivation |
59 |
0% |
258 |
6% |
2% |
19% |
81% |
SCOTLAND |
14,319 |
100% |
4,444 |
100% |
100% |
76% |
24% |
1. 2005-2008 Analysis uses the results of the SIMD 2006 General Report, published in October 2006
2. Excludes Information from Moray for all years, and Argyll and Bute and Clackmannanshire for 2007/08
3. As a percentage of the total affordable units granted planning consent within decile
- Chart and Table 2 show that the amount of affordable housing granted planning consent generally decreases as datazones get progressively less deprived. 25 per cent of all affordable housing granted planning consent lies within the 10 per cent most deprived areas. This is in contrast to the 10 per cent least deprived areas in Scotland, where only 2 per cent of all affordable housing granted planning consent is situated. This relationship is a little more varied in the mid-range of deprivation deciles.
- The proportion of consented affordable housing that is entirely publicly funded generally decreases as datazones become less deprived. At the same time, the proportion of affordable housing that has some type of developer contribution generally increases. Again this relationship is a little more varied in the mid-range of deprivation deciles.
- Whilst affordable housing with a developer contribution accounts for more than two-thirds of all consented affordable housing in the 3 lowest-deprivation deciles (i.e. 8, 9 and 10), this is of a much smaller base of affordable housing than has had planning consent in the 3 highest-deprivation deciles (1,2 and 3). 49 per cent of all consented affordable housing is situated in the 30 per cent most deprived areas and this is split between 8,533 (92 per cent) entirely publicly funded and 702 (8 per cent) with a developer contribution. Conversely, 13 per cent of all consented affordable housing is situated in the 30 per cent least deprived areas with 31 per cent entirely publicly funded (738) and 69 per cent with a developer contribution (1,638).
- Table 3 (below) shows a breakdown of affordable housing granted planning consent (during 2005/08) by urban/rural classification. More information on the Scottish Government's urban rural classification system is available in the Annex.
- 42 per cent (7,968) of affordable housing units granted planned consent during 2005/08 are situated within 'large urban areas'. A further 4,931 units (26 per cent) are within 'other urban areas'. 3,789 units (20 per cent) are within 'accessible rural' and 'remote rural' areas.
- Proportionally more of the proposed entirely publicly funded units (45 per cent) are within large urban areas, compared to 36 per cent of proposed units with a developer contribution. Units funded entirely by public means are in the majority irrespective of the urban/rural classification. This ranges from 56 per cent (1,198 out of 2,154 units) of all consented affordable housing in 'other urban areas' to 81 per cent (4,003 out of 4,931 units) of all consented affordable housing in 'accessible rural' areas.
Table 3: Contribution Towards Affordable Housing by Urban/Rural Classification, 2005/08 1-2
Urban/Rural Classification |
Type of Affordable Housing Contribution (Units) |
||||||
|---|---|---|---|---|---|---|---|
Entirely Public |
% of all Public |
Developer |
% of all Developer |
% of All Affordable Units |
% of Total Area Public 3 |
% of Total Area Developer 3 |
|
Large Urban Areas |
6,375 |
45% |
1,593 |
36% |
42% |
80% |
20% |
Other Urban Areas |
4,003 |
28% |
928 |
21% |
26% |
81% |
19% |
Accessible Small Towns |
599 |
4% |
297 |
7% |
5% |
67% |
33% |
Remote Small Towns |
854 |
6% |
325 |
7% |
6% |
72% |
28% |
Accessible Rural |
1,198 |
8% |
956 |
22% |
11% |
56% |
44% |
Remote Rural |
1,290 |
9% |
345 |
8% |
9% |
79% |
21% |
SCOTLAND |
14,319 |
100% |
4,444 |
100% |
100% |
76% |
24% |
1. 2005-2008 Analysis uses the results of the Scottish Government Urban Rural Classification System (2007-2008)
2. Excludes Information from Moray for all years, and Argyll and Bute and Clackmannanshire for 2007/08
3. As a percentage of the total affordable units granted planning consent within area