Scottish Local Government Financial Statistics 2009-10
Scottish Local Government Financial Statistics 2009-10
2 LOCAL GOVERNMENT INCOME - WHERE THE MONEY COMES FROM
KEY SUMMARY FACTS
- Total Revenue income in 2009-10 was £17.9 billion.
- Total Capital income in 2009-10 was £1.1 billion.
- Council Tax income was £1.9 billion.
- There were 2,377,474 Council Tax chargeable dwellings in September 2010.
- The Scotland average Council Tax band D level was £1,149 in 2009-10.
- Distributable Non-domestic rate income in 2009-10 was £2.2 billion.
- There were 213,311 properties on the Valuation Roll at 1 April 2010 with a total rateable value of £6,612 million.
- Total capital grants in 2009-10 were £875 million.
- Total capital receipts in 2009-10 were £229 million.
- General Revenue Funding ( GRF) income in 2009-10 was £7.8 billion.
- Total Revenue Funding ( TRF) in 2009-10 was £10.8 billion.
The main sources of Local Government income are 1:
- Grants from the Scottish Government consisting of Revenue Grants and Capital Grants
- Local Taxes consisting of Council Tax and Non-domestic Rates
- Sales, Fees and Charges
- Other Revenue Income
- Capital Receipts from asset sales
- Other Capital Income
- Investment Income
Table 2.1 - Summary of Local Government Income by Source
£ Million
2005-06 |
2006-07 |
2007-08 |
2008-09 |
2009-10 |
|
|---|---|---|---|---|---|
Revenue Income |
|||||
Revenue Grants 1 |
8,862 |
9,284 |
9,834 |
10,377 |
10,845 |
Council Tax 2 |
1,720 |
1,812 |
1,890 |
1,909 |
1,910 |
Non Domestic rates |
1,897 |
1,884 |
1,860 |
1,963 |
2,165 |
Sales, Rents, Fees & Charges |
1,959 |
2,047 |
2,132 |
2,262 |
2,287 |
Other income 3,4 |
1,153 |
1,001 |
883 |
770 |
676 |
Total revenue income |
15,591 |
16,027 |
16,599 |
17,281 |
17,883 |
Capital Income |
|||||
Capital Receipts |
366 |
451 |
514 |
230 |
229 |
Government Grants |
210 |
520 |
707 |
595 |
760 |
Other Grants and Contributions |
72 |
93 |
142 |
155 |
115 |
Other Income |
3 |
2 |
. |
. |
. |
Total capital income |
651 |
1,066 |
1,362 |
979 |
1,105 |
TOTAL INCOME |
16,242 |
17,094 |
17,961 |
18,260 |
18,988 |
1. Includes Council Tax Benefit ( CTB)
2. Excludes CTB
3. See section 2.5 for more detail on what is contained under other revenue income.
4. No longer includes Superannuation Fund income. For this figure, see Table 5.3.
Chart 2.1 - Summary of income by source, 2009-10
2.1 Revenue Grants
The main sources of revenue income for local government are General Revenue Funding, formerly referred to as the Revenue Support Grant, and Ring-fenced Revenue Grants, formerly referred to as Specific Grants. Together with non-domestic rates income, these sources of income constitute Total Revenue Funding ( TRF), formerly referred to as Aggregate External Finance.
General Revenue Funding ( GRF) is paid by the Scottish Government in support of local authorities' general net revenue expenditure. It is the residual element after non-domestic rates income and ring-fenced revenue grants have been deducted from TRF. Unlike ring-fenced revenue grants, no conditions are imposed on how the money is spent.
Ring-fenced revenue grants are made to local authorities for a specific named purpose, or with the intention of achieving a specific policy objective. The relevant policy division of the Scottish Government allocates each local authority's share of ring-fenced revenue grants.
The total amounts of ring-fenced revenue grants within TRF are determined in advance as part of the local authority finance settlement. As well as the ring-fenced revenue grants which form part of TRF, local authorities can receive other grants in addition to TRF. These grants are demand led and generally do not have an established means of distribution that can be applied in advance. Table 2.2 below shows a breakdown of the Revenue Grants received by local authorities and their growth over time.
Table 2.2 - Revenue Grants
£ thousands
2005-06 |
2006-07 |
2007-08 |
2008-09 |
2009-10 |
|
|---|---|---|---|---|---|
General Revenue Funding 1 |
5,567,902 |
5,777,204 |
6,169,645 |
7,425,884 |
7,756,689 |
Ring-fenced Revenue Grants 2 |
756,874 |
888,171 |
869,938 |
723,776 |
757,818 |
Council Tax Benefit Subsidy |
354,067 |
359,159 |
354,030 |
351,165 |
368,381 |
Other Grants and Subsidies 3 |
2,183,263 |
2,259,326 |
2,440,774 |
1,875,863 |
1,962,249 |
Total Revenue Grants |
8,862,106 |
9,283,860 |
9,834,387 |
10,376,688 |
10,845,137 |
1. Prior to 2008-09 this was Revenue Support Grant
2. Prior to 2008-09 this was Specific Grants
3. Decrease in 2008-09 due to rolling up of previously ring-fenced grants
In the 2008-09 local government finance revenue settlement, many formerly ring-fenced revenue grants were rolled up into GRF. A few examples 2 of these rolled up grants include the Supporting People Grant, the Strategic Waste Fund and the National Priorities Action Fund. These formerly ring-fenced grants would have been recorded as either Ring-fenced Revenue Grants or Other Grants and Subsidies for the financial years up to and including 2007-08. From 2008-09, the rolled up grants have been recorded as part of GRF. As a result of this change to grant distribution and recording, the level of GRF is showing a much larger than usual increase from 2007-08 to 2008-09, while both Ring-fenced Revenue Grants and Other Grants and Subsidies are showing corresponding decreases in their level of funding from 2007-08 to 2008-09.
2.2 Council Tax
Council Tax was introduced in Scotland on the 1 st April 1993 to replace the Community Charge system. It is a tax system based on dwellings. A dwelling is classified as any kind of flat or house that is used as a place of residence. Each dwelling is placed into one of the 8 council tax bands (A to H) depending on the market value of the dwelling as at the 1 st April 1991. Table 2.3 details the band boundaries, the ratio to band D council tax (the multiplier) and the number of chargeable dwellings in each band by local authority.
Table 2.3 - Chargeable Dwellings 1 by Council Tax Band & Local Authority (as at 6 September 2010)
Band A |
Band B |
Band C |
Band D |
Band E |
Band F |
Band G |
Band H |
Total |
|
|---|---|---|---|---|---|---|---|---|---|
Valuation band ranges |
Under 27,000 |
27,001 to 35,000 |
35,001 to 45,000 |
45,001 to 58,000 |
58,001 to 80,000 |
80,001 to 106,000 |
106,001 to 212,000 |
Over 212,000 |
|
Ratio to band D |
6/9 |
7/9 |
8/9 |
1 |
11/9 |
13/9 |
15/9 |
18/9 |
|
Scotland |
517,443 |
567,337 |
378,367 |
305,885 |
312,142 |
173,300 |
111,230 |
11,770 |
2,377,474 |
Aberdeen City |
19,517 |
25,873 |
16,655 |
11,784 |
13,048 |
7,751 |
6,926 |
789 |
102,343 |
Aberdeenshire |
19,589 |
15,334 |
13,400 |
16,135 |
19,431 |
14,015 |
8,481 |
514 |
106,899 |
Angus |
14,417 |
12,202 |
6,687 |
7,794 |
6,940 |
2,817 |
1,472 |
144 |
52,473 |
Argyll & Bute |
7,305 |
9,353 |
8,712 |
5,713 |
6,920 |
3,880 |
2,631 |
208 |
44,722 |
Clackmannanshire |
6,065 |
6,973 |
1,906 |
2,384 |
3,080 |
1,744 |
788 |
41 |
22,981 |
Dumfries & Galloway |
10,705 |
22,029 |
11,218 |
9,319 |
9,891 |
4,645 |
2,252 |
154 |
70,213 |
Dundee City |
25,275 |
15,361 |
7,799 |
7,969 |
6,163 |
2,165 |
977 |
33 |
65,742 |
East Ayrshire |
25,657 |
9,189 |
4,652 |
6,211 |
5,795 |
2,732 |
828 |
41 |
55,105 |
East Dunbartonshire |
1,130 |
3,539 |
7,928 |
6,986 |
10,711 |
6,588 |
5,843 |
536 |
43,261 |
East Lothian |
1,127 |
8,818 |
14,053 |
5,395 |
5,588 |
4,333 |
3,487 |
595 |
43,396 |
East Renfrewshire |
1,212 |
4,992 |
3,803 |
6,060 |
7,854 |
5,843 |
5,734 |
670 |
36,168 |
Edinburgh, City of |
20,166 |
42,806 |
39,509 |
33,112 |
34,819 |
22,012 |
19,350 |
3,458 |
215,232 |
Eilean Siar |
4,482 |
3,569 |
2,667 |
1,622 |
1,041 |
154 |
31 |
4 |
13,570 |
Falkirk |
21,456 |
18,758 |
6,317 |
8,095 |
8,027 |
4,711 |
2,117 |
59 |
69,540 |
Fife |
39,050 |
46,632 |
20,596 |
18,308 |
21,109 |
11,786 |
5,718 |
367 |
163,566 |
Glasgow City |
62,373 |
73,713 |
60,254 |
36,004 |
25,179 |
11,189 |
5,745 |
604 |
275,061 |
Highland |
18,638 |
22,021 |
21,360 |
16,884 |
16,652 |
8,045 |
3,813 |
307 |
107,720 |
Inverclyde |
19,233 |
5,228 |
3,100 |
3,120 |
3,308 |
1,754 |
1,358 |
202 |
37,303 |
Midlothian |
948 |
11,834 |
9,954 |
4,158 |
4,019 |
2,373 |
1,624 |
155 |
35,065 |
Moray |
11,318 |
9,873 |
5,870 |
5,541 |
4,997 |
1,776 |
545 |
51 |
39,971 |
North Ayrshire |
21,293 |
17,880 |
6,350 |
6,308 |
8,477 |
3,380 |
1,140 |
50 |
64,878 |
North Lanarkshire |
52,475 |
36,204 |
18,110 |
14,776 |
14,668 |
6,905 |
2,415 |
118 |
145,671 |
Orkney Islands |
2,312 |
2,632 |
2,038 |
1,555 |
1,090 |
224 |
18 |
3 |
9,872 |
Perth & Kinross |
8,509 |
14,161 |
10,976 |
9,787 |
10,867 |
6,757 |
5,238 |
618 |
66,913 |
Renfrewshire |
12,354 |
25,018 |
13,064 |
10,657 |
9,920 |
5,522 |
3,197 |
180 |
79,912 |
Scottish Borders |
15,745 |
12,189 |
6,305 |
5,453 |
5,915 |
4,244 |
3,822 |
410 |
54,083 |
Shetland Islands |
2,893 |
1,726 |
2,550 |
1,645 |
1,176 |
216 |
54 |
0 |
10,260 |
South Ayrshire |
6,972 |
12,229 |
8,362 |
7,964 |
9,255 |
4,504 |
2,868 |
259 |
52,413 |
South Lanarkshire |
34,975 |
28,617 |
23,945 |
18,353 |
17,581 |
9,943 |
5,300 |
389 |
139,103 |
Stirling |
5,459 |
8,147 |
3,918 |
4,030 |
5,780 |
4,820 |
4,547 |
618 |
37,319 |
West Dunbartonshire |
7,683 |
16,584 |
7,212 |
5,446 |
4,095 |
1,517 |
564 |
41 |
43,142 |
West Lothian |
17,110 |
23,853 |
9,097 |
7,317 |
8,746 |
4,955 |
2,347 |
152 |
73,577 |
1. Excludes dwellings exempt from council tax
Each local authority determines its own level of council tax as part of their budget setting process, and is responsible for its billing and collection. Council tax is used as a source of funding to make up the difference between the amount of money a local authority wishes to spend, and the amount of funding it receives from other sources (such as GRF and ring-fenced revenue grants). The Scotland band D council tax level, and its change over time, can be seen in table 2.4.
Table 2.4 - Scotland Council Tax Levels
2005-06 |
2006-07 |
2007-08 |
2008-09 |
2009-10 |
2010-11 |
|
|---|---|---|---|---|---|---|
Scotland Average Band D Council Tax (£) 1 |
1,094 |
1,129 |
1,149 |
1,149 |
1,149 |
1,149 |
Band D % increase (cash terms) |
3.9 |
3.2 |
1.8 |
0.0 |
0.0 |
0.0 |
Band D % increase (real terms 2) |
1.8 |
0.5 |
-1.2 |
-3.2 |
-1.5 |
-2.2 |
Average Council Tax Bill per Dwelling (£) 3 |
925 |
958 |
980 |
983 |
987 |
985 |
1. In 2010-11, Council Tax rates were frozen in all local authorities at 2007-08 levels.
2. Real terms figures are calculated using GDP deflators
3. This average is taken over all chargeable dwellings and is affected by a number of factors such as the distribution of dwellings across council tax bands, discounts and exemptions.
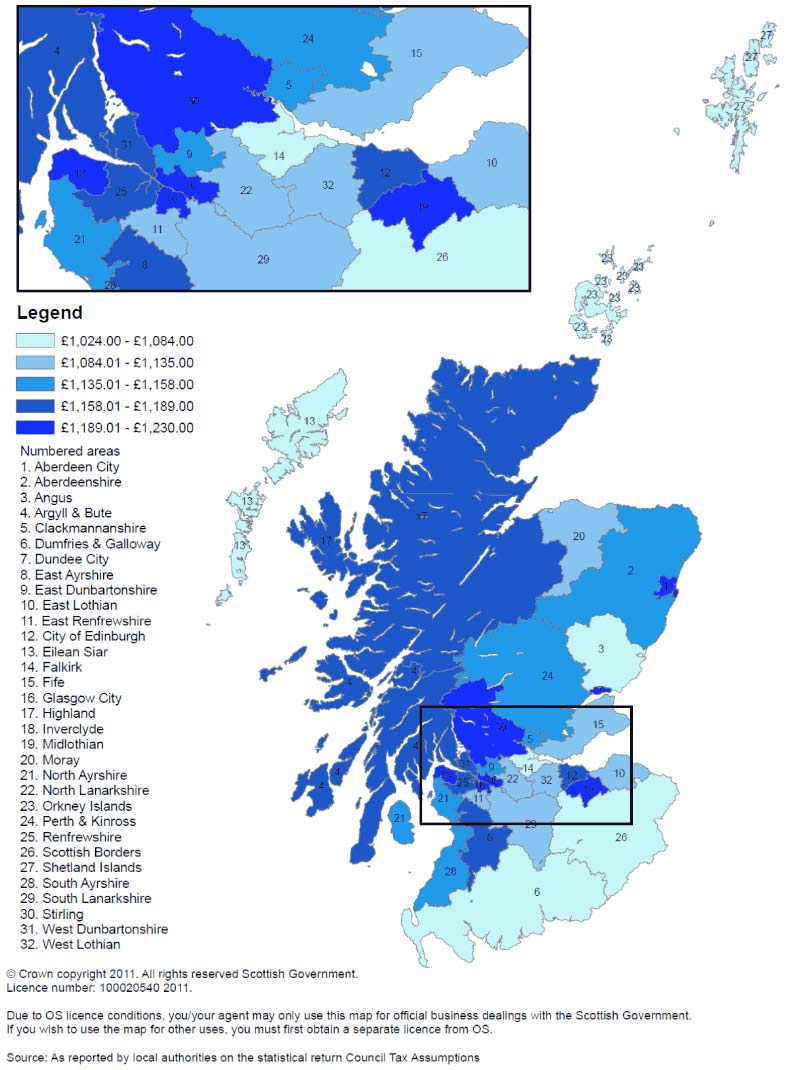
Each individual bill is calculated by applying the multiplier for each band (see table 2.3) to the band D level, (and then any discounts are applied). Therefore, bills vary according to council tax band, but also by Local Authority as shown in Map 2.1. The changes in Band D council tax levels by local authority over time are shown in table 2.5.
Table 2.5 - Band D Council Tax by Local Authority (£)
2005-06 |
2006-07 |
2007-08 |
2008-09 |
2009-10 |
2010-11 |
|
|---|---|---|---|---|---|---|
Scotland |
1,094 |
1,129 |
1,149 |
1,149 |
1,149 |
1,149 |
Aberdeen City |
1,162 |
1,196 |
1,230 |
1,230 |
1,230 |
1,230 |
Aberdeenshire |
1,065 |
1,113 |
1,141 |
1,141 |
1,141 |
1,141 |
Angus |
1,037 |
1,072 |
1,072 |
1,072 |
1,072 |
1,072 |
Argyll & Bute |
1,117 |
1,156 |
1,178 |
1,178 |
1,178 |
1,178 |
Clackmannanshire |
1,074 |
1,127 |
1,148 |
1,148 |
1,148 |
1,148 |
Dumfries & Galloway |
988 |
1,018 |
1,049 |
1,049 |
1,049 |
1,049 |
Dundee City |
1,180 |
1,211 |
1,211 |
1,211 |
1,211 |
1,211 |
East Ayrshire |
1,116 |
1,171 |
1,189 |
1,189 |
1,189 |
1,189 |
East Dunbartonshire |
1,078 |
1,121 |
1,142 |
1,142 |
1,142 |
1,142 |
East Lothian |
1,069 |
1,096 |
1,118 |
1,118 |
1,118 |
1,118 |
East Renfrewshire |
1,053 |
1,105 |
1,126 |
1,126 |
1,126 |
1,126 |
Edinburgh, City of |
1,126 |
1,152 |
1,169 |
1,169 |
1,169 |
1,169 |
Eilean Siar |
956 |
999 |
1,024 |
1,024 |
1,024 |
1,024 |
Falkirk |
999 |
1,045 |
1,070 |
1,070 |
1,070 |
1,070 |
Fife |
1,050 |
1,091 |
1,118 |
1,118 |
1,118 |
1,118 |
Glasgow City |
1,213 |
1,213 |
1,213 |
1,213 |
1,213 |
1,213 |
Highland |
1,086 |
1,135 |
1,163 |
1,163 |
1,163 |
1,163 |
Inverclyde |
1,176 |
1,206 |
1,198 |
1,198 |
1,198 |
1,198 |
Midlothian |
1,176 |
1,210 |
1,210 |
1,210 |
1,210 |
1,210 |
Moray |
1,045 |
1,096 |
1,135 |
1,135 |
1,135 |
1,135 |
North Ayrshire |
1,075 |
1,125 |
1,152 |
1,152 |
1,152 |
1,152 |
North Lanarkshire |
1,041 |
1,077 |
1,098 |
1,098 |
1,098 |
1,098 |
Orkney Islands |
973 |
1,007 |
1,037 |
1,037 |
1,037 |
1,037 |
Perth & Kinross |
1,088 |
1,136 |
1,158 |
1,158 |
1,158 |
1,158 |
Renfrewshire |
1,091 |
1,143 |
1,165 |
1,165 |
1,165 |
1,165 |
Scottish Borders |
1,019 |
1,064 |
1,084 |
1,084 |
1,084 |
1,084 |
Shetland Islands |
981 |
1,017 |
1,053 |
1,053 |
1,053 |
1,053 |
South Ayrshire |
1,063 |
1,111 |
1,154 |
1,154 |
1,154 |
1,154 |
South Lanarkshire |
1,040 |
1,076 |
1,101 |
1,101 |
1,101 |
1,101 |
Stirling |
1,149 |
1,201 |
1,223 |
1,209 |
1,209 |
1,209 |
West Dunbartonshire |
1,113 |
1,138 |
1,163 |
1,163 |
1,163 |
1,163 |
West Lothian |
1,074 |
1,101 |
1,128 |
1,128 |
1,128 |
1,128 |
Map 2.1 Band D Council Tax bill amount per local authority, 2009-10
Not all dwellings are liable to pay full council tax. A dwelling may be eligible for a discount or exemption dependent on the personal circumstances of the persons resident in the dwelling. If a dwelling is exempt there is no council tax payable in respect of that dwelling. If a dwelling is eligible for a discount then the discount may range from 10% to 50% depending on the nature of the discount.
An exempt dwelling can be occupied or unoccupied. Examples of unoccupied exempt dwellings include dwellings that are unoccupied and unfurnished for up to 6 months, dwellings that cannot be occupied because they are in need of structural repair, or are being improved or reconstructed, or an unoccupied dwelling where the liable person was formerly resident and has moved to receive personal care elsewhere. Occupied dwellings eligible for exemption include dwellings that are the sole residence of only persons under the age of 18, dwellings occupied only by students, and dwellings used as trial flats by registered housing associations.
Where only one council tax liable adult resides in a dwelling they are entitled to claim a 25% discount on their council tax bill. Where a dwelling is classed as a second home or long term empty, that dwelling is entitled to claim a discount of between 10% and 50% depending on the Local Authority. Unoccupied dwellings may also be eligible for a 50% discount for the 6 months after the initial 6 month exemption.
A breakdown of council tax dwellings by classification as chargeable, discounted, or exempt from 2006 to 2010 is given below in table 2.6.
Table 2.6 - Chargeable dwellings, Discounts and Exemptions 1
2006 |
2007 |
2008 |
2009 |
2010 |
|
|---|---|---|---|---|---|
Total dwellings |
2,417,759 |
2,442,284 |
2,462,571 |
2,477,397 |
2,488,928 |
Dwellings exempt |
103,105 |
106,394 |
112,838 |
112,168 |
111,454 |
Chargeable dwellings |
2,314,654 |
2,335,890 |
2,349,733 |
2,365,229 |
2,377,474 |
Chargeable dwellings subject to: |
|||||
25% discount |
918,199 |
929,326 |
929,246 |
936,957 |
941,915 |
Second Homes 2 |
36,167 |
35,057 |
35,036 |
37,060 |
38,002 |
Long Term Empty 2 |
16,656 |
20,328 |
22,784 |
22,169 |
24,598 |
Occupied entirely by disregarded adults |
4,283 |
3,394 |
1,986 |
2,668 |
1,887 |
Dwellings not subject to discount |
1,339,349 |
1,347,785 |
1,360,681 |
1,366,375 |
1,371,072 |
1. As at the first Monday in September of each year
2. It is not possible for some councils to separately identify second homes and long term empty dwellings. For these councils, the total number of second homes and long term empty dwellings have been recorded under second homes.
At the start of each financial year local authorities issue council tax bills to households liable for each bill. Local authorities collect council tax income relating to these bills, and also continue to collect late amounts from previous billing years 3. At the end of the financial year each local authority reports the amount of council tax it has collected to the Scottish Government. The amounts of council tax income collected in-year for 2009-10 (relating to that billing year) are reported in table 2.7 below.
Table 2.7 - Council Tax Income by Local Authority, 2009-10
£ thousands
Council Tax Income (excl CTB)1 |
Council Tax Benefit Subsidy ( CTB) |
Council Tax Income (incl CTB) 1 |
|
|---|---|---|---|
Scotland |
1,909,627 |
368,381 |
2,278,008 |
Aberdeen City |
94,361 |
11,020 |
105,381 |
Aberdeenshire |
108,239 |
8,490 |
116,729 |
Angus |
39,588 |
5,809 |
45,397 |
Argyll & Bute |
40,191 |
5,836 |
46,027 |
Clackmannanshire |
17,789 |
3,602 |
21,391 |
Dumfries & Galloway |
52,566 |
8,971 |
61,537 |
Dundee City |
45,404 |
13,158 |
58,562 |
East Ayrshire |
37,537 |
10,057 |
47,594 |
East Dunbartonshire |
47,603 |
4,945 |
52,548 |
East Lothian |
39,531 |
5,560 |
45,091 |
East Renfrewshire |
39,909 |
4,008 |
43,917 |
Edinburgh, City of |
197,448 |
29,950 |
227,398 |
Eilean Siar |
8,335 |
1,833 |
10,168 |
Falkirk |
50,695 |
8,668 |
59,363 |
Fife |
128,394 |
22,396 |
150,790 |
Glasgow City |
178,739 |
72,590 |
251,329 |
Highland |
94,275 |
13,158 |
107,433 |
Inverclyde |
25,867 |
7,188 |
33,055 |
Midlothian |
31,861 |
5,139 |
37,000 |
Moray |
33,065 |
4,055 |
37,120 |
North Ayrshire |
45,547 |
11,675 |
57,222 |
North Lanarkshire |
95,634 |
26,252 |
121,886 |
Orkney Islands |
6,748 |
888 |
7,636 |
Perth & Kinross |
64,245 |
6,763 |
71,008 |
Renfrewshire |
62,024 |
13,412 |
75,436 |
Scottish Borders |
43,159 |
5,757 |
48,916 |
Shetland Islands |
7,705 |
775 |
8,480 |
South Ayrshire |
44,037 |
8,744 |
52,781 |
South Lanarkshire |
104,730 |
22,645 |
127,375 |
Stirling |
38,861 |
4,824 |
43,685 |
West Dunbartonshire |
28,691 |
10,019 |
38,710 |
West Lothian |
56,849 |
10,194 |
67,043 |
1- Includes Community Charge
2.3 Non-Domestic Rates
The principles of Non-domestic Rates ( NDR) were established in the Lands Valuation (Scotland) Act of 1854. This Act also provided for the appointment of Assessors, who are responsible for determining the classification of a property as domestic or non-domestic and assigning a valuation. A non-domestic property is an individual property used for non-domestic purposes. They can include businesses, public buildings and advertising hoardings. The value given to a property is called its rateable value. Assessors list each property on the Valuation Roll with its corresponding rateable value that is used to calculate its NDR bill. Tables 2.8 and 2.9 show the composition of the properties on the Valuation Roll by Classification, Local Authority and Valuation band.
Business rate revaluations normally take place every five years. The most recent revaluation came into effect on 1 April 2010. The purpose of revaluation is to ensure that the tax burden is distributed fairly by taking account of changes over time in market conditions and individual business circumstances. At each revaluation, the Scottish Assessors, who are independent of both the Scottish Government and local authorities, assess a rateable value for each non-domestic (business) property in Scotland by taking account of the type and nature of the property in question. The next revaluation is scheduled to take effect on 1 April 2015.
Table 2.8 - Non-Domestic Rates Properties by Classification (as at 1 April 2010)
CATEGORY |
Number of properties |
Rateable value (£000s) |
|---|---|---|
1 st April 2010 |
1 st April 2010 |
|
Advertising |
1,973 |
8,399 |
Care Facilities |
3,199 |
102,476 |
Communications |
389 |
15,303 |
Cultural |
1,362 |
41,298 |
Education and Training |
3,938 |
496,220 |
Garages and Petrol Stations |
4,456 |
66,184 |
Health and Medical |
3,109 |
191,821 |
Hotels |
4,580 |
179,631 |
Industrial Subjects |
45,112 |
1,106,609 |
Leisure, Entertainment, Caravans etc. |
18,506 |
225,872 |
Offices |
36,648 |
1,110,188 |
Other |
12,774 |
85,074 |
Petrochemical |
145 |
112,707 |
Public Houses |
4,021 |
117,322 |
Public Service Subjects |
10,117 |
310,328 |
Quarries, Mines, etc. |
705 |
24,187 |
Religious |
6,304 |
53,305 |
Shops |
52,670 |
1,586,233 |
Sporting Subjects |
2,753 |
17,948 |
Statutory Undertaking |
550 |
761,381 |
TOTAL ALL NON-DOMESTIC PROPERTIES |
213,311 |
6,612,485 |
Table 2.9 - Non-Domestic Rates Properties by Local Authority (as at 1 April 2010) 1
Local Authority |
Rateable Value Band |
Total Non-Domestic Properties |
||
|---|---|---|---|---|
<= £18,000 |
£18,001 to £34,999 |
>= £35,000 |
||
Scotland |
164,514 |
19,911 |
28,886 |
213,311 |
Aberdeen City |
4,879 |
1,143 |
2,248 |
8,270 |
Aberdeenshire |
9,127 |
751 |
919 |
10,797 |
Angus |
4,057 |
365 |
392 |
4,814 |
Argyll & Bute |
6,900 |
339 |
352 |
7,591 |
Clackmannanshire |
1,256 |
137 |
148 |
1,541 |
Dumfries & Galloway |
7,820 |
496 |
538 |
8,854 |
Dundee City |
4,052 |
619 |
997 |
5,668 |
East Ayrshire |
3,043 |
323 |
399 |
3,765 |
East Dunbartonshire |
1,643 |
302 |
306 |
2,251 |
East Lothian |
2,659 |
264 |
323 |
3,246 |
East Renfrewshire |
1,203 |
209 |
226 |
1,638 |
Edinburgh, City of |
12,401 |
2,436 |
3,943 |
18,780 |
Eilean Siar |
1,921 |
99 |
112 |
2,132 |
Falkirk |
3,549 |
482 |
688 |
4,719 |
Fife |
9,866 |
1,212 |
1,619 |
12,697 |
Glasgow City |
17,190 |
2,928 |
4,817 |
24,935 |
Highland |
14,377 |
956 |
1,345 |
16,678 |
Inverclyde |
1,747 |
222 |
311 |
2,280 |
Midlothian |
2,118 |
249 |
357 |
2,724 |
Moray |
3,814 |
248 |
355 |
4,417 |
North Ayrshire |
3,943 |
389 |
501 |
4,833 |
North Lanarkshire |
6,379 |
1,034 |
1,550 |
8,963 |
Orkney Islands |
1,767 |
116 |
93 |
1,976 |
Perth & Kinross |
6,783 |
576 |
719 |
8,078 |
Renfrewshire |
4,451 |
621 |
958 |
6,030 |
Scottish Borders |
6,099 |
408 |
412 |
6,919 |
Shetland Islands |
1,662 |
97 |
143 |
1,902 |
South Ayrshire |
3,539 |
450 |
552 |
4,541 |
South Lanarkshire |
6,741 |
1,135 |
1,476 |
9,352 |
Stirling |
3,838 |
437 |
563 |
4,838 |
West Dunbartonshire |
2,015 |
273 |
416 |
2,704 |
West Lothian |
3,675 |
595 |
1,108 |
5,378 |
1- Includes properties with zero rateable value.
NDR bills are calculated by multiplying the rateable value of a property by the poundage rate. The Scottish Government sets the rate poundage, which applies to the whole of Scotland. In 2006-07, Scottish Ministers committed to the equalisation of the Scottish poundage rate with that of England, and in 2007-08 this was achieved. The annual NDR Income, total Rateable Value, and Poundage Rate, as well as their changes over time, are shown in table 2.10. Due to the 2010 revaluation, the total Rateable Value of Non-domestic properties (the tax base) increased from £5.3 billion in 2009-10 to £6.6 billion in 2010-11, however, the overall impact on Non-Domestic rate bills will be zero over the 5 year revaluation cycle as the poundage reduction must be taken into account when calculating bills. Additionally, exempt properties (which do not pay rates), along with the impact of appeals and relief schemes such as the Small Business Bonus Scheme, will also significantly reduce the amount paid in bills.
The cumulative Rateable Value for the Valuation Roll at the end of the 2009-10 financial year and NDR Income for 2009-10 and 2010-11 per Local Authority are given in Table 2.11.
Table 2.10 - Non-Domestic Rates Income, Total Rateable Values and Poundage Rates
2005-06 |
2006-07 |
2007-08 |
2008-09 |
2009-10 |
2010-11 |
|
|---|---|---|---|---|---|---|
Non Domestic Rates Income (£m) 1 |
1,933 |
1,933 |
1,921 |
1,933 |
2,015 |
2,164 |
Total Rateable Value (£m) |
5,063 |
5,186 |
5,239 |
5,296 |
5,299 |
6,612 |
Poundage Rate (pence) |
46.1 |
44.9 |
44.1 |
45.8 |
48.1 |
40.7 |
1. Mid-year estimate of income for 2010-11
Table 2.11 - Non-Domestic Rates Properties, Rateable Values and Income By Local Authority 1,2
Authority |
Non-Domestic Properties |
Non-Domestic Rateable Values 3 |
Non-Domestic Rate income |
|
|---|---|---|---|---|
2009-10 |
2010-11 4 |
|||
(£000s) |
(£000s) |
(£000s) |
||
Scotland |
213,311 |
6,612,485 |
2,014,616 |
2,163,520 |
Aberdeen City |
8,270 |
447,608 |
140,067 |
160,062 |
Aberdeenshire |
10,797 |
199,422 |
57,783 |
68,088 |
Angus |
4,814 |
76,634 |
21,669 |
23,192 |
Argyll & Bute |
7,591 |
83,526 |
25,247 |
25,365 |
Clackmannanshire |
1,541 |
37,952 |
10,832 |
12,179 |
Dumfries & Galloway |
8,854 |
109,668 |
35,919 |
38,162 |
Dundee City |
5,668 |
196,483 |
59,922 |
60,796 |
East Ayrshire |
3,765 |
80,838 |
25,160 |
25,104 |
East Dunbartonshire |
2,251 |
63,848 |
19,845 |
20,174 |
East Lothian |
3,246 |
63,805 |
18,000 |
19,155 |
East Renfrewshire |
1,638 |
37,962 |
11,862 |
11,875 |
Edinburgh, City of |
18,780 |
905,787 |
291,893 |
294,923 |
Eilean Siar |
2,132 |
20,434 |
5,432 |
5,932 |
Falkirk |
4,719 |
167,778 |
55,589 |
55,048 |
Fife |
12,697 |
425,498 |
120,602 |
133,862 |
Glasgow City |
24,935 |
976,977 |
303,582 |
300,579 |
Highland |
16,678 |
286,273 |
82,810 |
94,565 |
Inverclyde |
2,280 |
56,831 |
18,497 |
18,542 |
Midlothian |
2,724 |
73,308 |
21,138 |
23,057 |
Moray |
4,417 |
82,994 |
24,692 |
26,824 |
North Ayrshire |
4,833 |
105,518 |
30,604 |
32,802 |
North Lanarkshire |
8,963 |
291,886 |
97,989 |
95,939 |
Orkney Islands |
1,976 |
24,166 |
6,757 |
7,656 |
Perth & Kinross |
8,078 |
144,196 |
44,559 |
44,901 |
Renfrewshire |
6,030 |
243,497 |
74,155 |
84,515 |
Scottish Borders |
6,919 |
85,098 |
22,593 |
23,745 |
Shetland Islands |
1,902 |
43,066 |
12,206 |
14,187 |
South Ayrshire |
4,541 |
107,661 |
33,639 |
34,540 |
South Lanarkshire |
9,352 |
681,990 |
176,793 |
241,911 |
Stirling |
4,838 |
113,142 |
36,379 |
31,621 |
West Dunbartonshire |
2,704 |
171,009 |
59,646 |
65,419 |
West Lothian |
5,378 |
207,632 |
68,758 |
68,798 |
1. The most recent business rates revaluation came into effect on 1st April 2010
2. A number of individual councils collect certain rates bills on hehalf of all 32 councils. For example, Fife collects rates for Scottish Water, South Lanarkshire for Electricity Companies and Renfrewshire for Telecoms.
3. Includes those with a zero rateable value.
4. Mid-year estimate.
The figures presented in Table 2.11 are shown net of reliefs. Relief 4 arrangements apply to properties including, but not exhaustively, qualifying village stores, post offices, petrol stations and public houses/hotels, stud farms, empty properties, properties owned by charities and premises used for religious worship. From 1 April 2008, the Small Business Rates Relief Scheme ( SBRRS) was replaced by the Small Business Bonus Scheme ( SBBS), both of which targeted properties with rateable values on the lower end of the spectrum. The cost of the SBBS scheme is much greater than that of the former SBRRS, resulting in a larger than usual increase in the gross amount of reliefs awarded from 2007-08 to 2008-09. In 2009-10 the mandatory element of reliefs for Sports Clubs were collected separately from the discretionary element for the first time. Table 2.12 shows the amounts of the main reliefs received from 2005-06 to 2009-10.
Table 2.12 - Non-Domestic Rates Reliefs By Relief Type
£ thousands
2005-06 |
2006-07 |
2007-08 |
2008-09 |
2009-10 1 |
||
|---|---|---|---|---|---|---|
Mandatory |
Unoccupied Property/Partly Unoccupied Property |
131,112 |
130,155 |
119,957 |
127,385 |
153,361 |
Charities |
90,998 |
93,423 |
97,361 |
102,475 |
110,264 |
|
Sports Clubs 2 |
.. |
.. |
.. |
.. |
2,279 |
|
Disabled persons relief |
40,668 |
40,079 |
40,040 |
42,914 |
45,484 |
|
SBRRS/ SBBS3 |
24,052 |
24,321 |
24,686 |
72,553 |
108,435 |
|
Religious Properties |
18,668 |
18,439 |
18,146 |
18,986 |
20,218 |
|
Rural Rate Relief |
945 |
927 |
924 |
936 |
960 |
|
Former Agricultural Premises 4 |
10 |
12 |
14 |
. |
. |
|
Discretionary |
Charities & other organisations |
9,095 |
9,428 |
10,405 |
10,943 |
12,007 |
Sports Clubs |
9,473 |
9,309 |
9,173 |
9,651 |
9,325 |
|
Rural Rate relief |
2,952 |
2,964 |
2,977 |
2,952 |
2,958 |
|
Backdated relief for Sports Clubs & Charities |
26 |
181 |
38 |
101 |
45 |
|
Hardship |
192 |
3 |
20 |
27 |
19 |
|
Former Agricultural Premises 4 |
3 |
4 |
5 |
. |
. |
|
Stud Farms |
- |
- |
- |
- |
- |
|
Gross Amount |
328,196 |
329,244 |
323,746 |
388,921 |
465,356 |
|
1. Provisional notified General Revenue Funding ( GRF) is guaranteed this means that any reduction in the amount of NDR collected is compensated for by a corresponding increase in GRF and vice versa.
The calculation of the distributable amount for 2009-10 is given in Annex D. The 2009-10 distributable amount per Local Authority is shown in table 2.13.
Table 2.13 - Non-Domestic Rates Distributable Amount By Local Authority, 2009-10
£ Thousands
Non-Domestic Rate Income |
|
|---|---|
Scotland |
2,165,100 |
Aberdeen City |
88,074 |
Aberdeenshire |
100,659 |
Angus |
46,242 |
Argyll & Bute |
38,448 |
Clackmannanshire |
21,002 |
Dumfries & Galloway |
62,417 |
Dundee City |
59,828 |
East Ayrshire |
50,325 |
East Dunbartonshire |
44,129 |
East Lothian |
39,748 |
East Renfrewshire |
37,568 |
Edinburgh, City of |
197,002 |
Eilean Siar |
11,069 |
Falkirk |
63,435 |
Fife |
151,728 |
Glasgow City |
244,927 |
Highland |
91,517 |
Inverclyde |
34,125 |
Midlothian |
33,464 |
Moray |
36,562 |
North Ayrshire |
57,139 |
North Lanarkshire |
136,652 |
Orkney |
8,359 |
Perth & Kinross |
59,824 |
Renfrewshire |
71,382 |
Scottish Borders |
46,899 |
Shetland |
9,238 |
South Ayrshire |
47,008 |
South Lanarkshire |
130,263 |
Stirling |
37,118 |
West Dunbartonshire |
38,338 |
West Lothian |
70,611 |
estimate of relief expenditure for 2009-10
2. The mandatory element of Sports Club relief was not collected separately prior to 2009-10
3. From 1 April 2008, the Small Business Rates Relief Scheme was replaced with the Small Business Bonus Scheme.
4. Relief for Former Agricultural Premises was a time limited relief which ended at 31 March 2008
NDR income is collected by Local Authorities and pooled at the Scotland level. Each council, having collected its taxes, reports the Non-Domestic Rates collected to the Scottish Government to be included in the central pool. The amount to be re-distributed from the pool is known as the Distributable Amount ( DA) and is set by the Scottish Government before the start of the financial year in question and redistributed to individual local authorities on the basis of population shares. It is based upon a forecast of the NDR income and prior year adjustments, and is therefore not guaranteed to match the total contributions to the pool for that year.
The DA forms part of the Total Revenue Funding ( TRF), which represents the Government's revenue funding for core local government services. As the combined total of NDR income and
Source: Finance Circular 6/2009, available at: http://www.scotland.gov.uk/Topics/Government/local-government/17999/11203
2.4 Sales, Rents, Fees and Charges
Local Authorities receive income from sales, rents, fees and charges as a result of providing services. These services are wide ranging in nature, as is the amount of income associated with each service, as detailed in Table 2.14 below.
Table 2.14 - Sales, Rents, Fees and Charges
£ thousand
2005-06 |
2006-07 |
2007-08 |
2008-09 |
2009-10 |
|
|---|---|---|---|---|---|
Education |
87,716 |
84,863 |
93,253 |
85,691 |
87,115 |
Cultural & Related Services |
77,415 |
76,337 |
81,421 |
78,621 |
85,516 |
Social Work |
214,605 |
232,588 |
256,018 |
259,061 |
246,014 |
Police, Fire & Emergency Planning |
59,933 |
49,878 |
55,564 |
88,557 |
93,043 |
Roads & Transport |
112,201 |
143,723 |
145,226 |
146,605 |
165,941 |
Environmental Services |
91,282 |
98,951 |
117,585 |
117,873 |
123,164 |
Planning & Economic Development |
136,196 |
144,215 |
141,791 |
112,644 |
120,146 |
Non- HRA Housing |
97,889 |
123,072 |
124,893 |
232,028 |
189,150 |
Central Services |
98,098 |
101,932 |
130,075 |
141,455 |
144,819 |
Trading Services |
55,928 |
55,488 |
56,544 |
70,810 |
66,992 |
Total GF Sales, Rents, Fees and Charges |
1,031,263 |
1,111,047 |
1,202,370 |
1,333,345 |
1,321,900 |
HRA |
904,509 |
911,946 |
909,126 |
920,146 |
955,710 |
Common Good Fund |
7,719 |
7,892 |
7,342 |
8,324 |
9,073 |
Road Bridges |
15,543 |
16,224 |
13,618 |
162 |
133 |
Total Sales, Rents, Fees and Charges |
1,959,034 |
2,047,109 |
2,132,456 |
2,261,977 |
2,286,816 |
2.5 Other Revenue Income
Other revenue income consists of all other grants, reimbursements and contributions, some income from interest on revenue balances, and increases in revenue balances. All other grants, reimbursements and contributions consists of revenue income received to finance a project/function jointly undertaken with other non-government bodies and the value of the costs recharged to outside bodies (including other committees). Table 2.15 below details other income by fund or reserve.
Table 2.15 - Other Income, 2009-10
£ thousands
2009-10 |
|
|---|---|
Other Grants, reimbursements and contributions |
638,270 |
General Fund |
618,877 |
Housing Revenue Account |
5,942 |
Common Good |
396 |
Road Bridges |
13,055 |
Interest and Investment Income |
35,619 |
General Fund |
30,358 |
Housing Revenue Account |
1,878 |
Common Good |
3,296 |
Road Bridges |
87 |
Increases in Revenue Balances |
2,332 |
Total |
676,221 |
2.6 Capital Grants
Capital grants consist of Scottish Government capital grants and other capital grants and contributions. From the 2008-09 financial year, Scottish Government capital grants have been broken down into three components, the Scottish Government General Capital Grant, Scottish Government Specific Capital Grants and Grants from Scottish Government Agencies and Non-departmental Public Bodies ( NDPBs). Other grants and contributions include grants from other local authorities, European Structural Funds, contributions from private developers or persons, and grants from the National Lottery. Table 2.16 details capital grants by source, and type of local authority.
Table 2.16 - Capital Grants income 2009-10 1,2
£ thousands
Scotland |
Unitary Authorities |
Police Boards |
Fire Boards |
Regional Transport Partnerships |
Bridge Authorities |
|
|---|---|---|---|---|---|---|
Scottish Government General Capital Grant |
448,496 |
446,252 |
2,244 |
- |
- |
- |
Scottish Government Specific Capital Grants |
155,704 |
103,086 |
3,277 |
22,675 |
26,666 |
- |
Grants from Scottish Government Agencies and NDPBs |
156,098 |
145,828 |
379 |
- |
- |
9,891 |
Grants from other Local Authorities/Joint Boards |
24,615 |
4,392 |
19,768 |
- |
455 |
- |
European Union Structural Funds |
1,088 |
1,088 |
- |
- |
- |
- |
Contributions from private developers or persons |
28,881 |
28,859 |
- |
22 |
- |
- |
Grants from the National Lottery |
12,964 |
12,964 |
- |
- |
- |
- |
Other grants/ contributions |
47,560 |
46,490 |
418 |
652 |
- |
- |
Total Grants |
875,406 |
788,959 |
26,086 |
23,349 |
27,121 |
9,891 |
1. These figures are those reported by local authorities in their 2009-10 Final Capital Return. The figures in this table may not therefore necessarily agree with the breakdown of capital grants detailed in Finance Circular 9/2010.
2. Figures include Housing Revenue Account
2.7 Capital Receipts
Capital receipts are capital income, normally generated by the sale or disposal of an asset. They may only be applied to capital expenditure or for the write down of capital debt.
Table 2.17 details capital receipts raised by service type from 2005-06 to 2009-10. As can be seen in the table, within General Fund services, the service area with the greatest amounts of capital receipts has consistently been Other Services. This trend is reflective of advice given to local authorities to manage surplus assets centrally, rather than in their original service portfolios, so that any sales of these surplus assets can be managed most effectively. A detailed breakdown of Capital Receipts by Service for 2009-10 can be found in Annex E.
Table 2.17 - Service Breakdown of Capital Receipts Raised
£ thousands
2005-06 |
2006-07 |
2007-08 |
2008-09 |
2009-10 |
|
|---|---|---|---|---|---|
Education |
16,637 |
12,348 |
62,563 |
30,489 |
4,089 |
Culture & Related Services |
6,536 |
3,260 |
12,697 |
2,594 |
2,243 |
Social Work |
600 |
1,964 |
3,473 |
715 |
285 |
Police & Fire |
4,877 |
4,644 |
4,112 |
4,908 |
3,709 |
Roads & Transport |
8,357 |
5,407 |
5,849 |
1,928 |
742 |
Environmental Services |
190 |
565 |
644 |
793 |
1,113 |
Planning & Economic Development |
10,000 |
18,661 |
26,421 |
9,120 |
8,996 |
Trading Services |
22 |
60 |
243 |
6 |
133 |
Other Services |
85,143 |
178,906 |
168,348 |
43,557 |
142,394 |
Non- HRA Housing |
274 |
262 |
454 |
211 |
602 |
Total General Fund Services |
132,636 |
226,077 |
284,804 |
94,321 |
164,306 |
Housing Revenue Account |
233,666 |
225,276 |
229,109 |
135,484 |
65,091 |
Total Services |
366,302 |
451,353 |
513,913 |
229,805 |
229,397 |