Planning - the value, incidence and impact of developer contributions: research
Independent research on section 75 planning obligations and other developer contributions mechanisms. The report brings together quantitative and qualitative evidence to inform our wider review.
8. Annex 1: Background information about the Scottish Housing Market
Figure 4 shows the distribution of median earnings across the country. It suggests that areas with the highest pay have earnings almost 50% higher than in the lowest earnings area. It also shows that areas close to the English border are relatively poorly paid while those in the Islands are relatively well paid.
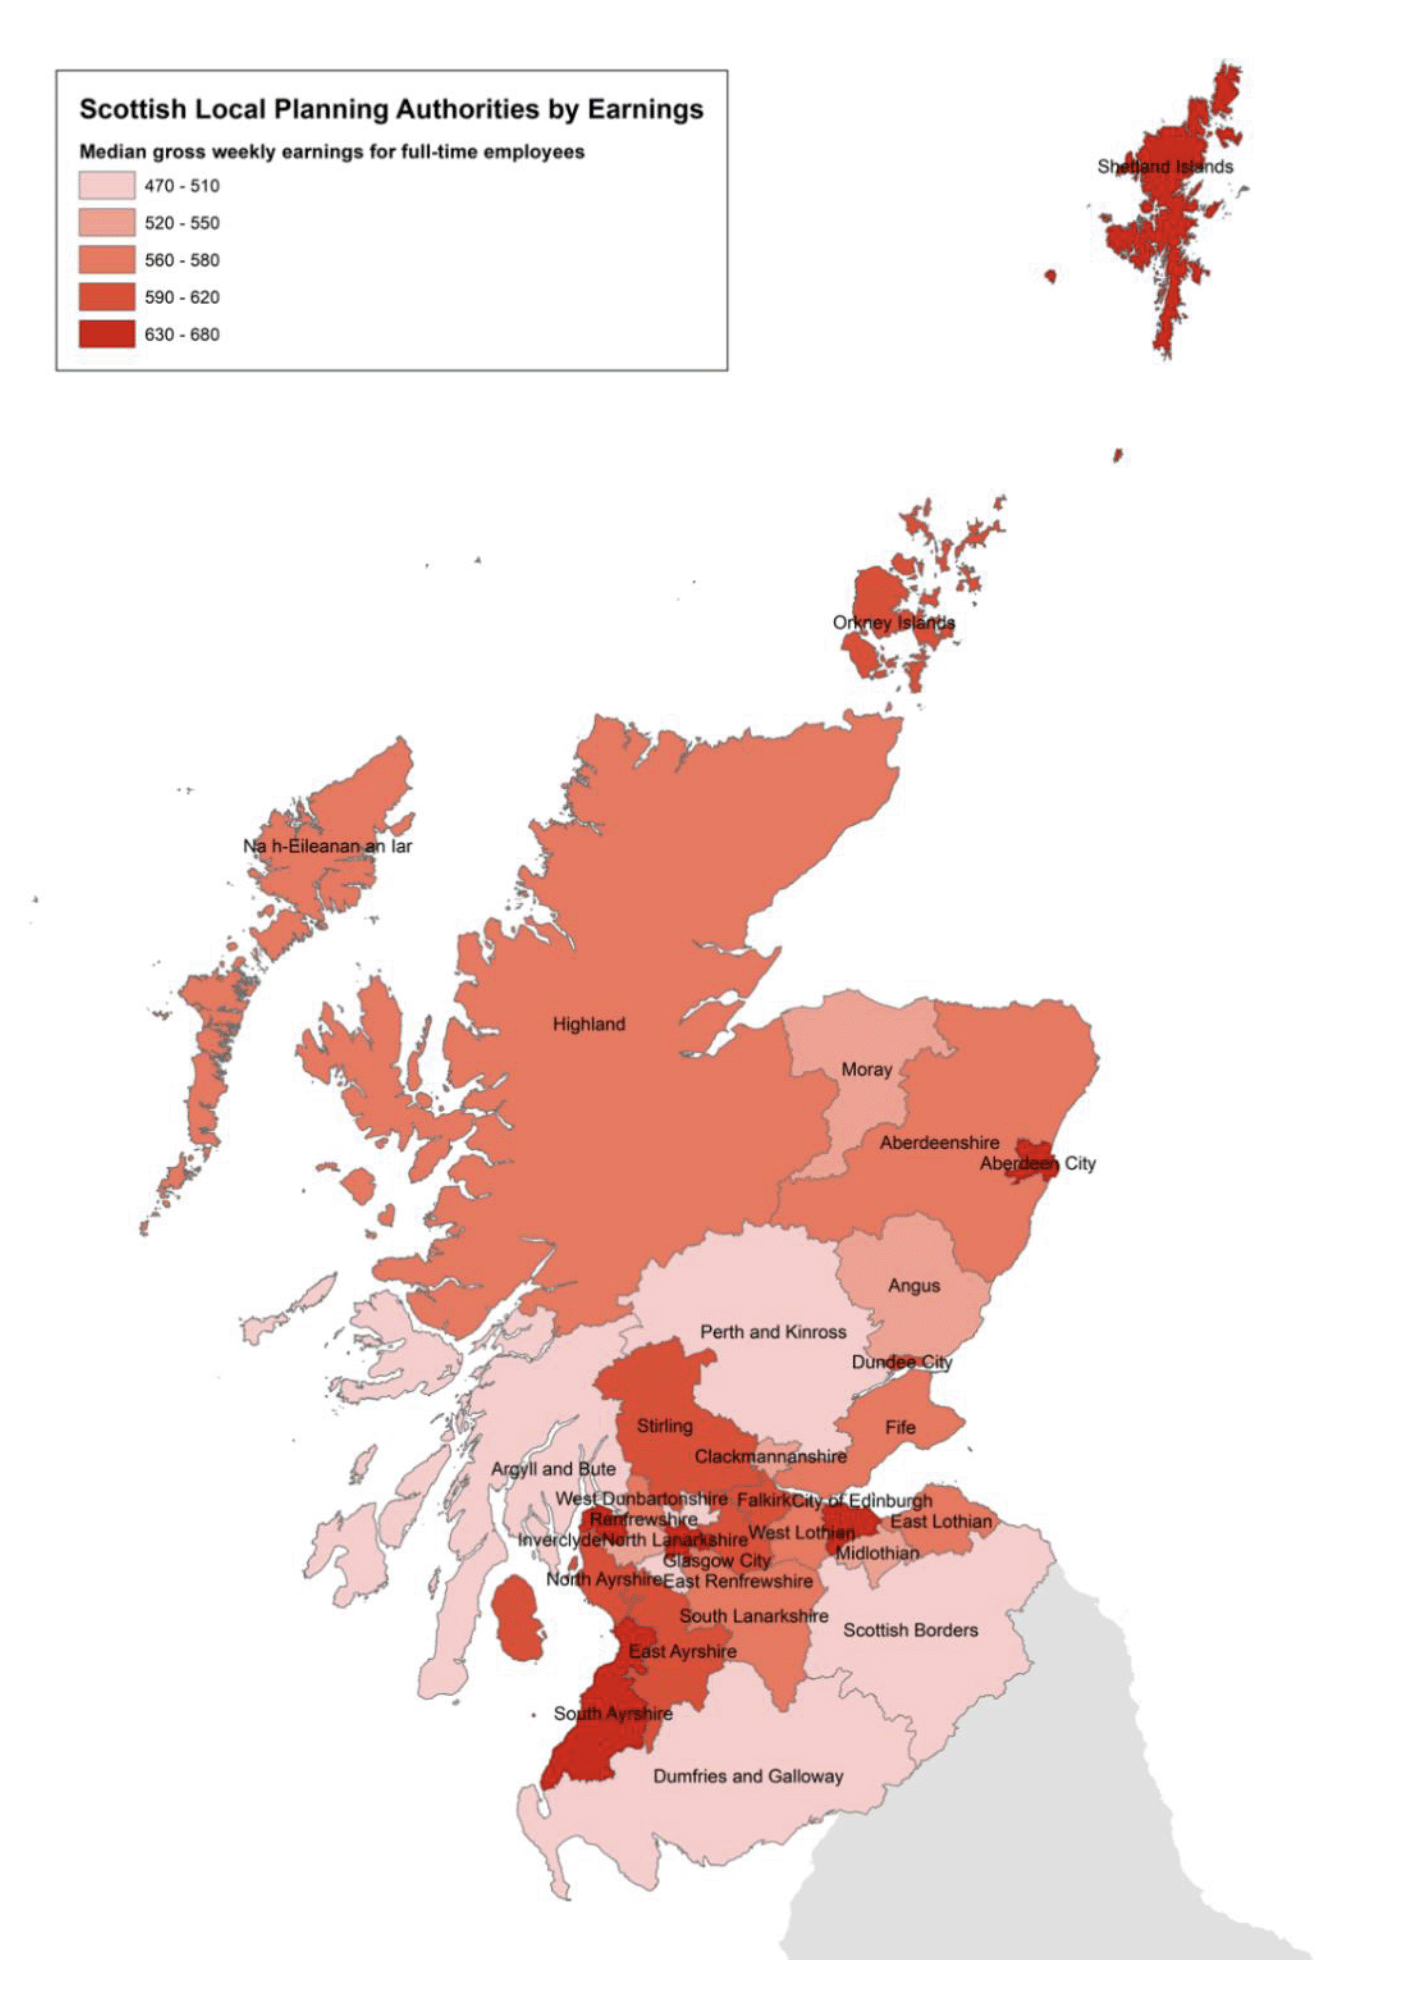
Figure 5 shows how the housing stock has risen since the turn of the century and the extent to which it has kept pace with the growth in the number of households. The number of dwelling units was 5.6% more than the number of households in 2001 exactly comparable to 2001. However, in 2010 the gap had narrowed to 5.3% - so over the last nine years the numbers of dwelling have risen faster than the number of households.
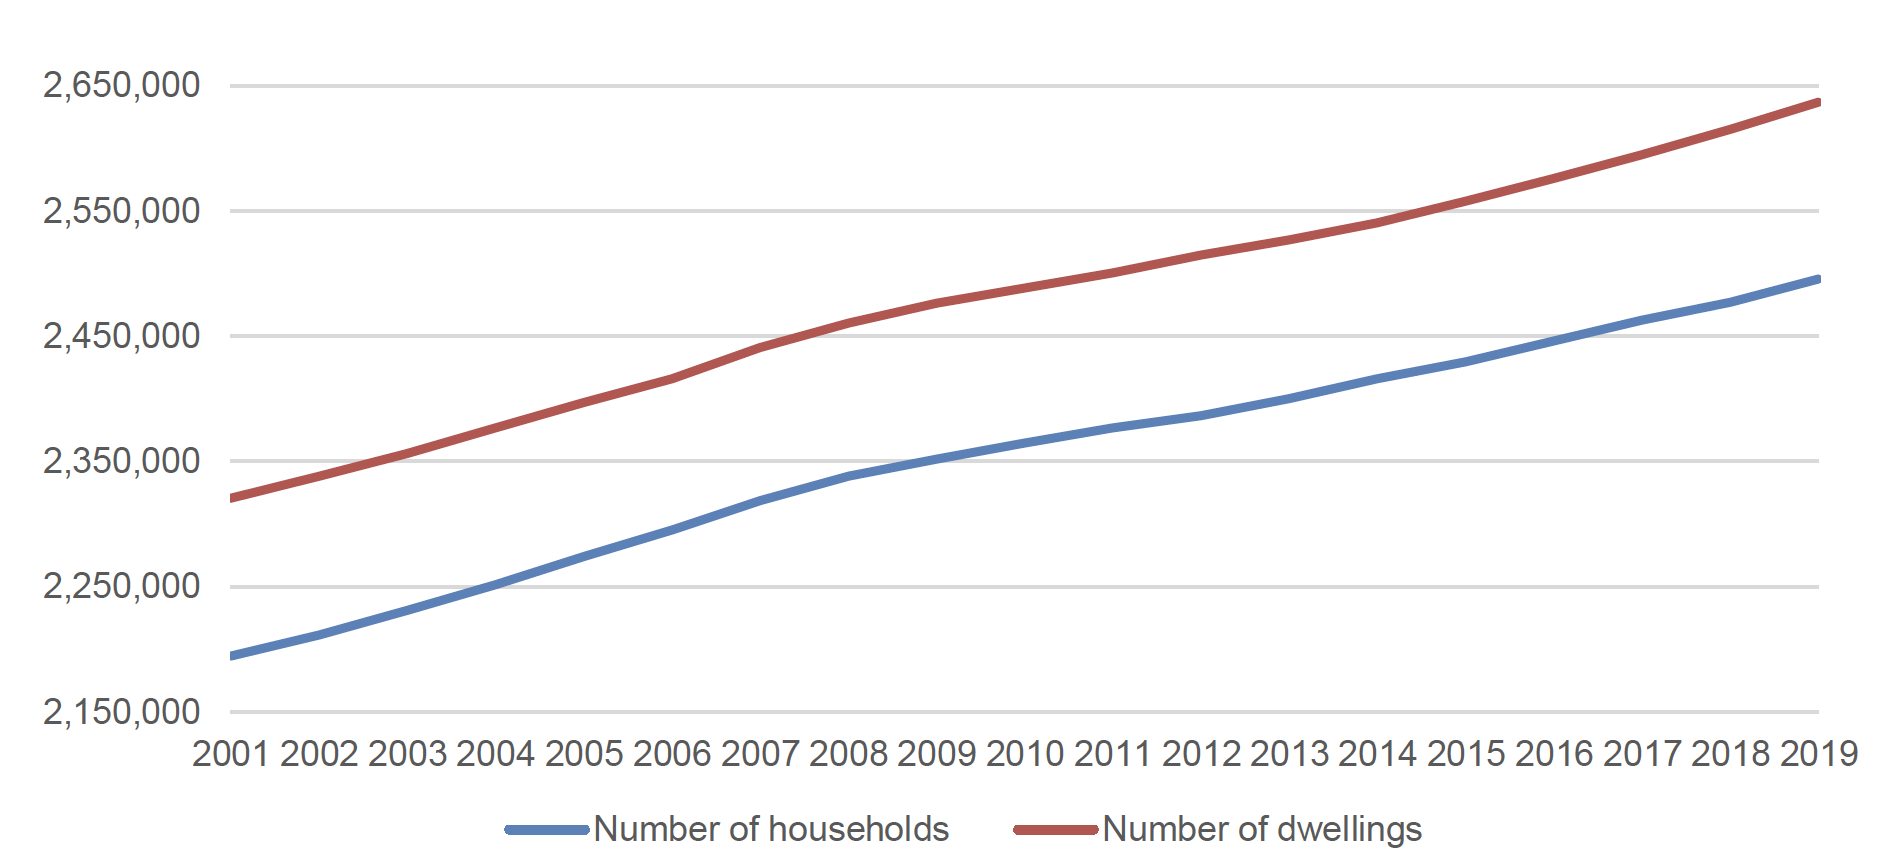
Source: Estimates of Households and Dwellings 2019, National Records of Scotland
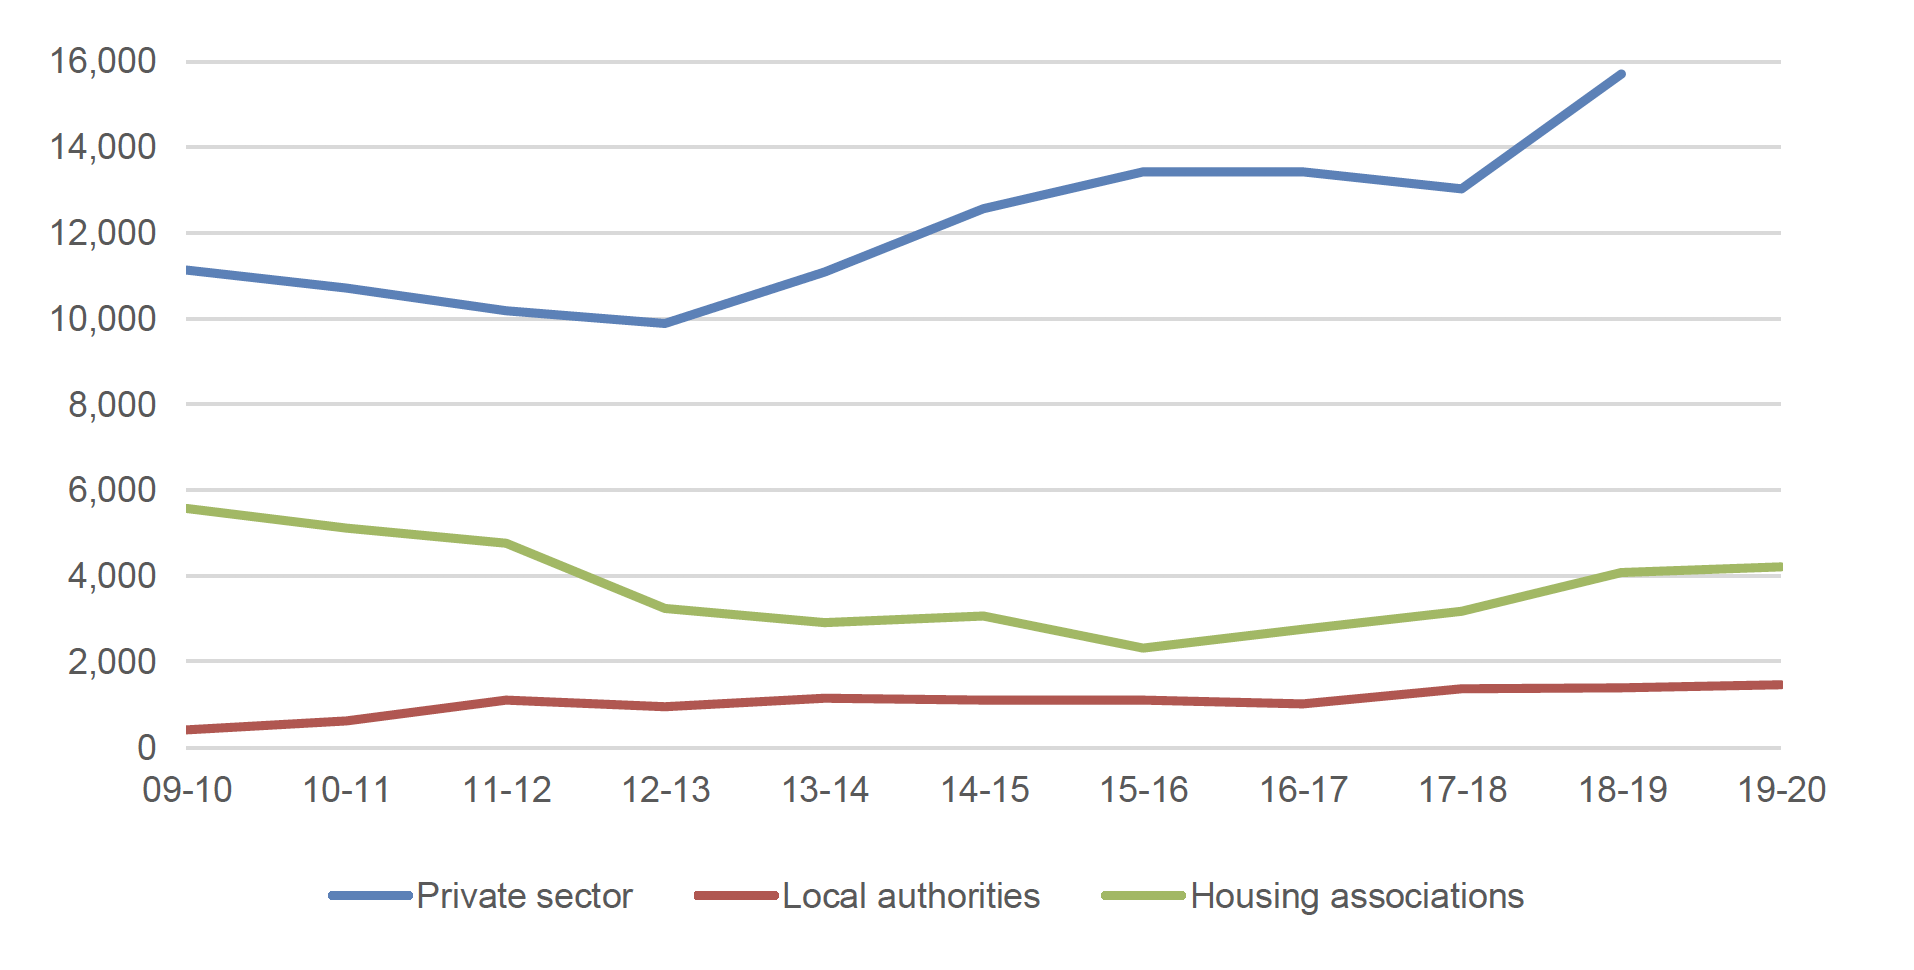
Figure 6 shows housing completions by tenure – with private sector dwellings accounting for around three quarters of output in 2017/8 - a considerably higher proportion than in 2010. Housing association output fell significantly from 2010 reaching a low point of just over 2,000 in 2015/6. This rose closer to 20% in 2017/8 with local authorities providing around 7%.
Figure 7 shows how average house prices have risen over the last decade by around 20% - with two periods of stagnation/decline.
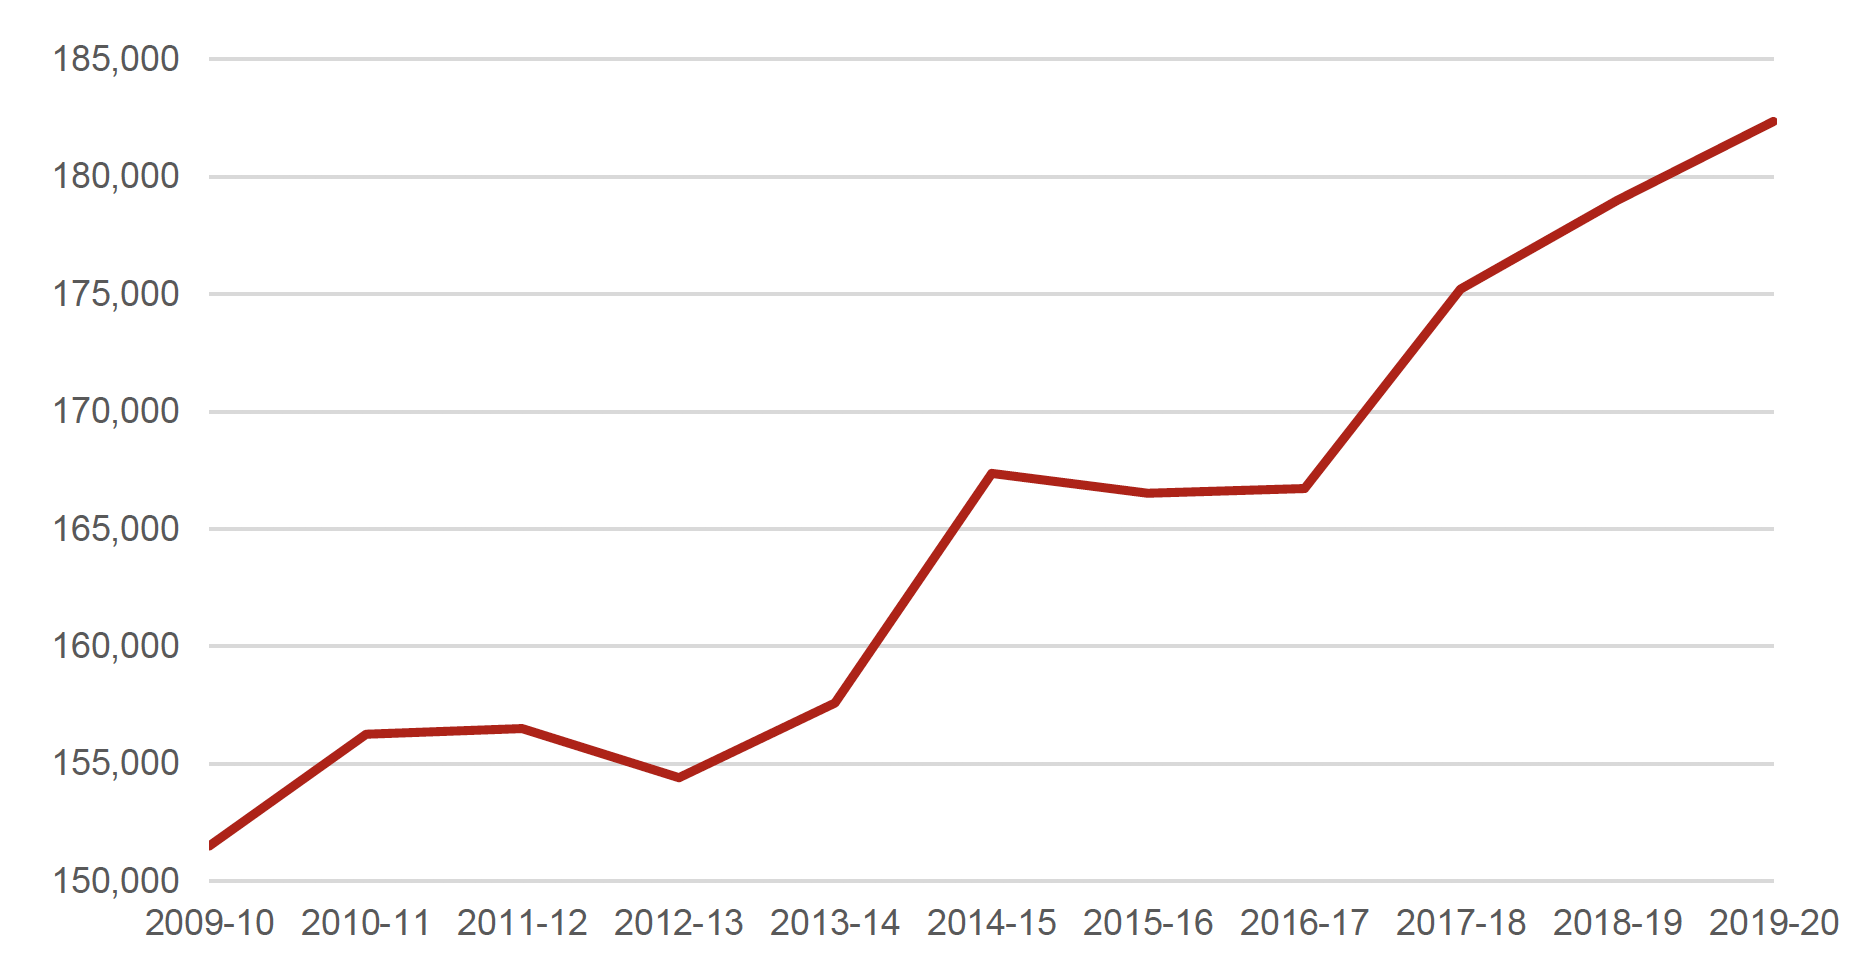
Source: Registers of Scotland
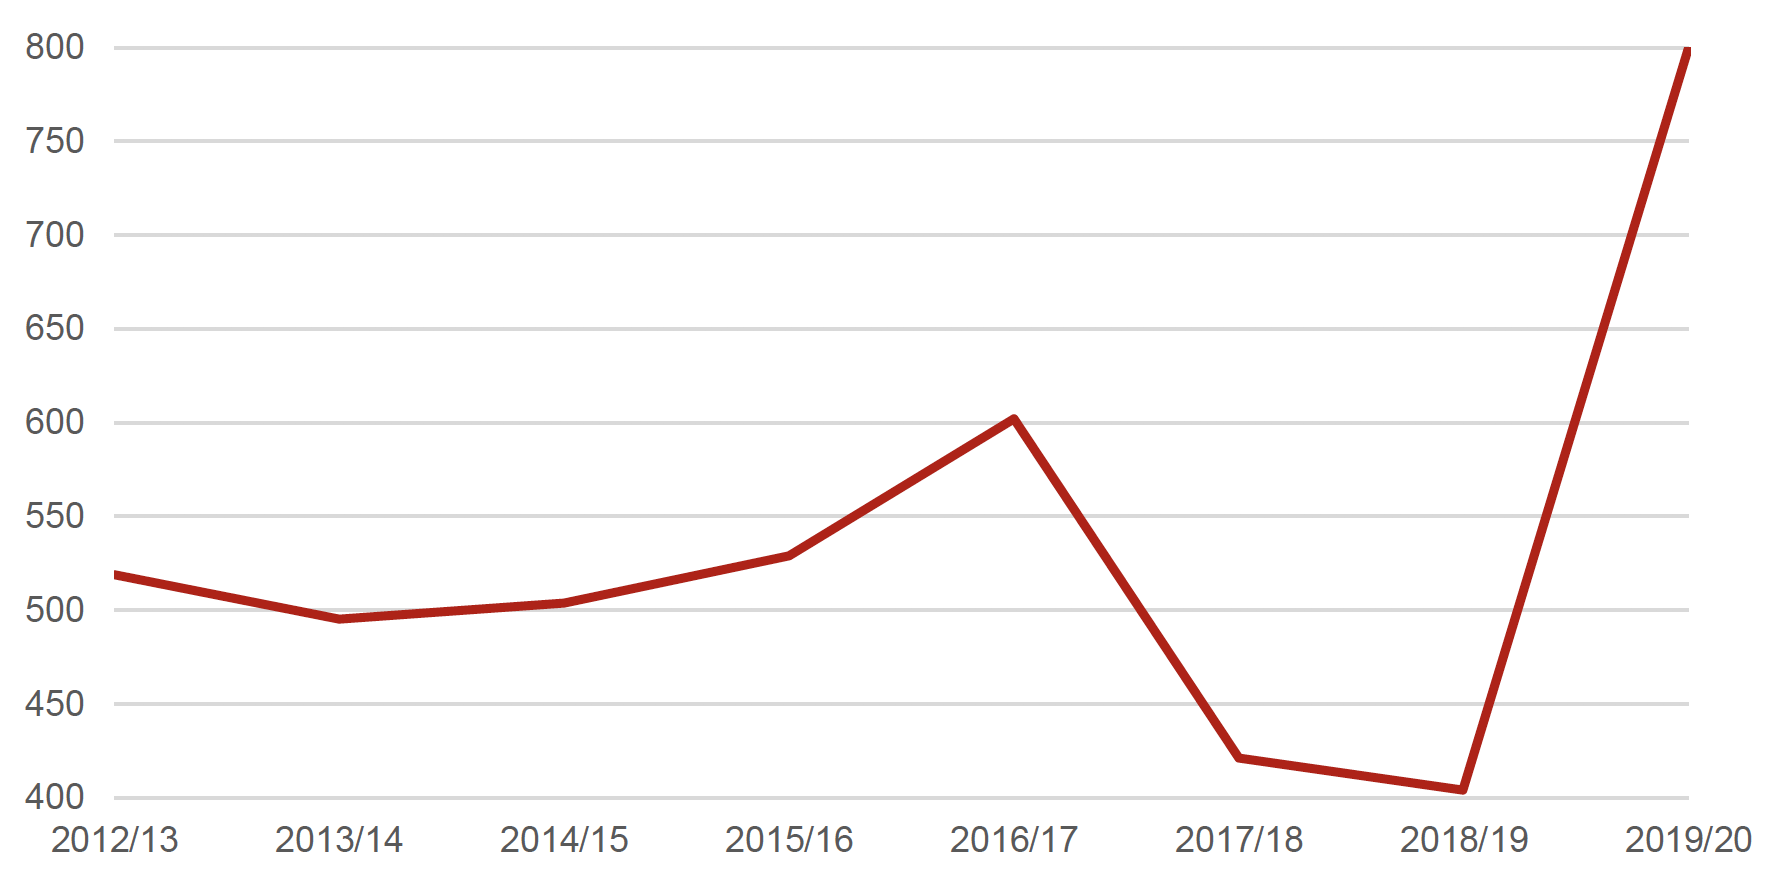
Source: 2019/20 Annual Planning Performance Statistics, Scotland tables, Table 29
Contact
Email: Chief.Planner@gov.scot