UK ETS Free Allocation Review – Final Business and Regulatory Impact Assessment
This Business and Regulatory Impact Assessment (BRIA) covers the potential impacts on Scottish businesses following proposed changes to the UK Emissions Trading Scheme (ETS) Free Allocation policy.
Section 3: Costs, impacts and benefits
Quantified costs to businesses
In line with UK ETS Authority Impact Assessment analysis[13], six different options were explored to assess the possible quantified costs to businesses. These are detailed in table 3A below, with package F highlighted as the preferred policy option.
The key differences between options are:
- The timing of the use of EU benchmarks.
- The timing of the phase out of free allocations (FAs) for UK ETS installations not on the carbon leakage list.
- Whether conditionality is considered, where conditionality refers to making the receipt of free carbon allowances dependent on an operator’s efforts to decarbonise.
- Timing and how quickly free allocations are phased out for sectors affected by the introduction of the UK CBAM)[14].
Table 3A: Shortlist of Policy Options
Package A
Changes to Activity Level Changes (ALCs): COVID mitigation for calculating HAL
Changes to benchmarks: Updated EU benchmarks[15]
Changes to Carbon Leakage List (CLL) and Carbon Leakage Exposure Factor (CLEF): Current CLL, early non-CL phase-out from ‘27
Consideration of access to decarbonisation technologies: No consideration
Consideration of conditionality: 20% reduction to those within EU 80th percentile
Introducing phase-out / down of FAs for CBAM sectors: Steep phase-out
Package B
Changes to Activity Level Changes (ALCs): COVID mitigation for calculating HAL
Changes to benchmarks: Updated EU benchmarks
Changes to Carbon Leakage List (CLL) and Carbon Leakage Exposure Factor (CLEF): Current CLL, no early non-CL phase-out from ‘27
Consideration of access to decarbonisation technologies: No consideration
Consideration of conditionality: No conditionality
Introducing phase-out / down of FAs for CBAM sectors: Delayed phase-out
Package C
Changes to Activity Level Changes (ALCs): COVID mitigation for calculating HAL
Changes to benchmarks: Updated EU benchmarks
Changes to Carbon Leakage List (CLL) and Carbon Leakage Exposure Factor (CLEF): Current CLL, no early non-CL phase-out from ‘27
Consideration of access to decarbonisation technologies: No consideration
Consideration of conditionality: 20% reduction to those within EU 80th percentile
Introducing phase-out / down of FAs for CBAM sectors: EU aligned phase-out, 1-year delay
Package D
Changes to Activity Level Changes (ALCs): COVID mitigation for calculating HAL
Changes to benchmarks: Updated EU benchmarks
Changes to Carbon Leakage List (CLL) and Carbon Leakage Exposure Factor (CLEF): Current CLL, early non-CL phase-out from ‘27
Consideration of access to decarbonisation technologies: No consideration
Consideration of conditionality: No conditionality
Introducing phase-out / down of FAs for CBAM sectors: EU aligned phase-out, 1-year delay
Package E
Changes to Activity Level Changes (ALCs): COVID mitigation for calculating HAL
Changes to benchmarks: Updated EU benchmarks
Changes to Carbon Leakage List (CLL) and Carbon Leakage Exposure Factor (CLEF): Current CLL, no early non-CL phase-out from ‘27
Consideration of access to decarbonisation technologies: No consideration
Consideration of conditionality: No conditionality
Introducing phase-out / down of FAs for CBAM sectors: EU aligned phase-out, 1-year delay
Package F
Changes to Activity Level Changes (ALCs): COVID mitigation for calculating HAL
Changes to benchmarks: Updated EU benchmarks from 2028[16]
Changes to Carbon Leakage List (CLL) and Carbon Leakage Exposure Factor (CLEF): Current CLL, no early non-CL phase-out from ‘27
Consideration of access to decarbonisation technologies: No consideration
Consideration of conditionality: No conditionality
Introducing phase-out / down of FAs for CBAM sectors: EU aligned phase-out, 1-year delay
As outlined in the UK ETS Authority’s Impact Assessment, each package was identified to align with a particular theme with a clear rationale for each:
- Package A: Most ambitious option with free allocations quickly phased out for sectors not at risk of carbon leakage due to not being on the carbon leakage list or being protected through the introduction of the UK CBAM.
- Package B: Least ambitious option which takes a cautious approach to reducing free allowances, with the attempt to provide as much protection from carbon leakage regardless the size of the risk.
- Package C: Move towards closer alignment with EU ETS free allocation policy with due regards to UK-EU linking negotiations[17].
- Package D: Similar to package C but without the introduction of conditionality, and with the early phase-out of free allocations for sectors not at risk of carbon leakage.
- Package E: Middle option between C and D, with no introduction of conditionality and no early phase-out of free allocations for sectors not at risk of carbon leakage.
- Package F: Nearly identical to package E apart from the use of EU benchmarks from 2028, with current benchmarks retained for 2027. This reflects the unavailability of published EU benchmarks at the time of decision making.
In preparation for the UK ETS Authority’s Impact Assessment, free allocation modelling was carried out for each package as set out in table 3A[18]. Based on this analysis, graph 3A illustrates projections of free allocations for Scottish ETS installations under each package from the modelling.
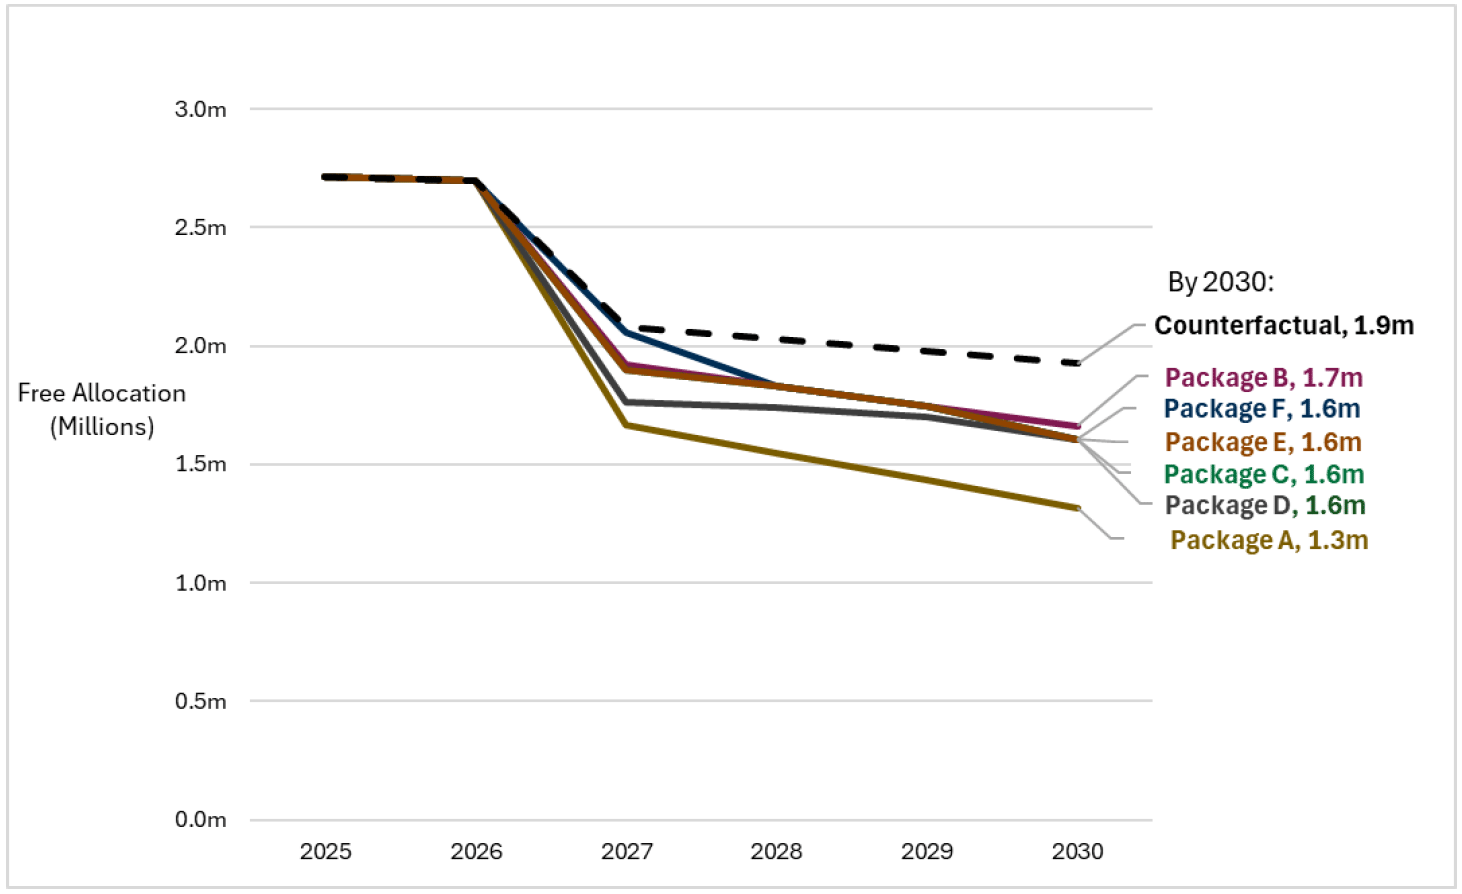
Given the high level of ambition, package A represents an option with the most significant projected reduction in free allocations at around 1.3 million in 2030, with around 0.6 million lower free allocations than in the counterfactual of ‘do-nothing’. Conversely, package B represents a much more cautious option with only around 0.2 million lower free allocations when compared to the counterfactual. Packages B, C, D, E & F all sit in between the aforementioned packages, with projections of free allocations following slightly different pathways throughout the remainder of the 2020s. The preferred package F projects around 1.6 million free allocations in 2030, sitting closer to package B than package A. This provides a balance between implementing changes to reflect the introduction of the UK CBAM and potential future EU linking, while also trying to ensure a gradual phase out to support industrial decarbonisation.
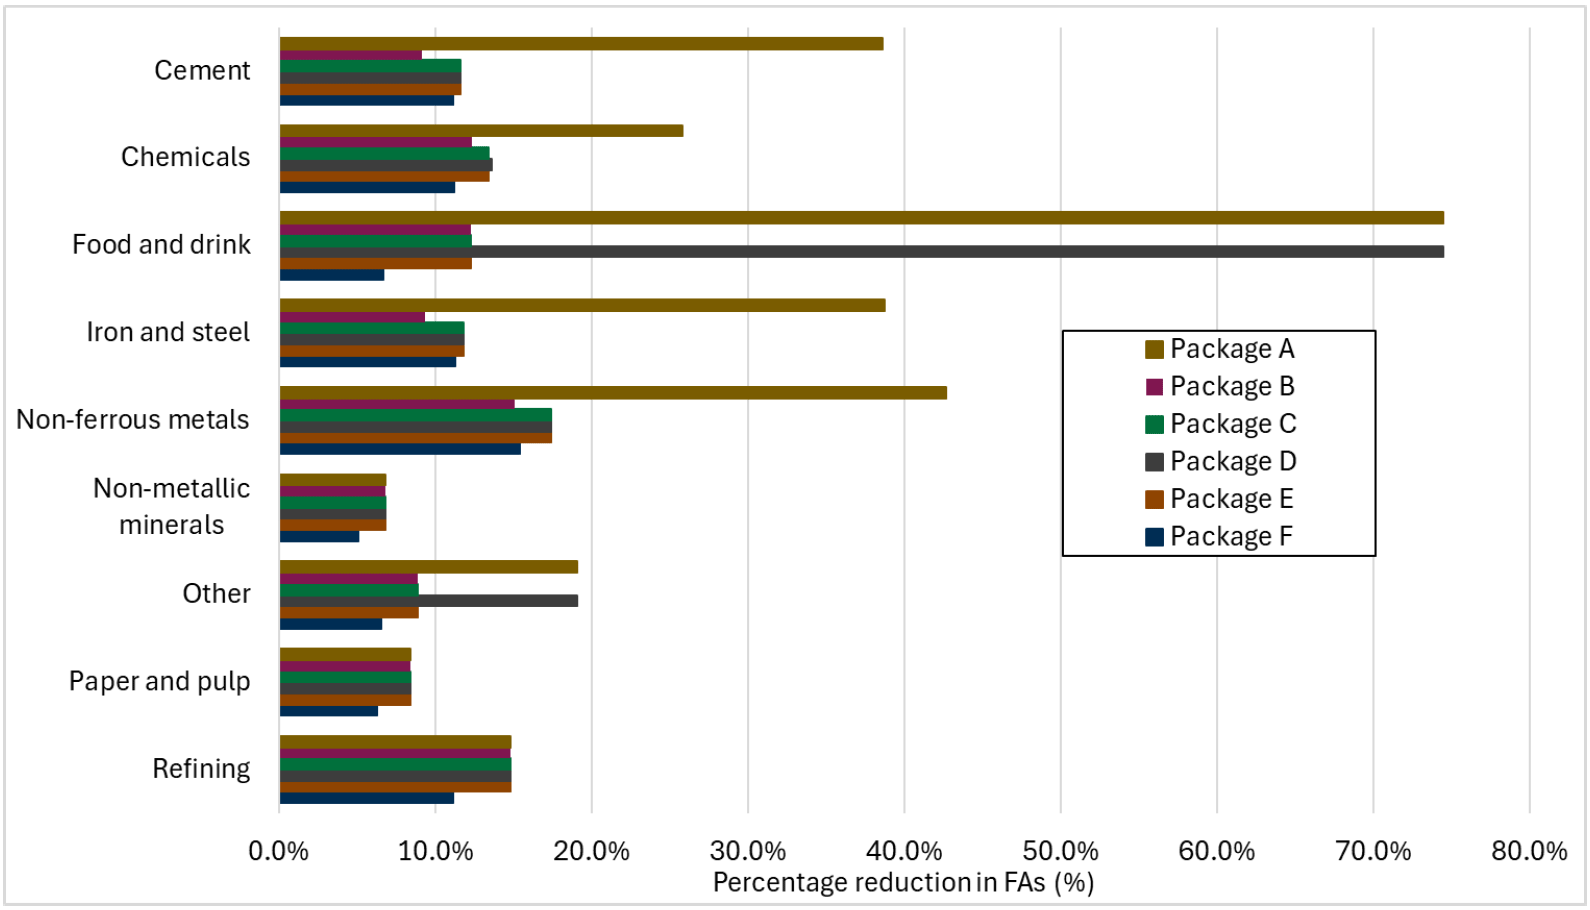
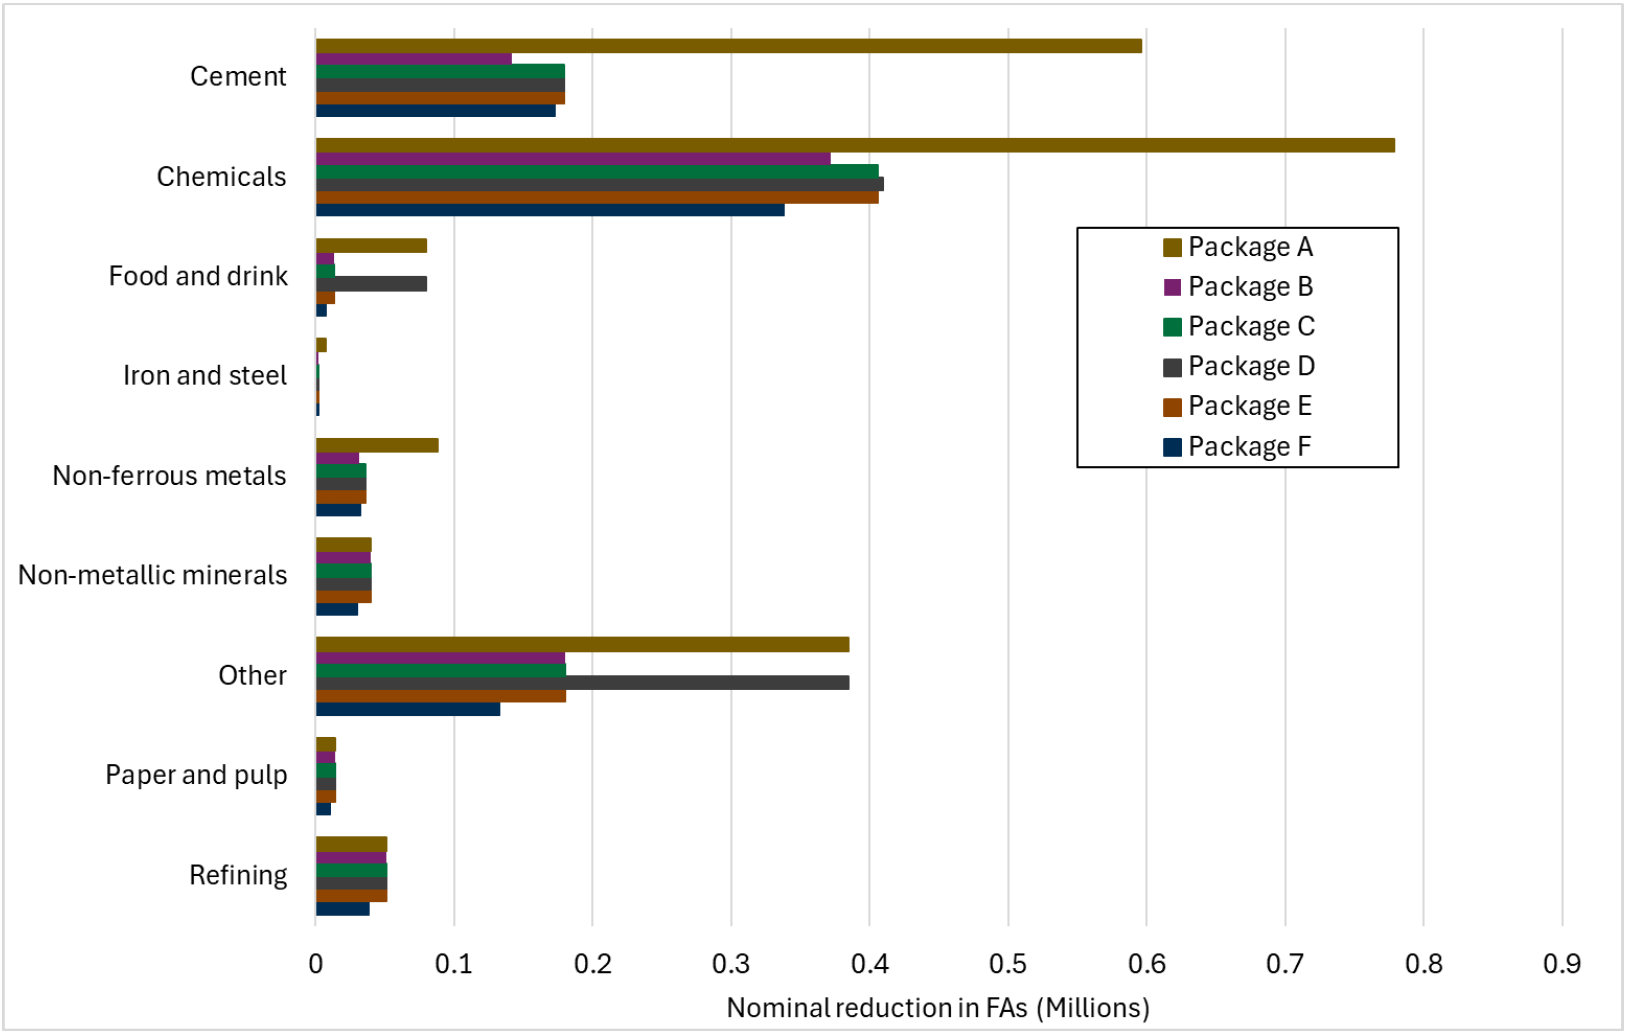
While graph 3A illustrates the total number of free allocations estimated under each package option, the impacts across sectors will be heterogeneous and dependent on whether the policy changes are significant for that sector. Graphs 3B and 3C below illustrate the estimated percentage and nominal impacts of each package across ETS sectors in Scotland for the second allocation period 2027-2030.
Comparison of Policy Package Impacts
When comparing across policy packages A-E, the reductions in free allocations are most similar for refining, paper and pulp and non-metallic minerals, with policy impacts largely being driven by identical changes in benchmarks and Activity Level Changes (ALCs). The exception to this is package F which sees lower projected reductions in free allocations due to the delay in the adoption of EU benchmarks.
Non-ferrous metals, iron & steel and cement all see larger reductions in free allocations under package A compared to other packages, due to the steep phase-out of free allocations for CBAM sectors. Likewise, these same sectors all see lower reductions in free allocations under package B due to a delayed phase-out of free allocations for CBAM sectors.
Food and drink see a stark reduction in free allocations under package A and D, driven by early phase out of free allocations for sectors not on the carbon leakage list.
For chemicals, option A sees a significant reduction in free allocations due to the phase-out of free allocations for CBAM sectors. While the broader chemicals sector is not currently on the list of UK CBAM sectors at the time of writing, the modelling of the chemicals sector included sub-installations who produce hydrogen which is included.
Preferred Policy Package F
In percentage terms, non-ferrous metals see the largest reduction at 15% lower free allocations under package F compared to the counterfactual. This compares to around 43% lower free allocations under the most ambitious policy package A.
Iron and steel, cement, refining and chemicals all see modest percentage reductions with around 11% lower free allocations compared to the counterfactual. This is considerably lower than package A which sees a nearly 40% reduction in free allocations for iron and steel, cement, and chemicals compared to the counterfactual.
Food and drink along with paper and pulp both see some of the smallest reductions in free allocations under package F, at around 6-7% lower free allocations compared to the counterfactual.
When looking at absolute changes, chemicals and cement see the largest reductions in free allocations. This occurs given the significant proportion of total free allocations that are projected for these sectors under the counterfactual, with around 60% allocated to these sectors over the period 2027-2030.
Overall policy package F provides an appropriate balance between implementing changes to reflect the introduction of the UK CBAM and potential future EU linking, while also trying to ensure a gradual phase out of free allocations to support industrial decarbonisation, in line with the UK ETS objectives. Policy package A has a higher risk of deindustrialisation instead of industrial decarbonisation. On the other hand, policy package B may have risked the opposite, with the reduction in free allocations too gradual thereby limiting industrial effort to decarbonise.
While a reduction in free allocations received may represent an opportunity cost[19], as installations will receive fewer free allocations than they would have previously, the true financial impact of the policy options will depend on how installations respond to the change. If it encourages more decarbonisation effort, then installations will not be required to purchase the equivalent of free allocations foregone. However, if installations do not decarbonise further in response to the policy change, they may be required to purchase allowances up to their foregone free allocations depending on support ratios. Support ratios are defined as the proportion of emissions which are covered by free allocations calculated as total free allocations received divided by total emissions for each sector. A support ratio above 100% indicates sectors, on average, have received more free allocations than have been needed, with free allocations received exceeding total emissions. This suggests operators wouldn‘t need to purchase any additional ETS allowances if support ratios remained at or above 100% due to the policy change. Conversely, any sector with a historic support ratio of less than 100% suggests additional allowances have had to be purchased up to 100% of emissions to cover ETS liabilities. Any reduction in free allocations in the future would require additional allowances to be purchased unless there is additional decarbonisation effort.
The maximum opportunity cost under each package is presented in graph 3D below, where nominal reductions in free allocations have been converted into equivalent 2024 monetary values based on projected market traded carbon values in the years 2027-2030[20].
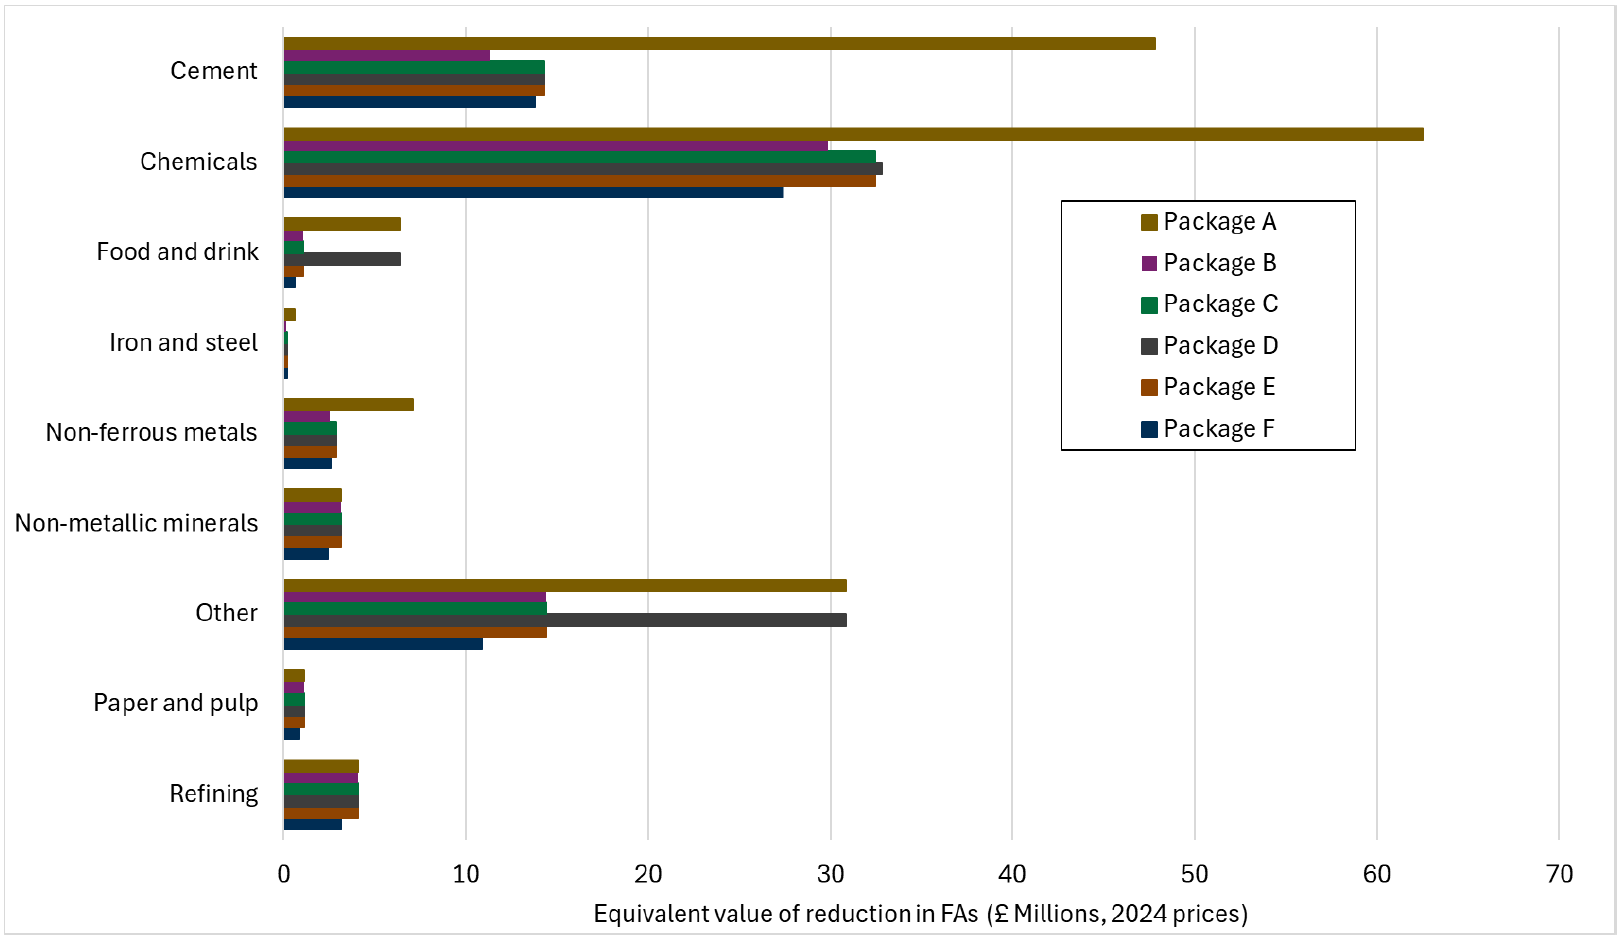
When comparing across policy packages, preferred policy package F appears to provide a suitable balance between reducing free allocations to support policy objectives, while also helping provide a gradual reduction in free allocations to promote industrial decarbonisation and reduce the risk of deindustrialisation. This contrasts policy packages A and B which represent options with more significant risks of deindustrialisation or too little additional decarbonisation effort.
Unsurprisingly graph 3D largely mirrors graph 3C, reflecting that market carbon values are projected to be largely similar over the period 2027-2030. Reductions in the volume of free allocations across the different policy packages reflect an opportunity cost and don’t necessarily translate into additional costs to Scottish sectors due to the interaction with support ratios. Historic support ratios for sectors across Scotland are illustrated in graph 3E below.
Graph 3E: Historic Support Ratios of Scottish ETS Sectors
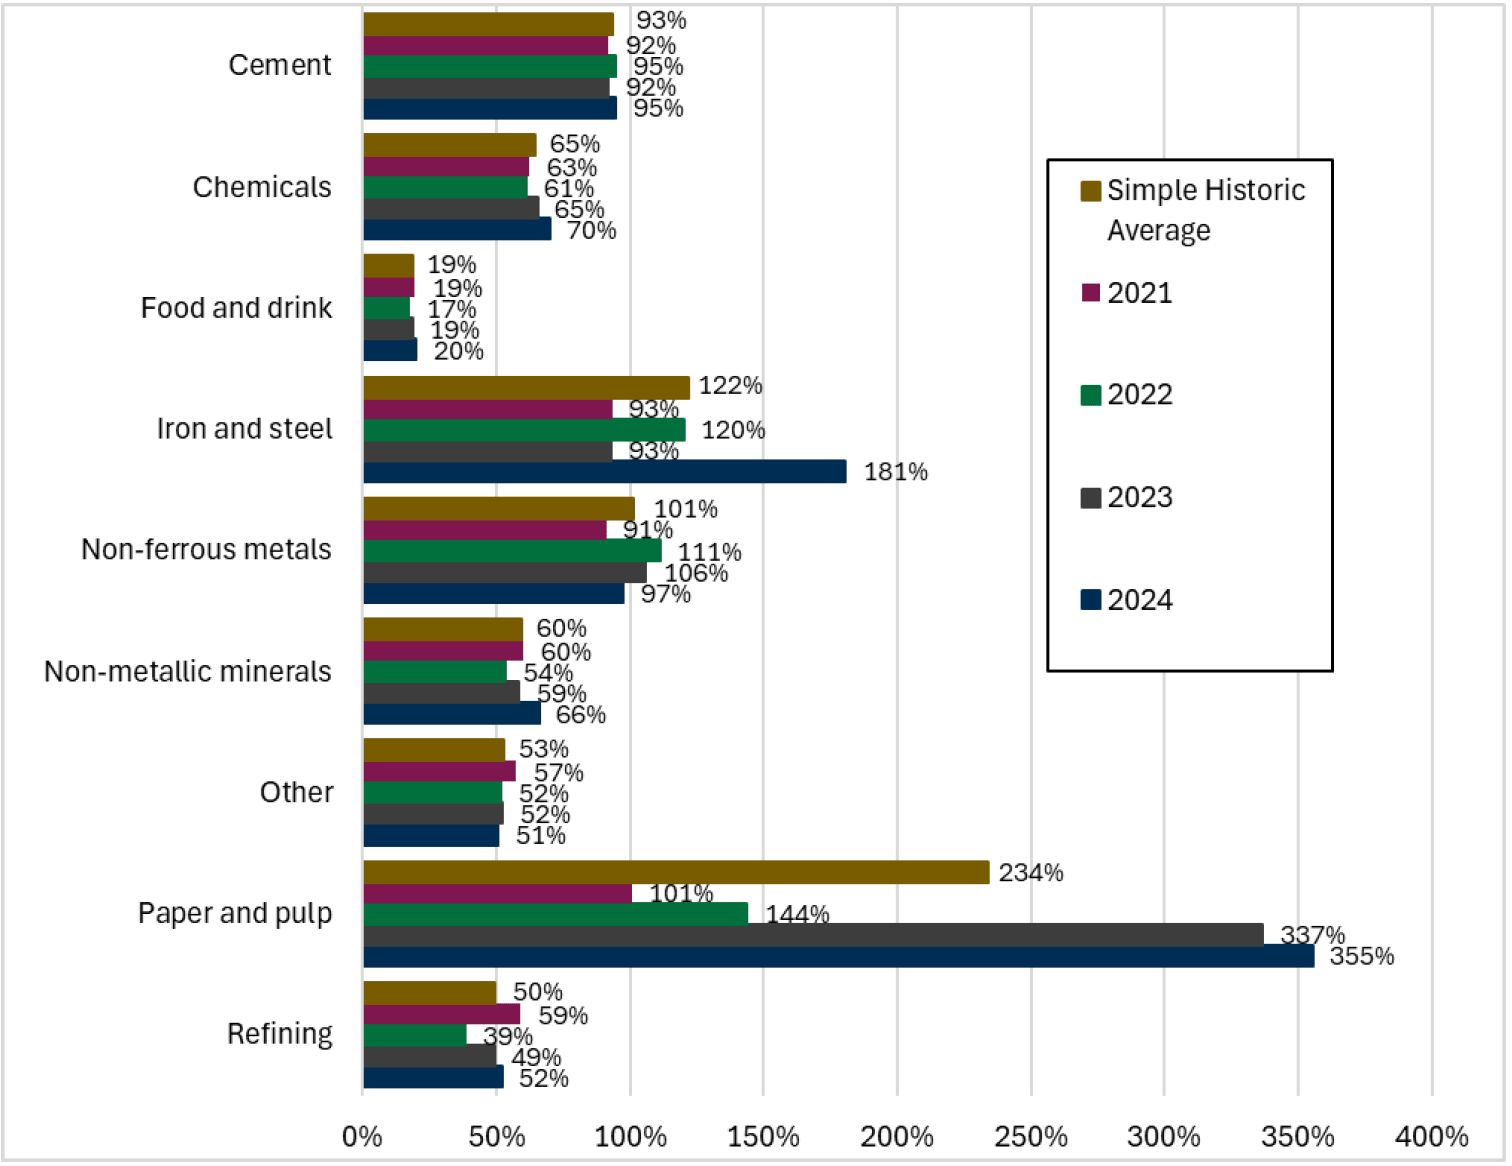
Alt Text: Historically the paper and pulp sector has seen the largest support ratios, followed by the iron and steel sector, non-ferrous metals, cement, chemicals, non-metallic minerals, other, refining, and food and drink.
While having seen some variability over time, paper and pulp, cement, non-ferrous metals and iron & steel have all seen support ratios of at least 90% historically. This indicates these sectors have relied significantly on free allocations for their ETS compliance obligations in the past. Conversely, food and drink have seen some of the lowest support ratios at an average of 19% over historic years. Chemicals, non-metallic metals and other have historically seen support ratios between 50% and 70%.
When focussing on simple historic averages, only iron and steel, non-ferrous metals and paper and pulp have seen support ratios greater than 100%. This implies that the maximum financial cost for all other sectors could be as high as the opportunity cost presented in graph 3D if sectors do not decarbonise further. Table 3B below represents the maximum additional financial cost Scottish sectors could face under each policy package. This assumes that historic support ratios would have remained constant over the 2027-2030 period under the counterfactual, and that sectors have to purchase the equivalent of free allocations foregone up to a support ratio of 100% over the 2027-2030 period to fulfil their ETS compliance obligations[21]. This extreme scenario assumes that sectors do not decarbonise further and represents an upper estimate of additional financial costs.
| Sector | Package A | Package B | Package C | Package D | Package E | Package F |
|---|---|---|---|---|---|---|
| Cement | £47.8m | £11.4m | £14.3m | £14.3m | £14.3m | £13.8m |
| Chemicals | £62.5m | £29.9m | £32.4m | £32.8m | £32.4m | £27.4m |
| Food and drink | £6.4m | £1.1m | £1.1m | £6.4m | £1.1m | £0.6m |
| Iron and steel | £0.5m | £0.1m | £0.1m | £0.1m | £0.1m | £0.1m |
| Non-ferrous metals | £7.0m | £2.5m | £2.8m | £2.8m | £2.8m | £2.5m |
| Non-metallic minerals | £3.2m | £3.2m | £3.2m | £3.2m | £3.2m | £2.4m |
| Other | £30.9m | £14.4m | £14.4m | £30.9m | £14.4m | £10.9m |
| Paper and pulp | £0.5m | £0.5m | £0.5m | £0.5m | £0.5m | £0.4m |
| Refining | £4.1m | £4.1m | £4.1m | £4.1m | £4.1m | £3.1m |
| Total | £162.8m | £67.0m | £72.9m | £95.1m | £72.9m | £67.0m |
Under the assumption of no additional decarbonisation effort, package A represents the costliest option with around £163m projected as additional ETS compliance costs for Scottish ETS sectors. This represents an upper estimate of costs, with operators having to purchase all foregone free allocations up to 100% of their compliance obligation due to no change in decarbonisation effort.
The preferred policy package F represents one of the least costly options with around £67m projected as additional ETS compliance costs over the period 2027-2030, similar to the least ambitious option package B. Under package F, costs are concentrated in the chemicals and cement sectors making up around 61% of total additional Scottish ETS sector costs. This occurs due to the significant proportion of total free allocations that are projected for these sectors under the counterfactual, with around 60% originally allocated to these sectors over the period 2027-2030. As is illustrated in graph 3B, neither sectors are disproportionately impacted by the policy changes compared to other sectors. Overall policy package F provides a suitable balance between implementing changes to reflect the introduction of the UK CBAM and potential future EU linking, while also trying to ensure a gradual phase out of free allocations to support industrial decarbonisation. Policy package A may have provided a too ambitious option, threatening deindustrialisation instead of industrial decarbonisation. On the other hand, policy package B may have provided the alternative extreme with the reduction in free allocations too gradual limiting additional industrial effort to decarbonise.
While table 3B illustrates projected maximum costs from each policy package, true costs to businesses could be lower through additional decarbonisation effort. This would occur where it is more cost effective to invest in decarbonisation technologies to reduce carbon emissions and consequently reduce ETS compliance costs. Estimates of additional decarbonisation effort and abatement costs are presented in Chapter 15 of the UK ETS Authority’s Impact Assessment[22]. In the regional impacts section, net present social values are calculated by region when assuming emissions and population shares of abatement costs and emissions savings respectively. As noted, while this approach is useful for providing an indication of aggregate distributional impacts, regions with a higher concentration of sectors with relatively low-cost abatement options will see the greatest emissions reductions and cost savings. Consequently, estimates of regional abatement costs will not be reflective of the true abatement costs and opportunities for Scottish ETS sectors. Due to this, no estimates of abatement costs have been attempted with table 3B representing an upper limit of Scottish sectoral costs.
Considering all the above policy package comparisons, package F appears to provide a strong balance between implementing changes to free allocations in light of the introduction of a new UK CBAM from 2027, ensuring businesses are supported with a smooth transition without excessive cost, and providing a policy landscape consistent with potential future EU ETS linking[23]. Changes to ALCs would include COVID mitigations to avoid including abnormal historic years, while EU benchmarks would be used from 2028. The phase-out of free allocations for CBAM sectors would be aligned with the EU’s phase-out, with a 1-year delay reflecting that the UK CBAM is expected to be introduced one year after the EU’s CBAM. There would be no early non-carbon leakage phase-out from 2027, and no consideration of conditionality. Consequently, while less ambitious than option package A, package F provides a balance across the different policy packages considered while also bearing the joint least maximum additional ETS costs, similar to option package B, but with more ambitious projections.
As illustrated in graph 3B and table 3B, preferred policy package F represents the best option for sectors overall while trying to provide a suitable balance between achieving the policy intent of the change and continuing to support industrial decarbonisation and minimise the risk of deindustrialisation.
Other impacts
Furthermore, businesses may face a one-off familiarisation cost due to a change in the regulatory environment. While this is a possibility, these costs are likely to be negligible when compared to the aforementioned monetised impacts given the magnitude of the proposed policy changes.
Scottish firms’ international competitiveness
The measures covered by this BRIA aim to incentivise business to decarbonise in a cost-efficient way, including by improving efficiency which could result in increased competitiveness in global markets. Where companies are deemed at risk of carbon leakage, they receive a proportion of their allowances for free.
To ensure the UK CBAM applies an effective cost on imports and to maintain the carbon price signal to drive decarbonisation, the phase-out of free allocations must be coordinated with the phased introduction of the UK CBAM from 2027 to ensure parity between domestic and import pricing.
The UK’s CBAM phase out will begin one year after the EU’s to align with the introduction of the UK CBAM. While the decision has been made to align with the EU’s phase-out trajectory of free allocation for CBAM sectors, the one-year delay between the EU and UK start date for implementation may pose a cross-border competitiveness risk, the extent of which remains unknown. During this one-year delay, UK producers could receive higher free allocation than their EU counterparts, further inflating the price differential paid domestically between both the UK and EU ETS markets. The CBAM cost is calculated as the difference between the domestic ETS price and the carbon price paid in the exporting country, adjusted for any free allocation. Due to market volatility and differing timelines for phasing out free allocations, actual EU CBAM costs remain uncertain and subject to change. Therefore, the impact on Scottish export competitiveness in the short-term remains unknown. However, by aligning the start of the phase out with the implementation of the UK CBAM
For those sectors covered by the UK CBAM, a reduction in free allocation will support the transition toward the UK CBAM becoming the principal mechanism for mitigating carbon leakage. This will incentivise low-carbon imports and disincentivise high-carbon imports. For those sectors not covered by the UK CBAM, a reduction in free allocation could reduce the international competitiveness of UK firms, resulting in greater quantities of imports. The sectoral scope of the UK CBAM will be kept under review beyond 2027, as new evidence comes to light to reflect changes to carbon leakage risk, as well as methodological and technological advances. This is required to ensure the CBAM continues to effectively mitigate carbon leakage risks as the UK decarbonises. The UK ETS Authority will continue to carefully consider interactions between CBAM sectoral scope and UK ETS free allocation.
Stakeholders have consistently called for a cautious approach that avoids premature reductions in free allocation before the UK CBAM is proven to function effectively. The Authority has taken this feedback into account and designed a trajectory that provides certainty to operators while maintaining flexibility to respond to future developments. The approach taken mirrors the pace and scale of phase out of free allocation in the EU ETS for sectors covered by the EU CBAM. This will support consistency in the transition for UK and EU businesses.
Benefits to business
Policy packages have been created with potential future EU linking in mind, where businesses may experience benefits that could come from any potential future EU linking agreement. These could include benefits such as improved market liquidity, lower overall compliance costs, and improved price stability and convergence. Combining emissions trading schemes has been found to increase liquidity due to the creation of a larger ETS market with reduced transaction costs for businesses buying and selling allowances[24]. Moreover, a larger ETS market allows for greater abatement options, where those with the lowest costs are able to reduce their emissions and lower the overall cost of compliance for businesses within the UK ETS. Lastly, linking ETS markets allows for convergence of a single carbon price across a greater number of regions, providing lower price volatility and creating a more stable price signal for businesses making long-term decarbonisation investment decisions.
Small business impacts
Participation in the UK ETS for industry and power generation businesses is only required for installations sites where combustion units with a total rated thermal input exceeding 20MW are operated[25]. As a result, it is unlikely that small businesses will be disproportionately affected.
Investment
The impact of the proposed policy change on investment is highly uncertain due to mixed implications. On the one hand, the reduction in free allocations for CBAM sectors is a direct result of the anticipated introduction of the UK CBAM. The UK CBAM would introduce carbon costs for imports from outside of the UK, effectively reducing the relative cost of domestically produced industrial goods. However, this will correspond with a reduction in free allocations for CBAM sectors which could introduce higher UK ETS compliance obligations. The net effect impact on investment in Scotland is highly uncertain as it depends on whether the domestic benefits of the UK CBAM outweigh the costs of receiving lower free allocations. Therefore it is not currently known what, if any, material impact the change will have on the potential to make Scotland a more, or less, attractive place for global investment. The Authority will continue to assess any impacts to ensure evidence feeds into future UK ETS policy decisions.
Workforce and Fair Work
The policy is not anticipated to have any specific impacts on the ability of businesses to meet the Fair Work First principles.
The proposed changes apply specifically to sectors most at risk of carbon leakage who receive free allocations. Any indirect effects on the workforce will depend on the commercial decisions made by these sectors. The Scottish Government does not collect information on the commercial choices of businesses or the factors influencing them and therefore cannot predict or confirm how sectors may respond to changes in the UK ETS.
Climate change/ Circular Economy
Both the UK Government and the Scottish Government have legislated ambitious net zero targets. Scotland's greenhouse gas emissions reduction targets are set out in the Climate Change (Scotland) Act 2009[26]. Scotland's net zero target is consistent with the overall UK target and is based on advice from the CCC.
The UK ETS aids the Scottish Government’s priority of tackling the climate emergency and is generally seen as the most economically efficient way of driving decarbonisation. The UK ETS operates under a cap-and-trade system, where a fixed number of emissions allowances are issued every year. Over time, the cap is reduced to drive emissions down and increase the carbon price, thereby encouraging investment in decarbonisation technologies.
Free allocation of UK ETS allowances is the primary policy instrument through which carbon leakage risk is currently addressed in the UK. The UK ETS Authority defines ‘carbon leakage’ as the movement of production and associated emissions from one country to another due to different levels of decarbonisation effort, through carbon pricing and climate regulation. The proposed changes mark a significant step in the evolution of the UK ETS. By updating the free allocation rules to reflect a large data pool of latest emissions efficiencies taken by industry to drive decarbonisation, the Authority is ensuring that the scheme remains environmentally robust and aligned with the net zero ambitions across the UK. The adoption of updated EU benchmark values, the retention of a robust Carbon Leakage List, and the gradual phase out of free allocation for UK CBAM sectors all contribute to a more targeted and effective scheme. These changes maintain the incentive for installations to decarbonise—ensuring that efficient operators are rewarded and that the scheme continues to drive emissions reductions for industries across the UK.
This policy supports Scotland’s Environment National Outcome as it directly contributes to the reduction of greenhouse gas emissions sectors at risk of carbon leakage. This aligns with Scotland’s commitment to tackle climate action.
Competition Assessment
The proposed changes apply specifically to sectors most at risk of carbon leakage who receive free allocations and do not directly affect consumers. The impact of these changes on business competitiveness is hard to quantify as free allocation is just one factor of many impacting on competitiveness. It is not thought that these measures will directly impact competition in terms of limiting the range or numbers of businesses operating in the market. None of the wider proposals are deemed to risk limiting the range or numbers of suppliers. We have not identified any impact on competition associated with these changes.
The proposed changes to the UK ETS are not expected to:
- directly or indirectly limit the number or range of supplier,
- limit the ability of suppliers to compete or limit suppliers’ incentives to compete,
- affect consumers’ ability to engage with the market and make choices that align with their preferences, or
- affect suppliers’ ability and/or incentive to introduce new technologies, products or business models.
Any unexpected effects on consumers or suppliers will depend on the commercial decisions made by these sectors. The Scottish Government does not collect information on the commercial choices of businesses or the factors influencing them and therefore cannot predict or confirm how sectors may respond to changes in the UK ETS.
Consumer Duty
The Consumer Scotland Act 2020 (‘the 2020 Act’) introduced a duty on public authorities in Scotland, when making decisions of a strategic nature in relation to the exercise of its functions, to have regard to the impact of those decisions on consumers (individuals or small businesses) of goods and services in Scotland that are supplied by a public authority or body.
The proposed changes to the UK ETS will primarily affect the sites and businesses which are covered by the UK ETS. These are primarily high-emitting sectors with large energy intensive operators. Changes aim to incentivise business to decarbonise in a cost-efficient way, with those deemed most at risk of carbon leakage receiving a proportion of their allowances for free. Therefore, the measures covered in this BRIA are not expected to have an impact on consumers as they do not involve the supply of goods or services by the Scottish Government or another public authority to individuals and small businesses. The impact on consumers more widely has been considered, with no direct negative impacts identified. The proposed changes apply specifically to sectors most at risk of carbon leakage who receive free allocations and do not directly affect consumers. Any indirect effects on consumers as a result of any cost implications will depend on the commercial decisions made by these sectors. The Scottish Government does not collect information on the commercial choices of businesses or the factors influencing them and therefore cannot predict or confirm how sectors may respond to changes in the UK ETS.
Contact
Email: emissions.trading@gov.scot