Supporting Communities Fund: evaluation
Evaluation which assessed how the funding was spent and what the outputs were as well as looking at the experiences of those involved in the fund.
2. Distribution of funding
2.1 Overview of applications
A total of 536 applications, including for uplift funding, were received. At the time of writing 465 were approved and 71 EOIs were received but were not progressed to a full application (with 373 organisations receiving funding), meaning 86.8% of applications were successful. The average amount of funding requested by successful applications was £37,027 and most applications requested <£30,000 funding. Data on the amount of funding requested by unsuccessful applications was unavailable. Larger amounts of funding, of £100,000 or over, were requested by 34 organisations. The amount of funding requested ranged from £1,500 to £329,720.
The total value of funding requested was £17,254,363 and the total value of funding approved was £17,056,890. Within the 465 approved applications, there were 92 requests for uplift[3] funding. The extended period was supported in recognition of the ongoing challenge posed by the Covid-19 pandemic, where the majority of requests were to continue services beyond the initial time period or because of an expected increase in demand. Organisations also sought uplift funding when it became apparent they needed to employ a coordinator to help organise their activities. The total value of uplift funding requested was £2,073,427 and the total value of uplift applications funding approved was £2,039,647.
To prevent applications from being rejected, the SCFP and IFPs engaged with CAOs throughout the application process to amend those applications which didn't initially meet the criteria. The key issues for the panel to consider were eligible costs or to consider the possibility of duplication that was not picked up at the EOI stage. A small number of EOIs were not progressed to the application stage because the organisation did want to proceed or the project did not meet the criteria. For example, if the project did not directly relate to the Covid-19 pandemic or funding was requested to replace lost income alone.
2.2 Geographical distribution
The table below shows how many applications were made by local authority, the funding requested and the funding awarded. The per head of population values are based on the National Records of Scotland mid-2019 population estimates.[4] As noted above, analysis of the geographical data relating to applications and awards was limited by the fact that many applicant organisations were often working across several areas and more than one local authority. This made it challenging to undertake a full analysis of how funding was spent in different local authorities. As such, the analysis presented below is based on the location of the CAO.
| Local Authority | Number of applications | Total funding requested | Total Funding awarded | Per head of Pop - 2019 Estimates |
|---|---|---|---|---|
| Aberdeen | 5(0.9%) | £310,441 | £310,441 (2%) | £1.36 |
| Aberdeenshire | 17(3.2%) | £313,313 | £313,313 (2%) | £1.20 |
| Angus | 3(0.6%) | £150,000 | £125,000 (1%) | £1.08 |
| Argyll and Bute | 34(6.3%) | £565,850 | £565,850 (3%) | £6.59 |
| Clackmannanshire | 8(1.5%) | £121,303 | £121,303 (1%) | £2.35 |
| Comhairle nan Eilean Siar | 18(3.4%) | £343,881 | £343,881 (2%) | £12.87 |
| Dumfries and Galloway | 19(3.5%) | £389,930 | £388,647 (2%) | £2.61 |
| Dundee | 5(0.9%) | £249,600 | £249,600 (1%) | £1.67 |
| East Ayrshire | 14(2.6%) | £264,264 | £264,264 (2%) | £2.17 |
| East Dunbartonshire | 6(1.1%) | £74,250 | £74,250 (<1%) | £0.68 |
| East Lothian | 4(0.7%) | £187,614 | £187,614 (1%) | £1.75 |
| East Renfrewshire | 4(0.7%) | £154,016 | £154,016 (1%) | £1.61 |
| Edinburgh | 24(4.5%) | £1,217,635 | £1,162,920 (7%) | £2.22 |
| Falkirk | 4(0.7%) | £155,600 | £155,600 (1%) | £0.97 |
| Fife | 19(3.5%) | £689,671 | £689,671 (4%) | £1.85 |
| Glasgow | 66(12.3%) | £4,420,825 | £4,387,045 (26%) | £6.93 |
| Highland | 99(18.5%) | £1,934,710 | £1,934,710 (11%) | £8.20 |
| Inverclyde | 7(1.3%) | £315,780 | £315,780 (2%) | £4.06 |
| Midlothian | 7(1.3%) | £309,791 | £309,791 (2%) | £3.35 |
| Moray | 21(3.9%) | £429,039 | £429,039 (3%) | £4.48 |
| Multiple | 7(1.3%) | £568,207 | £529,784 (3%) | n/a |
| North Ayrshire | 13(2.4%) | £387,865 | £387,865 (2%) | £2.88 |
| North Lanarkshire | 10(1.9%) | £502,719 | £492,719 (3%) | £1.44 |
| Orkney | 14(2.6%) | £224,373 | £224,373 (1%) | £10.08 |
| Perth and Kinross | 16(3.0%) | £434,726 | £434,726 (3%) | £2.86 |
| Renfrewshire | 9(1.7%) | £591,012 | £591,012 (3%) | £3.30 |
| Scottish Borders | 12(2.2%) | £463,335 | £463,335 (3%) | £4.01 |
| Shetland | 24(4.5%) | £260,665 | £260,665 (2%) | £11.37 |
| South Ayrshire | 8(1.5%) | £368,436 | £334,164 (2%) | £2.97 |
| South Lanarkshire | 12(2.2%) | £332,472 | £332,472 (2%) | £1.04 |
| Stirling | 10(1.9%) | £108,253 | £108,253 (1%) | £1.15 |
| West Dunbartonshire | 7(1.3%) | £123,550 | £123,550 (1%) | £1.39 |
| West Lothian | 10(1.9%) | £291,237 | £291,237 (2%) | £1.59 |
| Total | 536 | £17,254,363 | £17,056,890 | £3.12 |
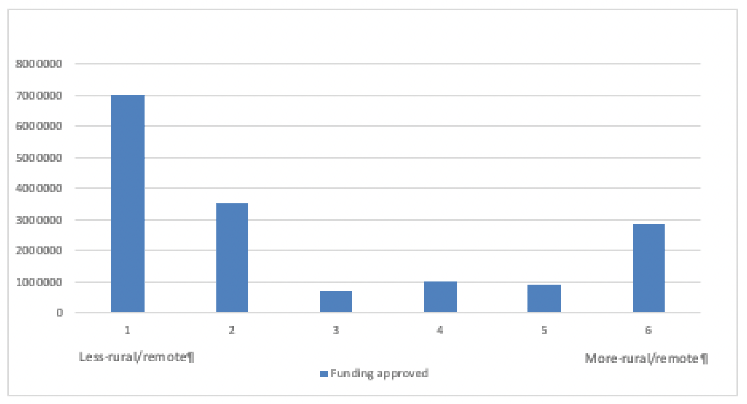
When analysed by Urban/Rural classification, using the Scottish Government's 2016 six-fold classification, most funding was distributed to Large Urban Areas Settlements of over 125,000 people and Other Urban Areas Settlements of 10,000 to 125,000 people. Just over a quarter of funding was distributed to projects in the Glasgow City Council area.
A substantial amount of funding was also delivered to Remote Rural Settlements of less than 3,000 people and with a drive time of over 30 minutes to a settlement of 10,000 or more. Island communities in particular received higher amounts per head of population than other local authority areas.
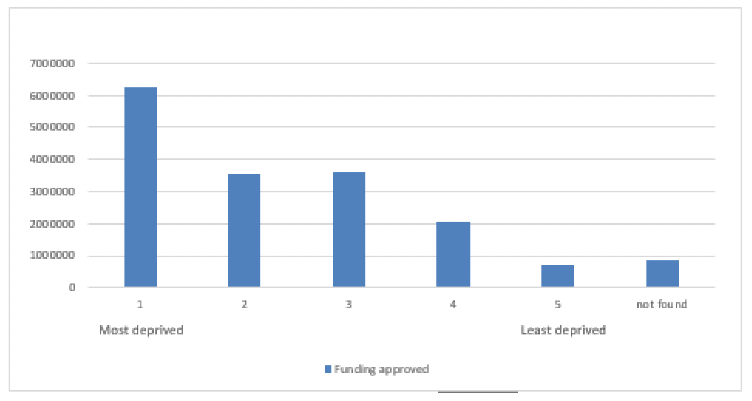
The majority of the funding was delivered to projects operating within the two lowest SIMD quintiles (see Chart 2). With least deprived quintiles requesting and receiving the least amount of funding.However, as noted in section 2.2, as many projects were operating over several areas, and this analysis is based on local authority areas, a full analysis of deprivation is challenging.
Contact
Email: Gillian.Gunn@gov.scot