Scottish Social Attitudes Survey 2019: intra-household distribution of resources
Looks at how couples organise their income and financial responsibilities and how they conduct financial decision-making.
Chapter 3 – Financial decision making
All respondents who were living with a partner were asked a series of questions in SSA 2019 regarding their financial decision making. This included who makes the financial decisions on different types of purchases, whose money is used to pay for different types of expenditure and who is responsible for ensuring the household does not live beyond its means.
Decision making about spending on regular grocery shopping and large household items
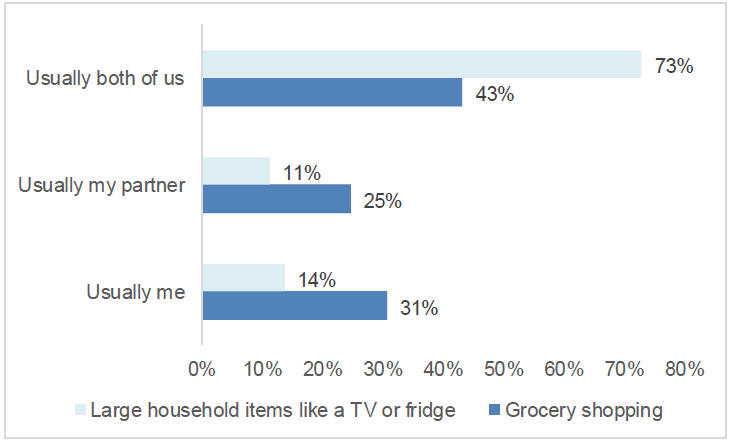
Figure 3.1 below shows the responses for the following two questions on who in the household makes decisions about spending:
Thinking about you and your partner, who usually makes the decisions for the two of you about…
…how much to spend on regular grocery shopping?
…how much to spend on large household items such as a TV or a fridge?
Decisions on how much to spend on larger household items are more often taken by both partners (73%) than decisions on how much to spend on grocery shopping (43%). Just under a third (31%) of those living with a partner said it was usually themselves who make the decisions on how much to spend on grocery shopping, with a quarter (25%) saying it was usually their partner. The equivalent figures for decisions on large household items are 14% and 11% respectively.
Base: all respondents living with a partner
There were distinct differences in responses between subgroups on who makes decisions on how much to spend on groceries or large household items, with one of the most noticeable differences being by gender. Women in Scotland were more likely to make the decisions on how much to spend on groceries than men, while decision-making on large household items is split more or less equally between the two genders.
As Figure 3.2 below shows, women are considerably more likely (49%) than men (12%) to say that they usually make the decisions on how much to spend on grocery shopping. Supporting this finding, men were much more likely (42%) than women (7%) to say it is their partner who usually makes these decisions. This marked difference in response to the question by gender contrasts with the responses to the equivalent question on who makes the decisions on how much to spend on large household items such as a TV or fridge, for which there are no significant differences between men and women.
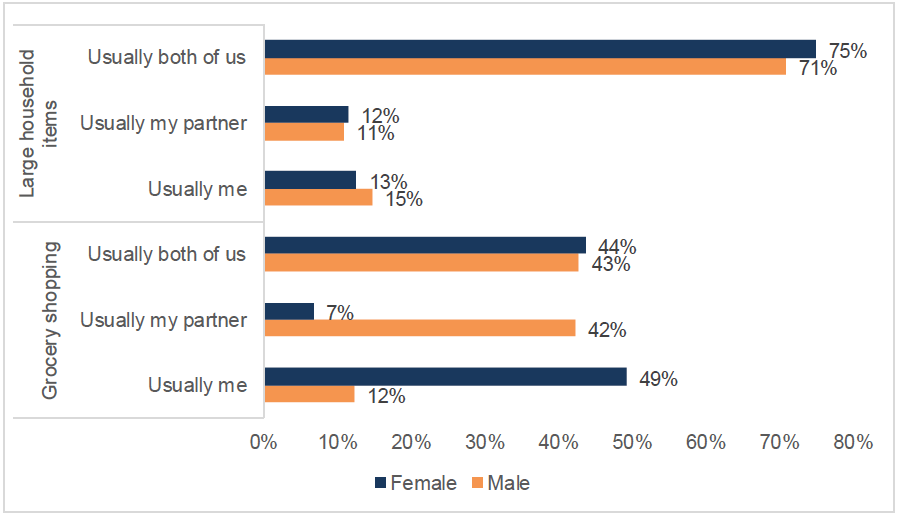
Base: all respondents living with a partner
Unweighted bases: Women = 284, Men = 272. Weighted bases: Women = 318, Men = 323.
The other noticeable difference in responses to these questions was by marital status. Those who are married were less likely to say it was usually both partners who make the decisions on groceries (41%) than those who were living with a partner and not married (55%), but married people were more likely to say that it is usually both partners who make decisions on how much to spend on large household items (78%) than those living with a partner and not married (63%).
Money used to pay for regular grocery shopping and large household items
As well as being asked who makes the decisions on how much to spend on these items, those living with a partner were also asked whose money they would usually use to pay for spending on groceries; large household items; and an unexpected repair bill. The results for each of these questions are shown in Table 3.1 below.
And still thinking about you and your partner, whose money would you usually use to pay for…
…spending on regular grocery shopping
… large household items such as a TV or a fridge?
Imagine if you got an unexpected repair bill. Whose money would you use to pay for it?
|
|
Usually mine (%) | Usually my partner's (%) | Usually we'd pay using money from a joint account or pool (%) | Usually we'd pay with each of us using some of our own money (%) |
|---|---|---|---|---|
| Groceries | 17 | 13 | 59 | 9 |
| Large household items | 14 | 9 | 65 | 10 |
| Unexpected repair bill | 16 | 11 | 64 | 6 |
Base: all respondents living with a partner
As previously discussed, when comparing the proportions of those who said it was 'usually both of us' who make the decisions on how much to spend on regular grocery shopping and who make the decisions on how much to spend on large household items, there was a 30-percentage-point difference between the two, with almost three-quarters (73%) saying it was 'usually both of us' who make the decisions on large household items compared with just over two-fifths (43%) saying the same about the regular grocery shopping. In comparison, when it came to whose money is usually used for these types of expenditure, there was a much smaller difference in the proportion stating the money comes from a joint pool for the three different types of expenditure. For groceries, 59% said they use money from a joint pool, 65% said this for large household items and 64% for an unexpected repair bill. In addition, the proportion who said that they pay by 'each of us using some of our own money' was 9% for groceries, 10% for large household items and 6% for unexpected repairs.
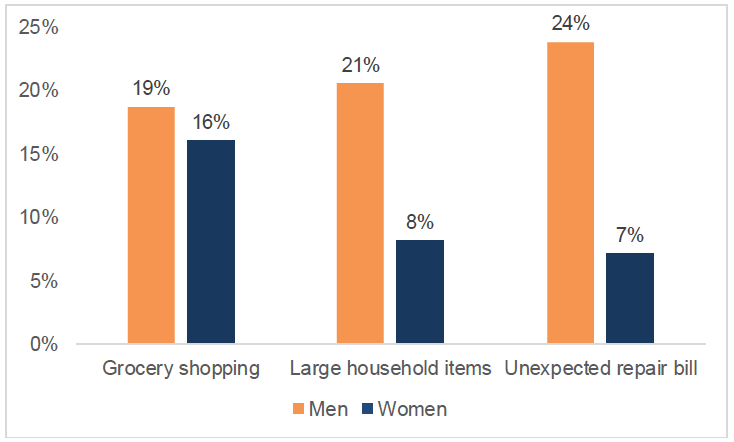
There were noticeable differences between subgroups in whose money would usually be used for expenditure for groceries, large household items and an unexpected repair bill. Men were more likely than women to say that they would usually use their own money to pay for large household items, like a TV or fridge, or for an unexpected repair bill, while women were more likely than men to say they would usually use their partner's money. As shown in Figure 3.3 below, around a fifth (21%) of men said they would usually use their own money to pay for large household items compared with fewer than one in ten (8%) women; around a quarter (24%) of men said they would usually use their own money for an unexpected repair bill compared with 7% of women, while the proportion of men saying they would usually use their own money for regular grocery shopping (19%) was similar to the proportion of women (16%) who said they would do so. For larger household items, those working part-time were significantly more likely than those working full-time to say they would usually use their partner's money (17% and 5% respectively) with women being more likely than men to work part-time (34% of women compared with 10% of men).
Base: all respondents living with a partner
Unweighted bases: Women = 284, Men = 272. Weighted bases: Women = 318, Men = 323.
For larger household items and unexpected repair bills, significant differences in responses were also evident by marital status. Around seven in ten (69%) of those who are married said they would pay for an unexpected repair bill from a joint pool compared with over a half (55%) who are living with a partner and not married,[12] while 13% of the latter said they would each use some of their own money compared with 4% of the former. Those who are living with a partner and not married were more likely to say they would pay for large household items each using some of their own money (21%) than those who are married (7%).
The relationship between who makes household spending decisions and whose money is used
There was also a relationship between who in the household makes decisions about how much to spend on regular grocery shopping and whose money is used to pay for it. Figure 3.4 below shows that around a quarter (26%) of those who said they make the decisions about how much to spend on regular grocery shopping also said it was usually their own money they use to spend on it. This is compared with 15% who said it was their partner who makes the decisions, but their own money is used to spend on it, and 13% who said it was both partners together who make the decision but their own money that is used. Over half (53%) of those who said that usually their partner makes the decisions about spending on groceries also said these items are paid for from a joint account.
For large household items, such as a TV or fridge, the majority of those who said they usually make the decisions on how much to spend on them (57%) also said it was usually their money they use to pay for them. In contrast, only 7% who said it was usually their partner who makes the decisions on these items said they used their own money to pay for them and 8% who said both partners together make the decisions said they used their own money. Nearly 3 in 5 (57%) of those who said it was usually their partner who makes the decisions about spending on large household items said these items are paid for from a joint account.
Around two-thirds (65%) of those who usually make joint decisions about spending on groceries also use a joint pool to pay for their groceries and three-quarters (75%) of those who make joint decisions on large household items, such as a TV or fridge, said the money used to pay for them comes from a joint pool.
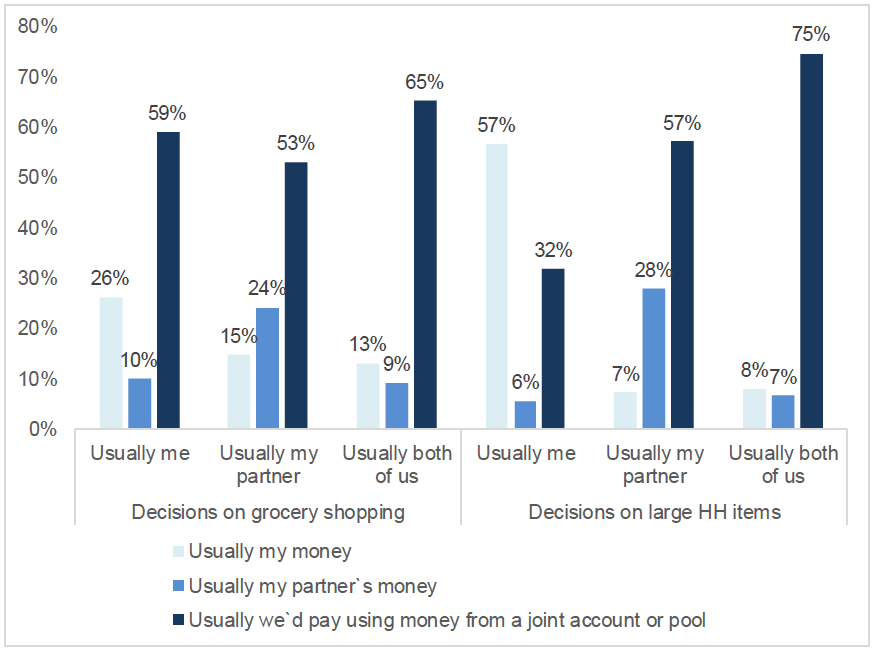
Base: all respondents living with a partner
Weighted bases: Grocery shopping: Usually me=197, Usually my partner=158, Usually both of us=278: Large household items: Usually me=88, Usually my partner=72, Usually both of us=468. Unweighted bases: Grocery shopping: Usually me=177, Usually my partner=129, Usually both of us=245: Large household items: Usually me=74, Usually my partner=61, Usually both of us=414.
Relationships were also evident between how someone organises their household income with their partner and whose money they would usually use to pay for regular groceries, large household items or an unexpected repair bill. The majority of those who pool at least some of their income with their partner would also usually pay for each item of expenditure using money from the joint pool. For groceries, around three-fifths (59%) of those who pool a portion of their income (most/about half/some) with their partner, and just over four-fifths (83%) of those who pool all of their income with their partner usually pay for the grocery shopping from the joint pool. For large household items the figures are 71% and 87% respectively, while for unexpected repair bills the figures are 70% and 89% respectively.
Of those who said they keep all (or almost all) of their own income and do not pool any with their partner, the responses to whose money is used to pay for these items are more evenly spread. For grocery shopping, 27% of those who keep all their own money said they would usually pay for it by using their own money, 26% said they would usually pay for it using their partner's money and 25% said they would usually pay for it each using some of their own money. The equivalent figures for large household items were 29%, 20% and 30% respectively.
For unexpected repair bills, around a third (34%) of those who keep all their own income said they would usually use their own money to pay for them. Men were significantly more likely than women (62% of men compared with 16% of women) to say that if they keep all their own income they would usually use their own money to pay for an unexpected repair bill. A quarter (25%) of those who keep all their own income said they would use their partner's money to pay for unexpected repair bills, with women being significantly more likely than men to say they would use their partner's money (40% of women compared with 2% of men). A fifth (20%) said each partner would pay using some of their own money but there were no differences in the experiences of men and women.
Responsibility for ensuring the household does not live beyond its means
Those living with a partner were also asked 'who is usually responsible for trying to make sure that you and your partner don't live beyond your means?' Over half (55%) said that this was 'usually both of us', with around a quarter (26%) saying it was 'usually me' and 17% saying it was 'usually my partner'.
Women were more likely to say they have this responsibility than men, with around a third (32%) of women saying it was 'usually me' who was responsible for trying to make sure that 'you and your partner do not live beyond your means' compared with just under a fifth (19%) of men. Men were slightly more likely than women (59% compared with 52% respectively) to say the responsibility is held by both partners in the household. Those without children (aged 0-17 in the household) were more likely to say that it is the responsibility of both partners (59%) to make sure that they do not live beyond their means than those with children aged 0-17 in the household (49%).[13]
The person in the partnership who is responsible for making decisions on household expenditure was also typically more likely to be the person responsible for ensuring the household do not live beyond its means. Of those who said they are usually responsible for making decisions on how much to spend on grocery shopping, 44% said they are also responsible for ensuring the household does not live beyond its means, compared with around a fifth (21%) who said their partner usually makes these decisions and 16% who said the decisions are usually made by both partners. Those who said decisions on grocery shopping are usually made jointly were also more likely (65%) to say that both partners are usually responsible for ensuring the household does not live beyond its means than those who said these decisions are usually made by their partner (54%) or themselves (45%).
These relationships were also evident among those who make the decisions on expenditure on large household items, such as TVs or fridges. Almost half (48%) of those who said they usually make the decisions on how much to spend on these items said they are usually responsible for ensuring the household does not live beyond its means, compared with just over a fifth (22%) of those who said their partner makes these decisions and the same proportion (22%) of those who said the decisions are usually made by both partners. This suggests that where one member of the partnership takes responsibility for one area of financial decision-making, they are significantly more likely to take on multiple financial responsibilities for the household budget.
A majority of those who said the decisions on spending for large household items are made jointly (62%) also said that both partners are usually responsible for ensuring the household does not live beyond its means, compared with 44% of those who said they are usually responsible for these decisions on spending for large household items and around a third (34%) of those who said their partner is.
Whether a partner who earns twice as much should be able to buy more luxuries than the partner who earns less
Finally, as a way of understanding how people feel decision-making within partnerships should be organised, all SSA 2019 respondents, whether in a couple or not, were asked:
Do you think the partner who earns twice as much should or should not be able to buy more luxuries than the partner who earns less?
1. Definitely should
2. Probably should
3. Probably should not
4. Definitely should not
The results are presented in Table 3.2 below, which shows that the majority of the Scottish public do not think a disparity in income within a partnership justifies a disparity in spending on luxuries. Most people thought that the partner earning twice as much should not be able to buy more luxuries than the partner who earns less, just under two-thirds (62%) saying they 'definitely should not' or 'probably should not' and just over a third (36%) saying they 'definitely' or 'probably should'. One in ten (10%) thought the higher earning partner 'definitely should' be able to spend more money on luxuries while a quarter (25%) thought they 'probably should', with a third (32%) saying they 'definitely should not' and around three in ten (29%) saying they 'probably should not'. There were no significant differences between the views of men and women on whether a partner earning twice as much should be able to buy more luxuries than the partner who is earning less.
| All % | Men % | Women % | |
|---|---|---|---|
| Definitely should | 10 | 10 | 11 |
| Probably should | 25 | 27 | 23 |
| Probably should not | 29 | 28 | 30 |
| Definitely should not | 32 | 32 | 33 |
| Weighted base | 1022 | 493 | 529 |
| Unweighted base | 1022 | 474 | 548 |
Base: all respondents
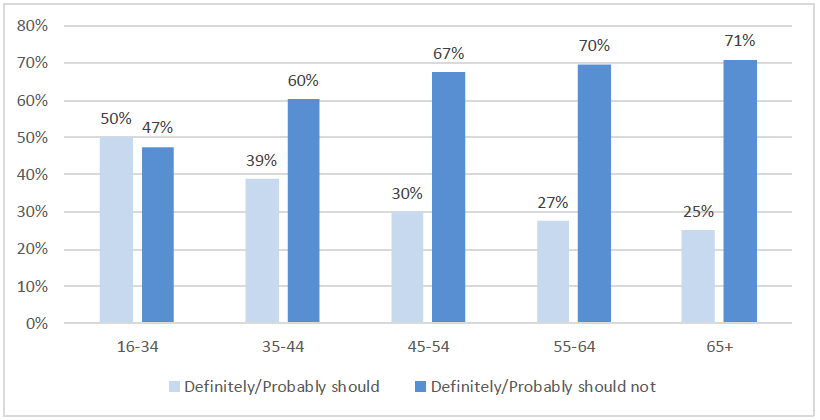
A noticeable difference was seen by age on views about whether a partner who earns twice as much should be able to buy more luxuries (see Figure 3.6 below). Young people aged 16-34 were the only age group more likely to think the higher earning partner 'definitely' or 'probably should' (50%) be able to spend more on luxuries than thought they 'definitely' or 'probably should not' (47%). All other age groups were more likely to say that the partner who earns twice as much should not be able to buy more luxuries. Generally, as people get older they are less likely to think that the partner earning more should definitely or probably be able to spend more on luxuries, with around two-fifths (39%) of those aged 35-44 years old and only a quarter (25%) of those aged 65 and over thinking this.
Base: all respondents
Unweighted bases: Age: 16-34=182, 35-44=130, 45-54=183, 55-64=186, 65+=339. Weighted bases: Age: 16-34=300, 35-44=151, 45-54=176, 55-64=164, 65+=230.
Those who were married were significantly less likely (25%) to think the partner who earns twice as much 'definitely' or 'probably should' be able to buy more luxuries than those who were living with a partner and not married (42%), while those without children (aged 0 to 17) in the household were more likely (38%) to think they 'definitely' or 'probably should' be able to do so than those who have children (aged 0 to 17) in the household (30%).[14]
Interestingly, nearly half (46%) of those who were struggling on their present income thought the partner earning twice as much 'definitely' or 'probably should' be able to buy more luxuries compared with a third (33%) of those living comfortably on their present income.[15] Conversely, around two-thirds of those living comfortably on their present income (65%) thought the partner who earns more 'definitely' or 'probably should not' be able to buy more luxuries compared with around half of those (49%) who are struggling on their present income.