Scottish Shellfish Farm Production Survey 2022
This report is based on the returns of an annual survey questionnaire sent to all active authorised shellfish farming businesses in Scotland. Statistics on employment, production and value of shellfish from Scottish shellfish farms are presented.
Appendix 2
| 2013 | 2014 | 2015 | 2016 | 2017 | 2018 | 2019 | 2020 | 2021 | 2022 | |||||||||||
|---|---|---|---|---|---|---|---|---|---|---|---|---|---|---|---|---|---|---|---|---|
| Scottish Marine Region | Tonnage | Value £ | Tonnage | Value £ | Tonnage | Value £ | Tonnage | Value £ | Tonnage | Value £ | Tonnage | Value £ | Tonnage | Value £ | Tonnage | Value £ | Tonnage | Value £ | Tonnage | Value £ |
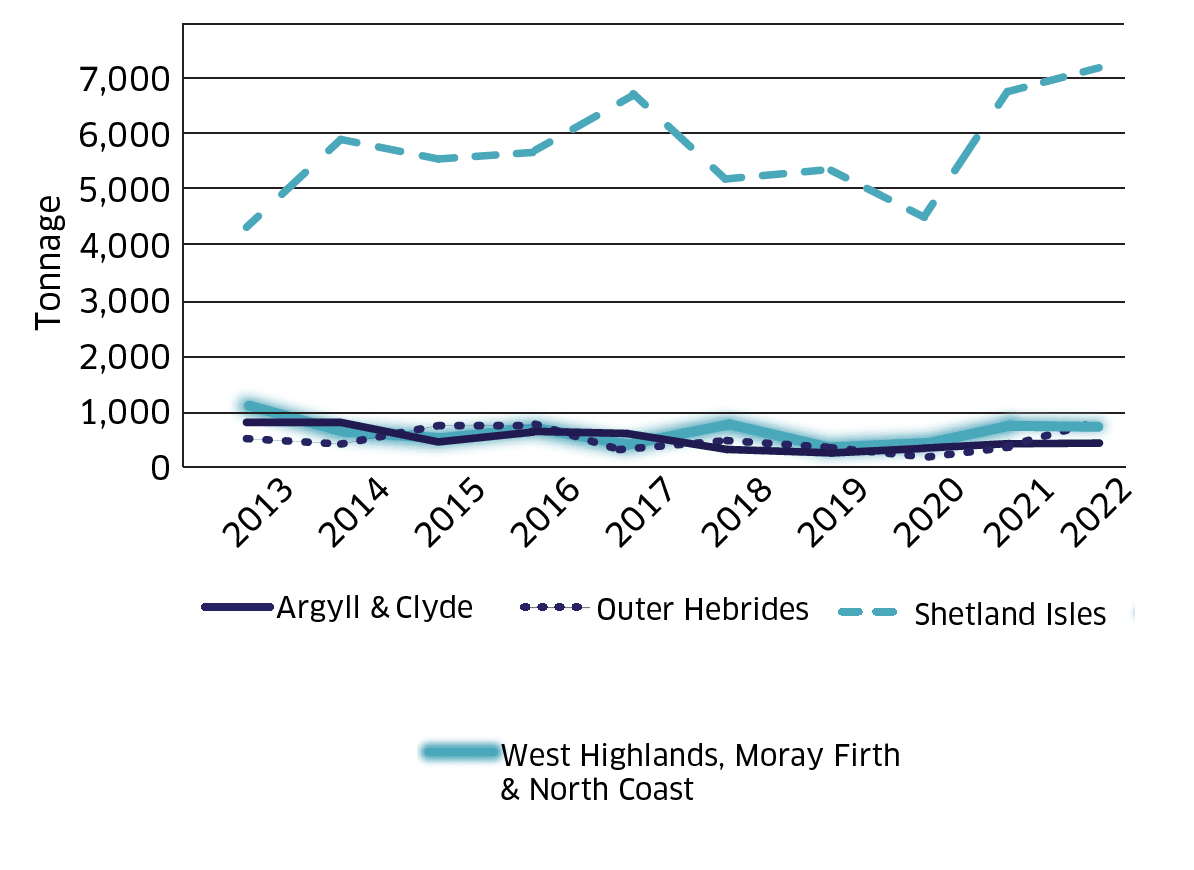
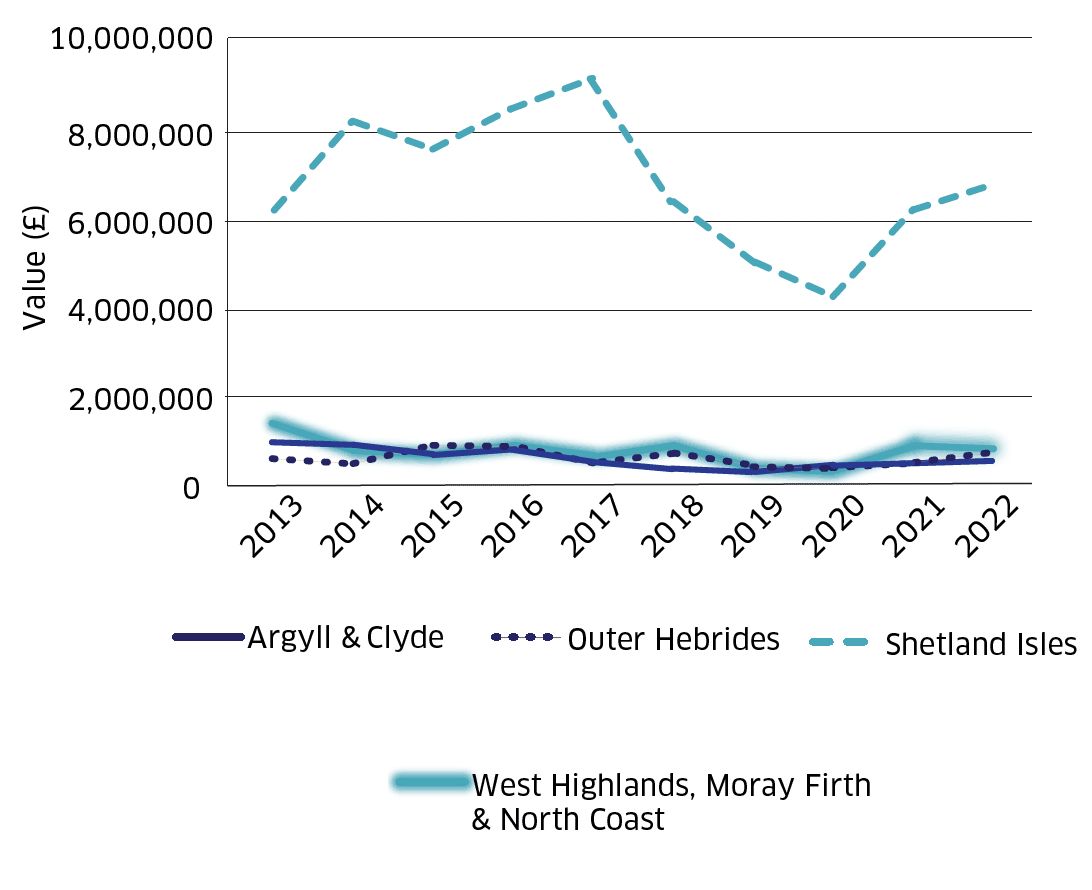
| Argyll & Clyde | 770 | 1,098,790 | 755 | 1,055,490 | 491 | 688,873 | 615 | 914,505 | 631 | 866,994 | 442 | 554,268 | 363 | 361,548 | 425 | 399,925 | 497 | 452,270 | 501 | 475,950 |
| Outer Hebrides | 528 | 753,456 | 411 | 574,578 | 718 | 1,007,354 | 727 | 1,081,049 | 396 | 544,104 | 555 | 695,970 | 544 | 541,824 | 282 | 265,362 | 389 | 353,990 | 720 | 684,000 |
| Shetland Isles | 4,337 | 6,188,899 | 5,919 | 8,274,762 | 5,565 | 7,807,695 | 5,686 | 8,455,082 | 6,647 | 9,132,978 | 5,160 | 6,470,640 | 5,324 | 5,302,704 | 4,427 | 4,165,807 | 6,850 | 6,233,500 | 7,164 | 6,805,800 |
| West Highlands, Moray Firth & North Coast | 1,122 | 1,601,094 | 598 | 836,004 | 496 | 695,888 | 704 | 1,046,848 | 558 | 766,692 | 717 | 899,118 | 468 | 466,128 | 527 | 495,907 | 854 | 777,140 | 707 | 671,650 |
| Total | 6,757 | 9,642,239 | 7,683 | 10,740,834 | 7,270 | 10,199,810 | 7,732 | 11,497,484 | 8,232 | 11,310,768 | 6,874 | 8,619,996 | 6,699 | 6,672,204 | 5,661 | 5,327,001 | 8,590 | 7,816,900 | 9,092 | 8,637,400 |
Footnote – Figures for Argyll & Clyde and the West Highlands, Moray Firth & the North Coast have been merged due to commercial confidentiality. Average prices (real) have been adjusted for inflation based on 2022 price estimates.
| 2013 | 2014 | 2015 | 2016 | 2017 | 2018 | 2019 | 2020 | 2021 | 2022 | |||||||||||
|---|---|---|---|---|---|---|---|---|---|---|---|---|---|---|---|---|---|---|---|---|
| Scottish Marine Region | No. of Shells (000s) |
Value £ | No. of Shells (000s) |
Value £ | No. of Shells (000s) |
Value £ | No. of Shells (000s) |
Value £ | No. of Shells (000s) |
Value £ | No. of Shells (000s) |
Value £ | No. of Shells (000s) |
Value £ | No. of Shells (000s) |
Value £ | No. of Shells (000s) |
Value £ | No. of Shells (000s) |
Value £ |
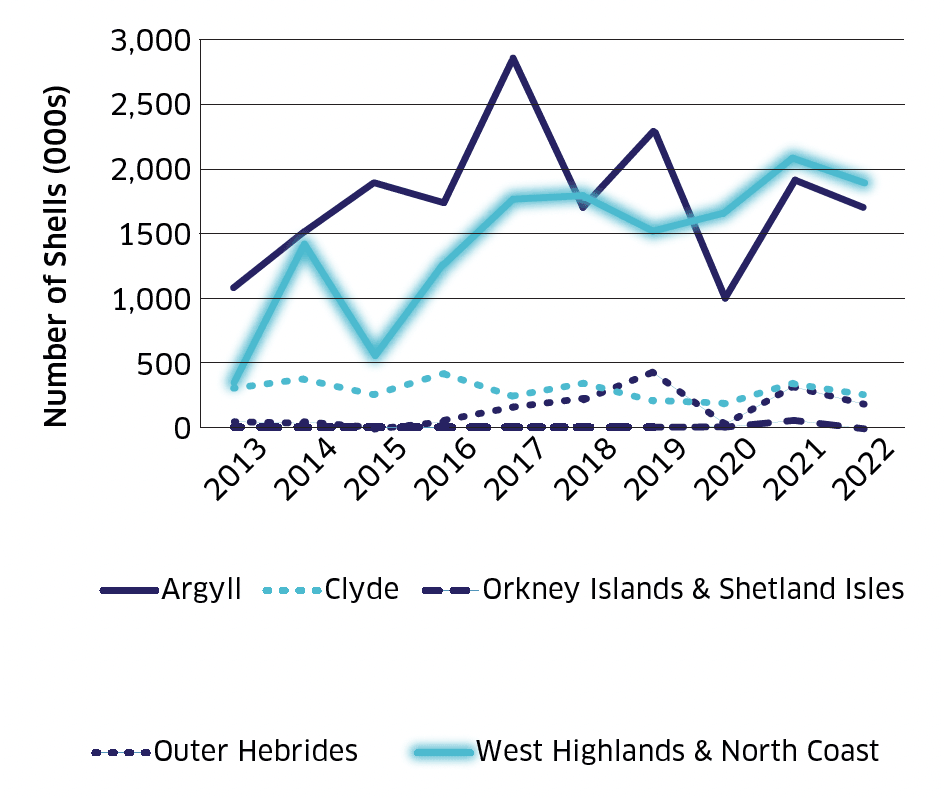
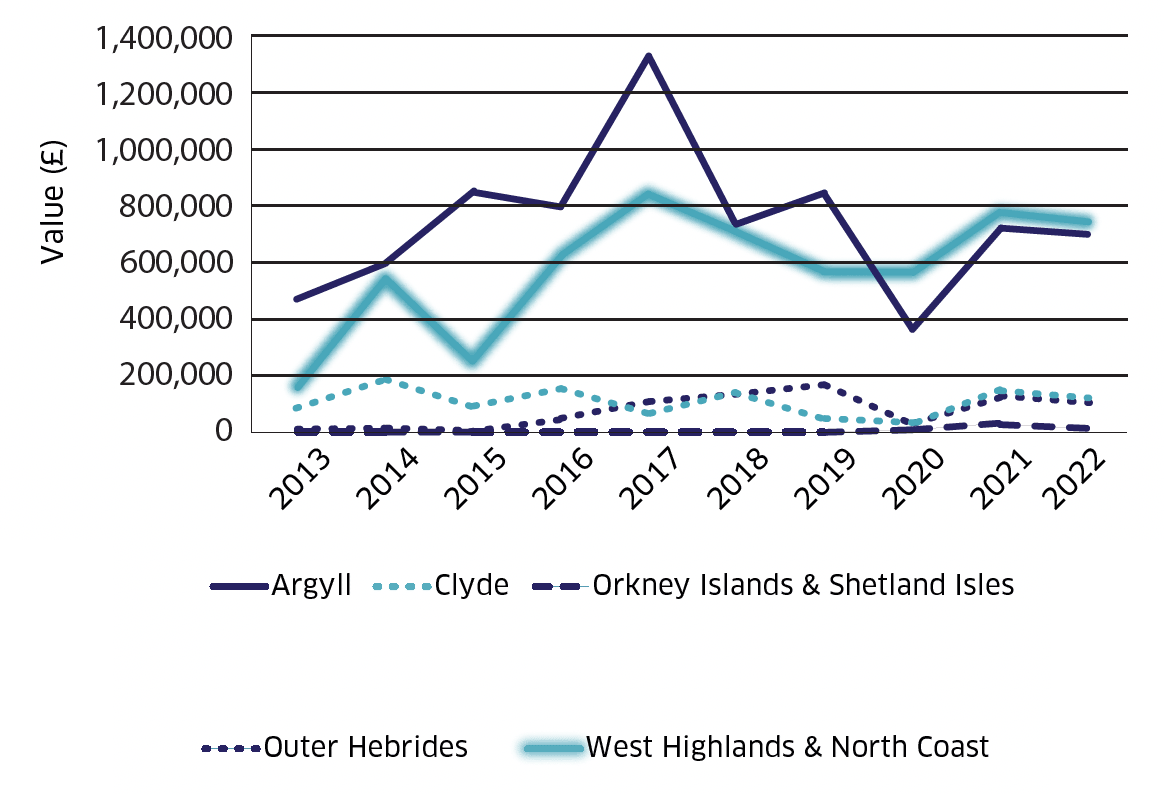
| Argyll | 1,172 | 457,080 | 1,549 | 588,620 | 1,884 | 847,800 | 1,774 | 798,300 | 2,857 | 1,285,650 | 1,672 | 685,520 | 2,274 | 841,380 | 1,002 | 350,700 | 1,929 | 713,730 | 1,639 | 671,990 |
| Clyde | 331 | 129,090 | 404 | 153,520 | 249 | 112,050 | 369 | 166,050 | 229 | 103,050 | 304 | 124,640 | 162 | 59,940 | 140 | 49,000 | 416 | 153,920 | 341 | 139,810 |
| Orkney Islands & Shetland Isles | 0 | 0 | 0 | 0 | 0 | 0 | 0 | 0 | 0 | 0 | 0 | 0 | 0 | 0 | 2 | 700 | 28 | 10,360 | 4 | 1,640 |
| Outer Hebrides | 19 | 7,410 | 26 | 9,880 | 4 | 1,800 | 70 | 31,500 | 149 | 67,050 | 268 | 109,880 | 411 | 152,070 | 85 | 29,750 | 383 | 141,710 | 286 | 117,260 |
| West Highlands & North Coast | 369 | 143,910 | 1,413 | 536,940 | 556 | 250,200 | 1,321 | 594,450 | 1,799 | 809,550 | 1,787 | 732,670 | 1,546 | 572,020 | 1,634 | 571,900 | 2,097 | 775,890 | 1,817 | 744,970 |
| Total | 1,891 | 737,490 | 3,392 | 1,288,960 | 2,693 | 1,211,850 | 3,534 | 1,590,300 | 5,034 | 2,265,300 | 4,031 | 1,652,710 | 4,393 | 1,625,410 | 2,863 | 1,002,050 | 4,853 | 1,795,610 | 4,087 | 1,675,670 |
Footnote – Figures for West Highlands & the North Coast and Orkney Islands & Shetland Isles, have been merged due to commercial confidentiality. Average prices (real) have been adjusted for inflation based on 2022 price estimates.
| 2013 | 2014 | 2015 | 2016 | 2017 | 2018 | 2019 | 2020 | 2021 | 2022 | |||||||||||
|---|---|---|---|---|---|---|---|---|---|---|---|---|---|---|---|---|---|---|---|---|
| Scottish Marine Region | No. of Shells (000s) |
Value £ | No. of Shells (000s) |
Value £ | No. of Shells (000s) |
Value £ | No. of Shells (000s) |
Value £ | No. of Shells (000s) |
Value £ | No. of Shells (000s) |
Value £ | No. of Shells (000s) |
Value £ | No. of Shells (000s) |
Value £ | No. of Shells (000s) |
Value £ | No. of Shells (000s) |
Value £ |
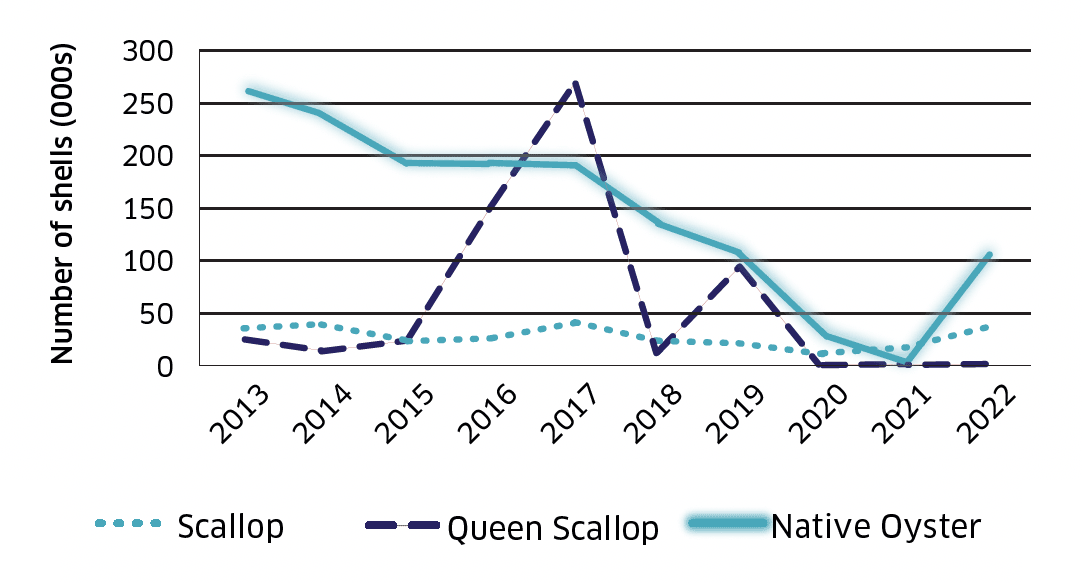
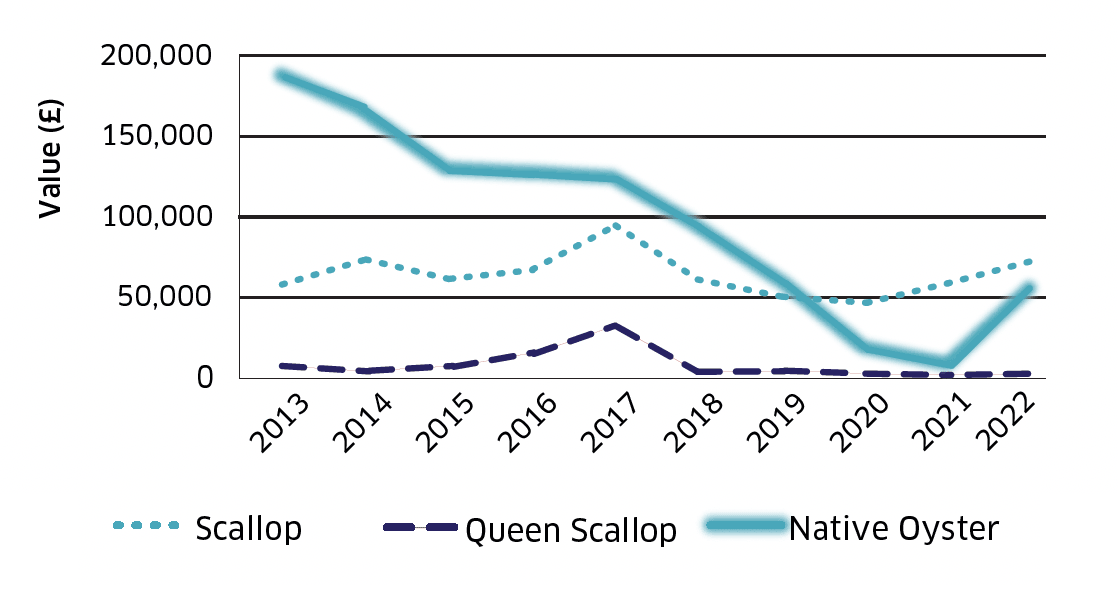
| Native Oysters | 260 | 184,600 | 242 | 169,400 | 200 | 138,000 | 201 | 138,690 | 200 | 134,000 | 142 | 93,720 | 103 | 66,950 | 35 | 22,050 | 8 | 4,800 | 109 | 54,500 |
| Queen Scallops | 33 | 5,940 | 18 | 3,060 | 33 | 4,290 | 155 | 21,700 | 273 | 35,490 | 18 | 2,520 | 18 | 2,520 | 0.5 | 70 | 0.5 | 65 | 0.6 | 78 |
| Scallops | 40 | 61,200 | 48 | 72,000 | 30 | 65,400 | 35 | 81,200 | 47 | 96,820 | 31 | 62,620 | 26 | 51,740 | 19 | 46,550 | 27 | 61,830 | 39 | 69,810 |
| All Scotland | 333 | 251,740 | 308 | 244,460 | 263 | 207,690 | 391 | 241,590 | 520 | 266,310 | 191 | 158,860 | 147 | 121,210 | 95 | 68,670 | 36 | 66,695 | 149 | 124,388 |
Footnote – Other shellfish species including native oyster (Argyll & Solway), queen scallop (Clyde & West Highlands) and scallop (Argyll & West Highlands) were also produced however these figures cannot be attributed to Scottish Marine Regions due to commercial confidentiality. Average prices (real) have been adjusted for inflation based on 2022 price estimates.
Contact
Email: Lorna.Munro@gov.scot