The Scottish Shelf Model. Part 1: Shelf-Wide Domain
Part 1 of the hydrodynamic model developed for Scottish waters.
3 Hydrodynamic Model Development
3.1 Introduction
This section of the report describes the setting up of the SSW model mesh, bathymetry and the calibration of the flow model.
3.2 SSW flow model setup
The model mesh developed for the SSW model was created using the SMS mesh generator. The horizontal coordinate system used is latitude and longitude with a vertical datum of mean sea level.
The SMS mesh generator requires coastline and boundary data to define the extent of the active and inactive mesh. Additional information is provided regarding the resolution required in user-specified domains. The resolution is based upon modelling experience, bathymetry gradient/resolution, geographical features and requirements for the study. Although the mesh generator is able to create meshes with triangular or quadrilateral elements, FVCOM requires only triangular elements.
Mesh generation is an iterative process in order to get a mesh that varies smoothly (for both area change between connected triangles, and for the bathymetry), with triangles that do not have angles that are too acute (less than 30 °, which is the FVCOM recommended setting), and finest resolution that does not require an overly small model timestep. Generally, resolution is much larger away from areas of interest (Scottish Waters) in order to limit the grid size and hence overall model run times. Other mesh quality control checks can be done e.g. each model node must not be connected to more than 8 adjacent elements and at coastal nodes where river discharge is specified, the node must not be part of an element where all three nodes are on land. Additionally, for estuaries and inlets, there must be more than one triangle between the land sides of the estuary. These last two corrections are needed because FVCOM forms "ponds" where the grid has these features. Mesh refinement is at best a semi-automatic process, requiring the application of modelling knowledge and judgement. Examples of these three issues are shown in Figure 3-1, 3-2 and 3-3.


The first mesh generated for the whole of Scottish Shelf Waters is shown in Figure 3-4. This shows the variable resolution employed in the mesh. The resolution varies from 10km offshore to 1km at the coast. This mesh was set up on a quasi-rectangular area, defined by latitude and longitude limits, for simplicity. The coastline and the polylines used to define areas with different resolutions can be seen in Figure 3-5. Further iterations were carried out to accommodate appropriate resolution in the areas of higher resolution.
The mesh file produced by the SMS mesh generator is in an ASCII format that is easily converted into a format that can be used by FVCOM. This was done by using a piece of Matlab code to read and write the data into the necessary format.
Two coastline data sets have been obtained for use in this study, the Global Self-consistent, Hierarchical, High-resolution Shoreline ( GSHHS) distributed by National Geophysical Data Centre ( NGDC) in the US, and Ordnance Survey Mapping. These are discussed and attributed in Section 2.2.1.


A second model mesh (Figure 3-6) was generated by moving the open boundary to the shelf edge (~200m depth) to avoid issues with resolution of the steep shelf edge topography (which causes topographic Rossby waves, particularly at diurnal tidal frequencies). The coastline and the open boundary polyline used to define this area can be seen in Figure 3-7. The coastline of the rest of the UK and Ireland was included at ~1km resolution using an earlier dataset from MGGD (now superseded by GSHHS). The bathymetry data are then interpolated onto the element nodes.
As can be seen from Figure 3-6, the western model boundary was relatively close to the coast of Ireland. Model stability issues were experienced with this model, due to reflections off the Irish coast and the nearby clamped model open boundary. As FVCOM does not support a radiative boundary condition (which might have resolved this issue), the model mesh was changed slightly to increase the distance between the boundary and Irish coast (Figure 3-8). (On further discussion within the FVCOM user community, another potential solution is to generate a sub-nest forced by elevation and currents). A final model mesh (Figure 3-9) was required by the more limited geographical coverage of the available meteorological forcing data.
Some improved coastal resolution has also been introduced in some areas in order to ensure proper resolution of inlets and straits, and to improve model stability when running with river freshwater inputs. It is necessary to ensure sufficient water depth in the elements in which the freshwater is introduced and also that the element is not connected to 2 closed boundary sides.
The vertical model resolution was initially selected to be 10 sigma-levels as this was found previously to be adequate resolution for shelf seas. Further examination of the vertical resolution was done during calibration of the baroclinic model.


3.2.2 Model bathymetry
The NOOS bathymetry (as used in the NOC-L HRCS model) was used for the first stage of SSW model development. For the tidal calibration stage the EMODnet data were used.
3.2.3 Boundary data
The tidal boundary was initially forced with 15 tidal constituents from the NOC-L HRCS tidal model, using tidal elevation only. However after the model was extended, the TPXO7.2 global tidal inversion data were used to force the open boundary.
For the baroclinic model run, the boundary was also forced with daily temperature and salinity profiles from the NOC-L AMM model. River data was included at the coastal boundary, using the CEH G2G model output. These data give instantaneous flow rates (m 3/sec) for each river at 15 minute intervals. The data do not provide temperature, which has been taken as a constant 10 °C. Because of large file sizes (and related processing time issues), this 15 minute data were averaged to produce a daily flow rate which was used in the FVCOM model runs.
The river input locations are shown in Figure 3-10, which also shows the maximum discharge for each river. Figure 3-11 shows the location of the top ten rivers by discharge with their average daily mean discharge.
3.2.4 Meteorological forcing data
The met forcing data was retrieved for 2009. Further access to the Met Office Unified Model data was acquired via BADC. The meteorological forcings available for FVCOM include the surface wind stress, sea level pressure, heat flux and precipitation/evaporation (see chapter 5 of FVCOM User Manual). The net surface heat flux consists of four components: net downward shortwave radiation, net downward longwave radiation, sensible, and latent fluxes. Two options exist for applying the heat flux: (i) providing the heat flux directly from the atmospheric model (ii) calculating the heat flux within FVCOM, given various atmospheric model outputs. The following fields were extracted from the UKMO UM via BADC, in addition to the wind, pressure, air temperature and precipitation data already available for the AMM model:


01201 - net downward surface SW flux
02201 - net downward surface LW flux
03217 - surface (sensible) heat flux
03234 - surface latent heat flux
01235 - total downward surface SW flux
02207 - downward LW rad flux: surface
03245 - relative humidity at 1.5m
00024 - surface temperature
16222 - pressure at mean sea level ( Pa)
Evaporation ( E ms -1) was calculated using the following procedure:
(a) Calculate saturated water vapour pressure, E W (mb) at given air temperature, T (deg C), see Gill (1982, p 30, 606)

(b) Calculate actual water vapour pressure E A using relative humidity, h R

(c) Calculate saturated and actual specific humidity ( Q W, Q A), using M r (ratio of molecular weight of water to air = 0.622) and sea level pressure, P a

(d) Calculate evaporation, using wind-speed ( W S ms -1) and Dalton number ( C E=0.0015)

3.3 Flow model calibration
Model validation and calibration refers to the process of comparing the model output with observations in a systematic way. Validation is just this comparison, which should be based on quantitative metrics, and then making a judgement about whether the model results are sufficiently good, with respect to some objective criteria. Calibration is the process of tuning the model, based on model options, optimising the selection of certain more-or-less unknown parameters and improving the mesh and bathymetry. There may also be some selection to be made between different forcing datasets. It is to be expected that tidal currents and elevation, and sea surface temperature can be well modelled, whereas residual current speed and salinity may have RMS errors similar to the standard deviation of the data (Holt et al., 2005). Issues of modelling and validation of the residual currents and salinity comparison are related both to the model forcing ( e.g. river input) and the mixing/turbulence formulation and also the accuracy of the observations.
For the tidal model the model was run by generating time series of open boundary forcing using the T_TIDE (tidal analysis and prediction) Matlab software (Pawlowicz et al., 2002), as there was found to be a problem in using the harmonic forcing with tidal constituent amplitude and phase specified at the boundary. Further investigation is required to clarify the time origin for the model tides (when spectral forcing is used) as there appear to be phase errors with standard assumptions. The model was run for selected periods from a few days to a month then the elevation and current time series output at selected points were analysed using the T_TIDE software.
Comparisons with observed data were carried out by both statistical means and the use of expert judgement. We followed the guidelines for model calibration laid out in the document "Quality Control Manual for Computational Estuarine modelling, Technical Report W168, section A.4.2.1" produced by the Environment Agency of England and Wales. This document suggests the calibration limits in the Table 3-1 below for coastal waters:
Table 3‑1 Calibration limits for coastal waters
| Parameter |
Suggested limits (in absolute values) |
Alternative limits (in terms of percentages) |
|---|---|---|
| Water Levels |
Within 0.1m |
Within 10% of spring tide ranges and 15% of neap tide ranges Condition to be satisfied 90% of time. |
| Current speeds |
Within 0.1m/s |
Within 10 to 20% |
| Current directions |
Within 10 deg |
|
| Timing of high water |
Within ± 15 mins |
|
| Temperature |
Within ± 0.5 deg C |
|
| Salinity |
Within 1 psu |
|
A set of statistics ( e.g. mean error/bias, RMS error) are commonly used to compare model results with observations for tidal elevation, currents, temperature and salinity.
3.3.1 Tidal calibration
A set of points has been extracted by Eric Jones at NOC-L for previous projects, for the whole UK shelf, at which tidal constituents (typically M 2, S 2, O 1 and K 1) have been derived from tide gauges and bottom pressure recorders (236 locations in Scottish Waters), a subset of which has been used for the tidal range calibration. Another data set has similarly been put together for the tidal ellipse parameters from current meter deployments where a tidal analysis has been performed (390 locations in Scottish Waters, see Davies and Kwong, 2000). A subset of these has been used for the tidal current calibration. A subset of 27 stations was selected for the elevation points, to include coastal tide gauges (especially A-class gauges) and offshore pressure gauges. Similarly a subset of 24 current meter locations was selected, to represent each different sea area around Scotland.
First results for the M 2 tidal elevation amplitude can be seen in Figure 3-12, which shows that the main tidal amphidromes are in approximately the correct locations (see Howarth, 1990). A selected subset of coastal tide gauges was used for a first look at the M 2 quantitative tidal validation, see Table 3-2. In general this showed some model skill but an underestimate of the tidal amplitude.

Table 3‑2 M 2 tidal amplitude, first validation at Class A tide gauges
| Class A Tide Gauges - data from Full Shelf Model Run | |||||||
|---|---|---|---|---|---|---|---|
| Location | Observed | Model | Difference | ||||
| Lat. (deg N) | Lon. (deg E) | M 2 Amp. (m) | Lat. (deg N) | Lon. (deg E) | M 2 Amp. (m) | ||
| Aberdeen | 57.15 | -2.08 | 1.30 | 57.17 | -2.02 | 1.16 | -10.9% |
| Lerwick | 60.15 | -1.14 | 0.58 | 60.12 | -1.14 | 0.53 | -8.3% |
| Tobermory | 56.62 | -6.06 | 1.30 | 56.67 | -6.26 | 1.31 | 1.0% |
| Stornoway | 58.21 | -6.39 | 1.39 | 58.15 | -6.33 | 1.34 | -3.3% |
| Kinlochbervie | 58.46 | -5.05 | 1.43 | 58.46 | -5.16 | 1.33 | -7.5% |
| Wick | 58.44 | -3.09 | 1.02 | 58.43 | -3.03 | 0.96 | -5.3% |
| Ullapool | 57.90 | -5.16 | 1.50 | 57.97 | -5.36 | 1.44 | -3.9% |
The following procedure was followed to validate the model:
- Check locations of M 2 amphidromes against (i) HRCS cotidal chart (Figure 3-13) and (ii) John Howarth's cotidal chart from observations (Howarth, 1990).
- Check hourly plots of surface elevations and currents through the tidal cycle using the Visit software. Are there any areas of spurious currents and elevations? Especially focus on the 4 sub-areas. An example of a snapshot of the Pentland Firth at maximum ebb tide is shown in Figure 3-14, showing currents of up to 2.6ms-1.
- Compare elevation and current time series (E and N components) from selected locations. Check for systematic amplitude and phase errors.
- Check tidal analysis for water surface elevations for selected locations, starting with M2, then S2, O1 and K1 tidal harmonics
- Compare tidal analysis for selected current meter locations, using mid-depth current meters compared to depth-averaged model currents.


The acceptance criteria in Table 3-1 may be approximated, since the main part of the variance is due to the dominant lunar semi-diurnal tide, M 2, thus we required the elevation error for M 2 to be <10% amplitude, <10° phase (a timing error of 15mins corresponds to about 7.5° phase error). Other constituents were required to be <20%, <20°. For currents the semi-major axis <10%, orientation within +/- 10°, phase error <10°, eccentricity within 10% for M 2 was used as a guide.
For the calibration/tuning of the model various statistics of the model goodness of fit were examined, such as bias, RMS error and the scatter index ( RMS error divided by mean observed value). It is important to ensure that the errors are not dominated by large errors in quantities of smaller magnitude. The correlation between 2 time series was also used as a model metric.
A variable, K, was designed for the quick intercomparison of different model versions based on Davies and Kwong (2000), where:

It is a measure of the "goodness of fit" for an individual point where model and observed values are being compared.
K represents a measure of the average model error for a given tidal constituent, averaging over all the k points at which model and observations have been compared; the subscript m indicates the model value and o indicates the observed value, h is amplitude and g is phase of the tidal elevation. The values hcos g and hsin g are used to provide smooth functions combining amplitude and phase information. A similar metric was used to calculate the average error for the semi-major axis of the tidal current i.e. using the amplitude and phase of the tidal constituent of the current resolved along the semi-major axis of the current ellipse. Ideally the procedure is to minimise all the error metrics. Various attributes of the model were adjusted as described in the following sections. Initially a 15-day run (a single spring-neap cycle) using the default model settings was run. Then some 5-day (and some shorter 1.5-day) M 2-only runs were used to quickly test various model configurations. Finally a 29-day run (the shortest period allowing for direct separation of the M 2 and S 2 constituents in the harmonic analysis) forced by 8 constituents (M 2, S 2, N 2, K 2, O 1, K 1, P 1 and Q 1) was completed, using the optimum settings.
Figure 3-15 shows the full set of elevation and current meter tidal analyses locations and Figure 3-16 shows the selected stations (27 elevation and 24 current points) used in the calibration.


3.3.2 Open boundary forcing and model extent
Model evolution is discussed in Section 3.2.1. The current model extent is shown in Figure 3-9. The TPXO7.2 tidal forcing was acquired to force the new boundary rather than interpolating the AMM data as it was expected that this would give a better boundary forcing, being derived from altimeter observations.
3.3.3 Mesh optimisation and evolution
As part of mesh optimisation, scripts were written to calculate the CFL timestep for all the triangles in the grid. The CFL condition is a criterion that must be met in order to solve partial differential equations using explicit time integration schemes for finite difference solution of the equations. For example, if a wave is moving across a discrete spatial grid and we want to compute its amplitude at discrete time steps of equal length, then this length must be less than the time for the wave to travel between adjacent grid points. The smallest CFL timestep determines the time step of the entire model.
The CFL timestep was calculated as:

where Δ t is the time step, Δ L shortest edge of an individual triangular grid element, g is the acceleration dues to gravity and D is the local (bathymetry) depth.
From the equation, it can be seen that the overall model timestep is dictated by triangles having short edges in deep water. Since this calculation was performed for all triangle edges, it was possible to identify the triangles with the smallest CFL timestep. These were eliminated by either merging triangles, or by moving nodes, both within SMS.
This optimisation proved to be only partially successful with FVCOM. In fact the model timestep needed to be smaller than that suggested by this CFL calculation.
3.3.4 Coastline and bathymetry
The accuracy of the coastline was checked against chart data and the requirement to ensure that the flow could pass through the main straits and passages. The coastline and bathymetry were adjusted as necessary.
3.3.5 Bottom friction
The model was operated in 3D mode and different values of the bottom friction were selected by means of a constant roughness length applied to the whole model. The drag coefficient C D in the quadratic drag law (which relates the bottom stress to the square of the velocity) is fitted to a logarithmic boundary layer applied in the lowest model level (near-bed layer):

where κ is von Karman's constant (=0.4) and z 1 is half the thickness of the lowest level above the bed. The values of z 0 and C Dmin may be selected. Default values are 0.003m and 0.0025 respectively (see FVCOM Manual, Chen et al., 2011). Using this method the drag coefficient increases almost linearly with the roughness length. The drag coefficient is larger in shallower water since the bottom layer thickness reduces (using sigma-levels) and the bed stress is thus calculated nearer to the bed. Specifying the minimum drag coefficient prevents it becoming very small in deeper water. We increased the roughness length to 0.01m and the minimum drag coefficient to 0.005. Further increase of the bottom friction did not produce a stable solution.
3.3.6 Horizontal viscosity
Tests were carried out with double and half the default value of horizontal eddy viscosity, using the Smagorinsky formulation (which is grid-size-dependent) as well as a uniform constant value (see FVCOM Manual, Chen et al., 2011). These tests were only made with a short M 2 run and the results were rather puzzling. Longer runs of the M 2 tide or the full tidal model are needed to resolve this.
3.3.7 Summary of tidal calibration
Tables 3-3 and 3-4 show the values of K along with mean bias, RMS error and the percentage of data points reaching the acceptance criteria, for various model configurations. The different statistics produced sometimes conflicting results in terms of the model improvement. The baseline K-values were different for different lengths of run, thus it was not always possible to compare like with like.
For the elevation results, in Table 3-3, the 29-day run with 8 tidal constituents was slightly less accurate, according to the K-value, with the same model settings, than the M 2-only run. The 15-day run should be nearly equivalent to a baseline 29-day run. However, due to the different method of separation of M 2 and S 2 it is not clear that the runs are equivalent and a 29-day baseline run was carried out.
Increasing the bottom friction in the M 2-only run reduced the K-value and the mean amplitude bias and improved the number of points satisfying the acceptance criteria for the M 2 phase. However it reduced the number of acceptable points for the M 2 amplitude.
Changing the horizontal viscosity was difficult to interpret as these runs were only carried out for short periods and there was no comparable baseline run. The amplitude and phase biases were very small and negligible errors were seen with different settings.
The current results, Table 3-4, were more sensitive to the enhanced friction than the water elevations. All the metrics were improved, except the RMS phase error, by increasing friction.
From the tests run the optimised model settings were selected to be an enhanced bed roughness and the default horizontal viscosity (see Tables 3-3 and 3-4). A further adjustment of the bottom friction in different sea areas may be advisable ( e.g. Baston and Harris, 2011). In fact the acceptance criteria were not met for all the selected comparison points. For the final 29-day analysis only 70% of the points were acceptable for M 2 amplitude and 85% for M 2 phase. This shows that the parameter set that gives the minimum K value and reduced amplitude bias also gives the lowest % acceptable points (where amplitude error is < 10%). The better performance in phase may offset the worse amplitude performance to produce a lower K value. If correct prediction of tidal range is more important than phase, this set of parameters may not be optimal. Also the results may be dominated by an outlier (see below). The K metric may be more effective for assessing a much larger number of points, as outliers will be less likely to dominate the results.
Table 3‑3 Statistics for M2 component of surface elevation
| Run | Bottom Friction | Horizontal mixing | K (cm) |
% Points with amplitude < 10% |
Mean amplitude bias (cm) |
RMS amp error (cm) |
% Points with Phase Diff < 10° |
Mean phase bias (deg) |
RMS phase error (deg) |
||||
|---|---|---|---|---|---|---|---|---|---|---|---|---|---|
| Type | Min C D | z 0 (m) | Type | Kind | Coefficient | ||||||||
| 15-day, 8 tidal constits, default settings | 3D | 0.0025 | 0.003 | 'closure' | 'constant' | 0.2 | 12.2 | 81 | 5.3 | 7.5 | 85 | -1 | 6 |
| 5-day M 2 only, default settings | 3D | 0.0025 | 0.003 | 'closure' | 'constant' | 0.2 | 13.8 | 81 | 5.2 | 8.3 | 78 | -1 | 7 |
| 5-day M 2 only, increased friction | 3D | 0.005 | 0.01 | 'closure' | 'constant' | 0.2 | 13.5 | 74 | 2.6 | 9.0 | 81 | -1 | 7 |
| 1.5 day M 2 only reduced horiz viscos | 3D | 0.0025 | 0.003 | 'closure' | 'constant' | 0.1 | 16.2 | 78 | -1.0 | 8.2 | 70 | -1 | 9 |
| 1.5 day M 2 only increased horiz viscos | 3D | 0.0025 | 0.003 | 'closure' | 'constant' | 0.4 | 16.1 | 78 | -0.8 | 8.3 | 74 | -1 | 9 |
| 1.5 day M 2 only constant horiz viscos | 3D | 0.0025 | 0.003 | 'constant' | 'constant' | 0.001 m 2s -1 | 16.2 | 78 | 1.0 | 8.2 | 70 | -1 | 9 |
| 29-day 8 tidal constits, optimised settings | 3D | 0.005 | 0.01 | 'closure' | 'constant' | 0.2 | 13.8 | 70 | 5.2 | 9.8 | 85 | -0.3 | 7 |
Table 3‑4 Statistics for M 2 component of semi-major axis of depth-averaged current
| Run | Bottom Friction | Horizontal mixing | K (cm/s) |
Mean bias (cm/s) |
RMS error (cm/s) |
Mean bias (deg) |
RMS error (deg) |
||||
|---|---|---|---|---|---|---|---|---|---|---|---|
| Type | Min C D | z 0 (m) | Type | Kind | Coefficient | ||||||
| 15-day, 8 tidal constits, default settings | 3D | 0.0025 | 0.003 | 'closure' | 'constant'' | 0.2 | 12.7 | 10.9 | 20.0 | 2 | 11 |
| 5-day M 2 only, default settings | 3D | 0.0025 | 0.003 | 'closure' | 'constant'' | 0.2 | 10.5 | 6.6 | 16.4 | 2 | 11 |
| 5-day M 2 only, increased friction | 3D | 0.005 | 0.01 | 'closure' | 'constant' | 0.2 | 9.7 | 4.9 | 14.9 | 2 | 11 |
| 29-day 8 tidal constits, optimised settings | 3D | 0.005 | 0.01 | 'closure' | 'constant' | 0.2 | 9.9 | 5.7 | 15.4 | 2 | 11 |
Further investigation regarding the distribution of errors is shown in Figures 3-17 to 3-22. Figure 3-17 shows scatter plots of M 2 amplitude and phase for model versus observations both for elevations and currents, for the 29-day run with increased bottom friction. It can be seen that the elevation phase is very good, but there is more scatter in the tidal amplitude. The outlier in the semi-major axis amplitude is in the North Channel of the Irish Sea. Figures 3-18, 3-19 and 3-20 show M 2 tidal ellipses (hodographs) comparing the model and observations for 3 different areas: NE Scotland, the shelf edge and W Scotland respectively. Qualitatively there is good agreement of the ellipses overall, with the model getting the sense of rotation right in every case. The amplitude, orientation and eccentricity are generally similar, with some exceptions. Figure 3-21 and 3-22 shows the relative error in M 2 elevations as a % error in amplitude and absolute phase error, respectively, plotted as a spatial map. This shows an unacceptable overestimate of the amplitude (>10%) at 2 coastal locations in the western isles and one offshore location east of the Pentland Firth (station Offshore 8). The tide is underestimated by up to 10% in the North Channel but this is close to a tidal amphidrome. The phase is generally very good except in this same area where the phase changes very rapidly. It may be advisable to select some alternative points rather than including this area, which may be too heavily represented in the limited set of data points.


The results for the average amplitude and phase error for the S 2, O 1 and K 1 tidal elevations are given in Table 3-5, for the final 29-day run. S 2 and O 1 are both underestimated, with a delay in the phase. This may indicate a need to reduce the friction slightly as the extra constituents will tend to enhance the currents and hence the (quadratic) friction acting on the M 2 tide and other constituents. However K 1 is very much overestimated.
Table 3‑5 Amplitude and phase errors for S2, O1 and K1 tides from 29-day optimised run
| Tidal constituent | Mean Amplitude error | Mean absolute phase error |
|---|---|---|
| S2 | -18% | 10° |
| O1 | -19% | 19° |
| K1 | +55% | 8° |
Water levels and current time series were examined at some of the selected observation locations, from the 29-day run and during a storm period in the met-forcing run (March-June 2009), when the peak wind-stress was observed on 28 March 2009. In Figures 3-23 and 3-24 the water levels at Aberdeen and Stornoway from FVCOM were compared with the tide gauge observations. Figure 3-23 shows total water level while 3-24 shows tidal residuals ( i.e. meteorologically-driven storm surge. The maximum surge can be seen to be in good agreement with observations at Stornoway.
The key conclusions from the tidal calibration are as follows:
- The model results have been compared with the established HRCS model M 2 co-tidal chart, and also with M 2 tidal analyses from observational data at several locations.
- The tidal phase is generally very good, with poorer results for the amplitude of the tidal water level, however we have not met the calibration targets in Table 3-1. It may be that the subset of data points may be dominated by some locations where the data is less reliable, too close to shore or to a tidal amphidrome.
- It may be possible to adjust the bottom friction spatially to get a slightly better result.


3.3.8 Temperature and salinity calibration
The SSW model was run for 4 months for March-June 2009 as a calibration period using the meteorological and river forcing. March 2009 was the spin-up period, when the sea should still be well-mixed before the onset of seasonal stratification. In order to limit the length of the spin-up period (which can be several years from a constant temperature and salinity), the AMM fields of temperature and salinity for the 1 st March 2009 were used as an initial condition. The temperature and salinity from AMM were also used through the model run, as a nudging correction to the open boundary values. Two options were used for the turbulent closure: (i) Mellor-Yamada 2.5 (the default, MY) and (ii) the Generalised Ocean Turbulence Model ( GOTM, www.gotm.net; Umlauf and Burchard, 2003). Two options were tested for the number of vertical levels, viz. 10 and 20 levels. These combinations are denominated MY10, MY20, GOTM10 and GOTM20.
The first attempt was made using the HEATING_ON option in FVCOM (see section 3.2.5, option (i)) however in this case the SST was found to drift substantially away from the values seen in AMM, overheating the sea surface. It was thought to be necessary to modify the FVCOM code in this case, in order to introduce the Haney correction (Gill, 1982), adjusting the model to a prescribed SST to be consistent with the atmospheric model, however this option was not attempted. Instead the HEATING_CALCULATED option (section 3.2.5 (ii)) was selected. This uses a modified COARE2.6 algorithm (see FVCOM manual). This option appeared to give a better result for SST without a significant drift. The results for the SST at monthly intervals are shown in Figure 3-25, in which the temperature can be seen to increase from March to June, from about 8C to 16C in the central North Sea, for the default MY10 option.
Figure 3-26 shows the stratification which has developed by June in the FVCOM model compared to that in the AMM model, expressed as the surface minus bottom temperature. The models appear to have a similar degree of stratification, with the tidal mixing fronts, between the well-mixed and stratified water, in similar locations.
In Figure 3-27 the difference between the SST for the FVCOM model minus that for the AMM model is shown, together with a set of 6 selected stations, which were used for comparison of the depth-averaged temperature evolution (Figure 3-28) and temperature and salinity profiles for June 2009 (Figure 3-29 and Figure 3-30) in the 2 models.
The temporal evolution of the temperature (Figure 3-28) is quite similar in FVCOM and AMM, except for points 1 and 4 where the temperature in FVCOM increases rather too much. Point 4 is in the Atlantic in deep water off the shelf, whereas point 1 is in the central North Sea. In Figure 3-29 temperature profiles at the 6 stations were examined to better understand the drift. It was found that both the turbulence closure options were rather similar for FVCOM, although MY gave slightly more mixing, both results showed an overestimate of the SST in most cases, with a lack of the surface mixed layer which characterised AMM.
In order to clarify whether AMM or FVCOM is more correct a set of CTD stations were identified during March-June 2009 (Figure 3-31). For 5 selected locations and times the temperature profiles are compared in Figure 3-32.


In this case it is interesting to note that in many cases the FVCOM model is in better agreement with the observations than AMM, which may have a too well-mixed surface layer. There is very little difference between MY and GOTM.
Increasing the vertical resolution to use 20 layers proved to make a great improvement in the surface temperature. Further validation data in the form of AVHRR (Advanced Very High Resolution Radiometer) SST daily composite data were obtained from the NERC Earth Observation Data Acquisition and Analysis Service ( NEODAAS) for the period of March-June 2009 Figures 3-33 and 3-34 show the evolution of the mean and RMS error respectively, comparing the FVCOM MY10, MY20, GOTM20 and AMM datasets. The time series were averaged across the available data for the whole domain (defined to be 54-62N, 12W-9E). Although these data are high precision, the distribution of data is spatially variable due to gaps caused by cloud cover and at some times there is more data coverage than at others.
Comparing the three simulations, it is abundantly clear that having 20 layers gives better results than 10 layers, so the extra computational time needed for the 20 sigma-layer simulations should ideally be provided. This also indicates that the depth resolution of the grid needs to be sufficient for heat to be mixed to deeper waters as the surface temperature is much warmer in the 10 layer model. There is also a slight improvement (0.1-0.2 degrees) using the GOTM turbulence closure scheme.
Comparing the best of the three simulations, namely the 20 sigma-layer GOTM simulation, to the AMM model, there is a very similar mean error. AMM looks better in agreement near the start but diverges as time goes on. This shows that the FVCOM model mean error is more consistent and does not suffer from the drifting error which was found in AMM. The RMS error between both models is fairly indistinguishable.
Overall, the model simulations are too warm near the surface (this is also true in comparison with the AMM model - which has 40 layers) and so prescribing more layers could achieve even better results by allowing heat to percolate more readily through the surface mixed layer. However the computational time would increase further.


3.3.9 Summary
The calibration exercise led to adjustments of horizontal mixing and bottom friction and selection of the heating-calculated option for the baroclinic forcing. A further mesh refinement was also carried out to remove any rogue points. It was found that using 20 levels in the vertical was a big improvement over 10 levels and that the GOTM vertical mixing option performs marginally better than Mellor-Yamada so these options were selected for the rest of the modelling work (see Table 3-3 for friction and horizontal mixing settings for optimised model).
3.4 Full shelf model simulations and validation
3.4.1 Introduction
In order to carry out a validation exercise against observational data for different seasons of the year the final version of the model was run for a 10-month period from May 2008 until March 2009, complete with all tidal, met and river forcing. This was therefore complementary to the calibration run from March 2009 - June 2009 and thus covered the onset and breakdown of seasonal stratification as well as the winter of 2008-2009 with various wind-driven mixing events. During the winter period the largest storms in Scottish Waters were identified in October 2008 (23 rd -24 th) and January 2009 (18 th).
A set of plots and statistics (mean error or bias, RMS error, etc.) was used to compare model results with observations for tidal elevation, currents, temperature and salinity. A simple cost function was used to systematically compare the accuracy of different variables.
3.4.2 Observed Data
Observed data were obtained from BODC, but also other surveys and field campaigns as reviewed in the Data Review report. The area selected was 54-62 N, 12W-9E and less than 200m water depth, for the period June 2008 to June 2009.
We used the 15 standard ports in Scottish Waters for water level comparisons (Figure 3-35). The available current meter observations from BODC for our area and period of interest are shown in Figure 3-36. The CTD stations available from the ICES dataset are likewise shown in Figure 3-37.


3.4.3 Error statistics
The following metrics were used to provide a quantitative measure of the model accuracy:
Mean absolute error ( mae) = 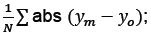 ; where y o refers to observed variable and y m is model, N is number of data points.
Mean bias ( bias) = 
RMS error ( rms) = 
Correlation coefficient ( r) = 
Coefficient of determination ( r 2) = r 2;
Cost function ( CF ) = RMS error divided by the standard deviation of the observations.
3.4.4 Water level
Tidal constituents are available from harmonic analysis for most standard and secondary ports and the NOC in-house tidal prediction software, POLTIPS, has been run for standard ports to generate water level time series from the tidal constituents for any specified time (past or future). The total water level recorded allows us to compare the model for tide plus surge (which may also be affected by rainfall) with POLTIPS in order to estimate the surge component. In order to properly quantify the accuracy of the model surge it is necessary to run the model with tide only for the period of interest and subtract this from the total water level (as done in the UK operational surge model). This has not yet been done so the comparison of surge events with the observed surge residuals is only qualitative. However the surge events identified correspond to those in the archive of the operational surge model ( http://www.ntslf.org/storm-surges/storm-surge-model).
Figures 3-38, 3-39, 3-40 and 3-41 show examples of the water level comparisons, for different months, at Lerwick, Aberdeen, Kinlochbervie and Millport, respectively. In these plots the observed water level at the tide gauge is given (in blue) as well as the model water level (in red) at the nearest wet point, together with the POLTIPS tide-only curve (in green). The first three show summer months of May and June 2008 and the three curves are in close agreement. For the Lerwick plot in May 2008 it can be seen that the model is spinning up for the first couple of days. In Figure 3-41 for Millport in October to November 2008 we can see the effect of the surge on 23-24 October and a negative surge in early November. The model follows the observed water level well, diverging from the tidal prediction.
Table 3-6 shows the overall metrics for 10 of the tide gauge stations, calculated for the full length of the validation run. The individual time series have been corrected for any discrepancies in the datum being removing the long-term mean, hence the bias is zero in each case. The rms error is around 20cm in most cases. The coefficient of determination (correlation squared) is close to or >0.9 in nearly every case. The cost factor is quite low, around 0.2, except for Islay. At Islay there is an issue with the model point drying out for part of the tidal cycle which spoils the correlation and error statistics.
Table 3‑6: Validation metrics for water level
| Metric | Leith | Aberdeen | Wick | Lerwick | Ullapool | Kinlochbervie | Stornoway | Tobermory | Islay | Millport |
|---|---|---|---|---|---|---|---|---|---|---|
| mae | 0.189 | 0.149 | 0.1434 | 0.105 | 0.179 | 0.141 | 0.160 | 0.179 | 0.110 | 0.155 |
| rms | 0.244 | 0.191 | 0.180 | 0.132 | 0.225 | 0.178 | 0.200 | 0.220 | 0.138 | 0.192 |
| r 2 | 0.939 | 0.929 | 0.913 | 0.852 | 0.938 | 0.954 | 0.943 | 0.930 | 0.482 | 0.895 |
| CF | 0.179 | 0.193 | 0.228 | 0.281 | 0.195 | 0.162 | 0.188 | 0.220 | 0.547 | 0.224 |
| bias | 0 | 0 | 0 | 0 | 0 | 0 | 0 | 0 | 0 | 0 |


3.4.5 Currents
Current meters on moorings only record the currents at a few levels, often near-surface, mid-depth and near-bed. They are typically deployed for at least a month which allows a basic harmonic tidal analysis to be carried out.
There are some ADCP data - these give profiles of current through the water column at resolution O(2m) in the vertical. They may be deployed as upward-looking on a bottom mooring or downward-looking from a ship underway. However they were all in deep water off the shelf and not utilised.
There are 18 data series in all, which come from 8 individual moored stations (see Table 3-7), plus 2 underway datasets. Some stations have more than one current meter in the vertical and some have repeat deployments. The instruments have been identified with individual stations (numbered arbitrarily) and T, M or B according to which third of the water column they are in. Most of the instruments were recording current speed, current direction, salinity and temperature but in some cases no salinity record was available and 1039256 had only salinity and temperature but no current data. There are 3 ADCP deployments - the first is a sub-surface mooring, the last 2 are underway data. The moored data end on 18 May 2008, which is still in the spin-up period of the model and therefore discarded. An investigation of the underway ADCP data shows poor agreement in direction. These data are all in the deep Atlantic and not considered further.
For some instruments the logging of good data ended early so they were not available for the validation period (series 896261, 896285). Series 896273 ends on 9 May 2008, again early in model spin-up and is discarded. The remainder of the data (11 data series) were used for model validation for currents.
Figure 3-42 shows the comparison of model and observed currents at two levels at stations 3 and 4 for the month of June 2008.
3.4.6 Temperature and salinity
Temperature and salinity data from CTD stations provide profiles of temperature, conductivity and depth, usually made from a ship station, but possibly also a continuous time series on a mooring. We have used the ICES dataset http://ocean.ices.dk/HydChem/HydChem.aspx?plot=yes.
Figure 3-43 shows a selected subset of CTD stations to represent different sea areas (similar to those selected for Figure 3-32). Figures 3-44 and 3-45 show the temperature and salinity profile comparisons between model and observations for these stations. A further set of stations in the nearshore zone is selected in Figure 3-46, with profiles in Figures 3-47 and 3-48.
Table 3-7: Current meter data May 2008-June 2009
| BODC ref |
Instrument |
Lat |
Lon |
Station |
Water depth |
Meter depth |
Start date |
End date |
Parameters |
Comments |
|---|---|---|---|---|---|---|---|---|---|---|
| 896261 |
Paddle wheel c/m |
60.48 |
-0.14 |
1(T) |
116 |
34 |
08/10/2007 |
09/05/2008 |
Current dirn, speed, S, T Current |
Ended 25/03/2008 |
| 896273 |
Acoustic c/m |
60.48 |
-0.14 |
1(B) |
116 |
109 |
08/10/2007 |
09/05/2008 |
Current dirn, speed, S, T |
Too short |
| 896285 |
Paddle wheel c/m |
60.57 |
-0.63 |
2(T) |
147 |
35 |
08/10/2007 |
09/05/2008 |
Current dirn, speed, S, T |
Ended 25/04/2008 |
| 896304 |
Paddle wheel c/m |
59.47 |
-2.03 |
3(M) |
104 |
36 |
07/05/2008 |
27/09/2008 |
Current dirn, speed, S, T |
Complete, 2 flags for T |
| 896316 |
Paddle wheel c/m |
59.47 |
-2.03 |
3(B) |
104 |
99 |
07/05/2008 |
27/09/2008 |
Current dirn, speed, T |
Complete, no flags |
| 896328 |
Paddle wheel c/m |
59.72 |
-1.69 |
4(M) |
117 |
49 |
07/05/2008 |
27/09/2008 |
Current dirn, speed, S, T |
|
| 896341 |
Acoustic c/m |
59.73 |
-1.69 |
4(B) |
117 |
112 |
07/05/2008 |
27/09/2008 |
Current dirn, speed, T Current dirn, speed, T |
54 flagged gaps |
| 1039244 |
Paddle wheel c/m |
59.47 |
-2.03 |
3(B) |
102 |
89 |
27/09/2008 |
08/05/2009 |
Current dirn, speed, S, T |
Ends 9/02/2009 |
| 1039268 |
Acoustic c/m |
59.72 |
-1.69 |
4(B) |
115 |
102 |
28/09/2008 |
08/05/2009 |
Current dirn, speed, T |
Complete, no flags |
| 1039256 |
Paddle wheel c/m |
59.72 |
-1.69 |
4(M) |
115 |
9 |
28/09/2008 |
08/05/2009 |
S, T only |
Complete, no flags |
| 1039281 |
Paddle wheel c/m |
56.21 |
-5.82 |
5(B) |
28 |
27 |
11/12/2008 |
21/01/2009 |
Current dirn, speed, T |
Complete, no flags |
| 1039293 |
Acoustic c/m |
60.31 |
-0.70 |
6(M) |
94 |
42 |
24/05/2009 |
11/07/2009 |
Current dirn, speed, T |
Complete, no flags |
| 1039312 |
Paddle wheel c/m |
60.31 |
-0.70 |
6(B) |
94 |
85 |
24/05/2009 |
05/10/2009 |
Current dirn, speed, S, T Current dirn, speed, S, T |
Complete, no flags, use June 2009 |
| 1039336 |
Acoustic c/m |
60.17 |
-0.17 |
7(M) |
124 |
42 |
24/05/2009 |
05/10/2009 |
Current dirn, speed, S, T Current dirn, speed, S, T |
Complete, no flags, use June 2009 |
| 1039348 |
Paddle wheel c/m |
60.17 |
-0.17 |
7(B) |
24 |
115 |
24/05/2009 |
05/10/2009 |
Current dirn, speed, S, T Current dirn, speed, S, T |
Complete, no flags, use June 2009 |
| 1014484 |
ADCP moored |
60.25 |
-9.01 |
8 |
1310 |
4 |
02/09/2007 |
18/05/2008 18/05/2008 |
Current dirn, speed, S, T Current dirn, speed, S, T |
Deep Atlantic |
| 1024085 |
ADCP ship-mounted |
57.53 - 57.08 |
-12.44 - -10.78 |
|
2370 |
11-407 |
22/09/2008 |
23/09/2008 |
Current dirn, speed, S, T |
Deep Atlantic, discard |
| 1029286 |
ADCP ship-mounted |
57.53 - 57.08 |
-12.44 - -10.78 |
|
2370 |
17-809 |
22/09/2008 |
23/09/2008 |
Current dirn, speed, S, T |
Deep Atlantic, discard |


