Climate change - Scottish National Adaptation Plan: annual progress report 2024-2025
First annual progress report for the Scottish National Adaptation Plan (SNAP3) published in September 2024.
Public Services and Infrastructure (PS)
SNAP3 Outcome: Public services are collaborating in effective, inclusive adaptation action
The climate emergency requires us to collaborate. This outcome focuses on building the capacity of all Scotland’s public services and infrastructure networks to understand climate risks, adapt and act collaboratively with others in a place.
During the reporting period:
- Network Rail, Scottish Water and SP Energy Networks co-founded the Climate Ready Infrastructure Scotland Forum, following support from the Adaptation Scotland programme. More than 20 organisations have now formally agreed to work collaboratively to protect Scotland’s critical infrastructure from cascading weather and climate-related impacts.
- Scotland’s NHS is strengthening climate resilience through comprehensive risk assessments and adaptation planning. Health Boards are evaluating flood risks, overheating, and water scarcity, and ensuring alignment with property, risk and continuity strategies. Boards are developing climate adaptation plans and will monitor overheating risks in inpatient facilities, prioritise passive cooling and expansion of green infrastructure such as rain gardens and green roofs. NHS National Services Scotland is supporting Boards with data, tools, and emergency planning for climate risks, including flooding and disease outbreaks, and maintaining a GIS-based Climate Mapping Tool to assess service and infrastructure vulnerabilities.
- Scottish Water is progressing with its 2024 Adaptation Plan, preparing for 2°C warming by 2050 and 4°C by 2080. Efforts include updating water resource projections, developing tools to assess climate-related water quality risks, and producing rainfall projections to manage sewer flood risk. A 10-year Land Management Plan with Forestry and Land Scotland is restoring peatland and creating over 4,000 hectares of native woodland at Loch Katrine. So far, 303 hectares of woodland and 555 hectares of peatland have been restored to boost carbon capture, biodiversity, and resilience.
- Transport Scotland uses its Approach to Climate Change Adaptation and Resilience to inform how all Scotland’s transport networks prepare for climate impacts. For trunk roads, the Vulnerable Locations Operational Group continues to make improvements though delivery of and expanding number of defined schemes. A new Trunk Road Adaptation Plan will be published in 2025, with 45 recommendations to be actioned over the next five years. The Public Sector Climate Adaptation Network, facilitated by Adaptation Scotland, has expanded to a membership of 65 organisations, including 26 local authorities. It has empowered the growing network of leaders to drive adaptation action across their sectors and places using the newly updated Adaptation Capability Framework and Benchmarking tool.
- Scotland’s public bodies have a legal duty to help deliver SNAP3 and report on progress annually. Draft guidance on meeting this duty was published in February, making it clear that all public bodies must identify the objectives in SNAP3 relevant to their functions and act in a way that supports delivery. This includes understanding their climate risks and taking action to adapt. A summary analysis of all annual reports submitted by public bodies in November will be published by the Scotland Sustainable Network soon.
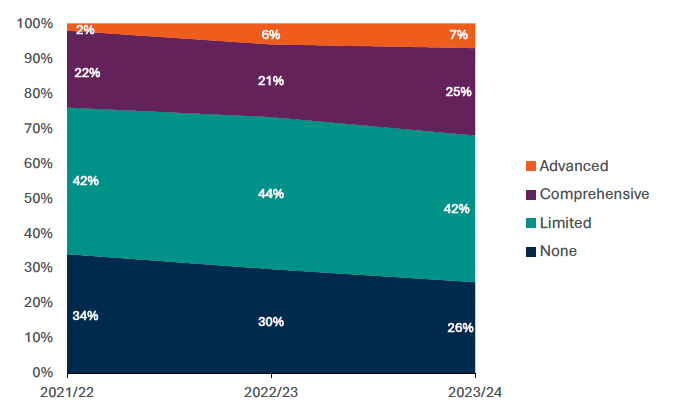
PS1.1 – Level of risk assessment reported across the public sector
Description: This indicator denotes the maturity of risk assessment undertaken by public bodies (local authorities, NHS boards, educational institutions, IJBs, transport partnerships, and other national and regional bodies). Responses are assessed as ‘None’, ‘Limited’, ‘Comprehensive’ or ‘Advanced’[17]
Data source: Public Bodies Climate Change Duties annual compliance reports/Sustainable Scotland Network
Ambition: Risk assessments are maturing over time
Risk assessment is a critical first step for organisations planning and taking action on climate adaptation.
This indicator assesses progress on climate risk assessment for the 186 public bodies who returned Public Bodies Climate Change Duties annual compliance reports for 2023-24.
Since 2021-22, the number of public bodies having undertaken some form of risk assessment has increased. In 2021-22 more than a third (34%) had not undertaken any risk assessment. By 2023-24 fewer bodies (26%) reported not having undertaken any risk assessment and a majority (42%) reported undertaking a limited risk assessment. Nearly a third of bodies (32%) have now completed advanced or comprehensive assessments, increasing from 27% in 2022-23.
PS1.2 – Level of adaptation action taken across the public sector
Description: This indicator denotes the maturity of adaptation action being undertaken by public bodies (local authorities, NHS boards, educational institutions, IJBs, transport partnerships, and other national and regional bodies). Responses are assessed as ‘None’, ‘Limited’, ‘Comprehensive’ or ‘Advanced’[18]
Data source: Public Bodies Climate Change Duties annual compliance reports/Sustainable Scotland Network
Ambition: Increasing over time
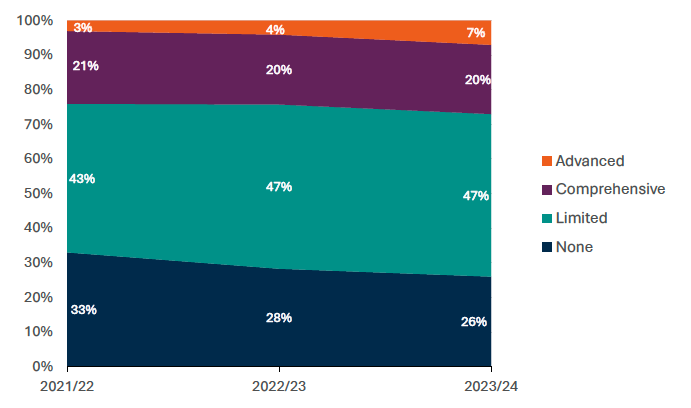
Adaptation action taken by the public sector has increased slightly since 2021/22. A third (33%) had not taken any action in 2021/22, decreasing to just over a quarter (26%) by 2023/24.
In 2023/24 almost half (47%) of the sector had taken at least limited action, with a further 20% taking comprehensive action, and a smaller proportion (7%) taking advanced adaptation action.
PS3.1 – Average per household water consumption
Description: This indicator shows the average per household water consumption in Scotland for unmetered households
Data source: Scottish Water
Ambition: Decreasing over time
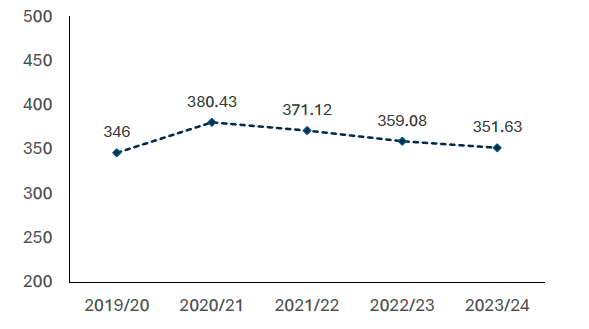
In 2023-24 the per household value of average water consumption for unmetered properties, excluding underground pipe leakage, is 351 l/prop/day (down by 2.07% from 359.08 l/prop/day in 2022-3). The 2023-24 figure is 1.6% above the pre COVID-19 value of 346.00 l/prop/day in 2019-20.
Reductions in water usage will increase the resilience of the water system to drought and increased demand from other wider pressures.
Changes in societal norms (such as working from home and spending more time in domestic gardens) as a result of the COVID-19 pandemic drove the increase in domestic water consumption in 2020/21. There are 134 zones in the Per Household Consumption Monitor which contains 9,422 properties. Each of these properties are representative of one of six socio-economic categories which enables extrapolation of data to the whole of Scotland. There was no substantial change in the proportion of properties across each of the categories.
The re-establishment of societal norms in place before COVID-19 (such as workplaces re-opening), alongside cooler summer temperatures, contributed to the fall in per household consumption in the last year.
PS3.2 – Number of properties sewer flooded during the year due to severe weather
Description: This indicator provides a measure of the number of properties sewer flooded (internally) during the year due to severe weather in Scotland
Data source: Scottish Water
Ambition: Broadly maintained over time (not worsening with climate change impacts)
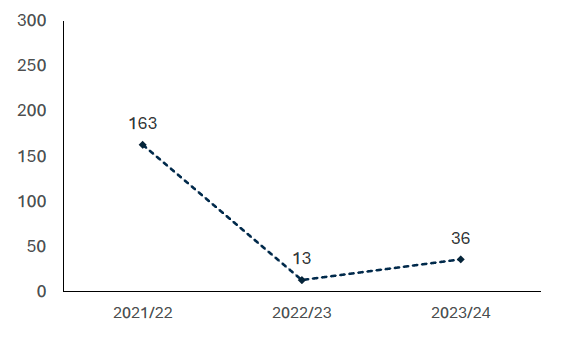
In 2023-24 , there were a number of high intensity, short duration storms, mostly in June-August 2023, with a widespread high intensity storm also occurring in early October 2023. There were 15 instances of internal sewer flooding, affecting 36 properties.
Climate change may increase the number of incidents of sewer flooding, due to the increased frequency and intensity of rainfall events. Sewer flooding can also be exacerbated by other factors such as urban growth and development, network changes and incidents unrelated to climate change.
The average return period[19] was 238 years, with one incident recording a return period of greater than 800 years and a further two incidents recording return periods of greater than 1,000 years. This compares to an average return period of approximately 51 years over the 10 incidents in 2022-23, with the highest return period incident being 198 years.
Whilst this represents a large in-year increase, the intensity and impact of events will vary depending on the location and frequency of severe weather. At this stage this it is not yet indicative of a trend.
PS4.1 – Number of ferry service cancellations
Description: This indicator shows the number of ferry service cancellations in Scotland as a result of weather conditions
Data source: Transport Scotland
Ambition: Decreasing over time
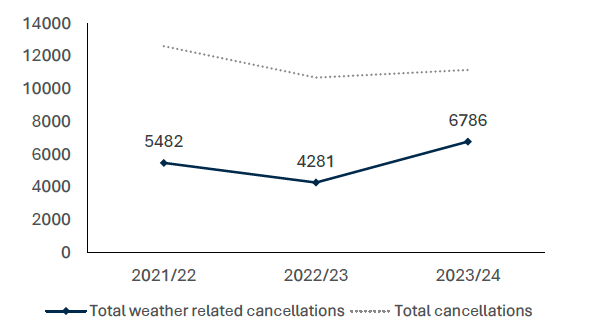
In 2023-24 there were 6786 weather related ferry service cancellations. This was an increase from the previous year (2022-23) when 4281 ferry services were cancelled in relation to weather conditions.
A more resilient ferry service should experience fewer weather related cancellations.
Data around weather related ferry service cancellations are sensitive to frequency of severe weather events such as storms in a given year. A longer time series will be required to report on trends in ferry service resilience.
PS4.2 – Proportion of trunk roads which require close monitoring
Description: This indicator shows the proportion of trunk roads in Scotland which require close monitoring of the state of the road surface.
Data source: Transport Scotland (Scottish Road Maintenance Condition Survey)
Ambition: Decreasing over time
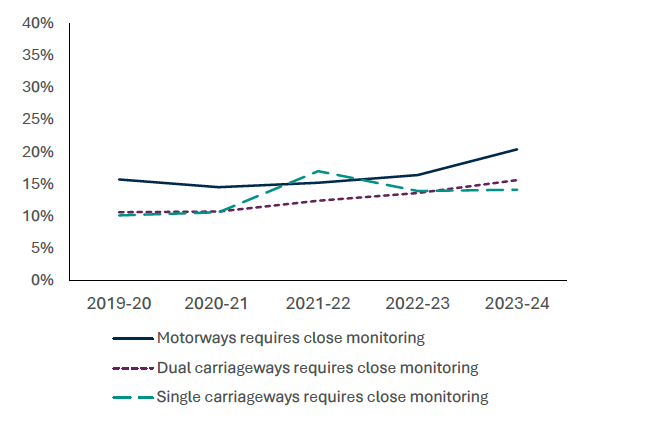
In 2023-24 the proportion of trunk roads which require close monitoring of the state of the road surface in Scotland were as follows:
- 20.4% of motorways
- 15.6% of dual carriageway
- 14.1% of single carriageways
There has been an increase in the proportion of trunk roads requiring close monitoring across each road type since 2019-20. In 2019-20, 15.7% of motorways required close monitoring, while 10.6% and 10.1% of dual carriageways and single carriageways respectively required close monitoring.
Trunk roads which are in good condition and don’t require close monitoring will be more resilient to impacts of climate change such as severe weather events.
PS4.3 – Proportion of Local Authority roads which may require maintenance
Description: This indicator shows the proportion of Local Authority roads in Scotland which are reported as maybe requiring maintenance
Data source: Transport Scotland (data collected by WDM ltd using SCANNER vehicle for Scottish Road Maintenance Condition Survey)
Ambition: Decreasing over time
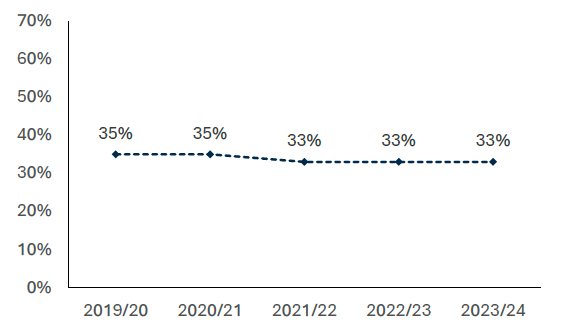
Red or Amber condition indicate that a road needs repair. Across local authority level roads, the proportion which may require maintenance has stayed fairly consistent since 2019-20. In 2023-24 33% of local authority roads were rated as red or amber condition in the Scottish Road Maintenance Survey.
Local authority roads which are in good condition will be more resilient to impacts of climate change such as severe weather events.
PS4.4 – Number of weather related train delays
Description: This indicator shows the instances of reported weather related train delays in Scotland in minutes per year
Data source: Network Rail
Ambition: Decreasing over time
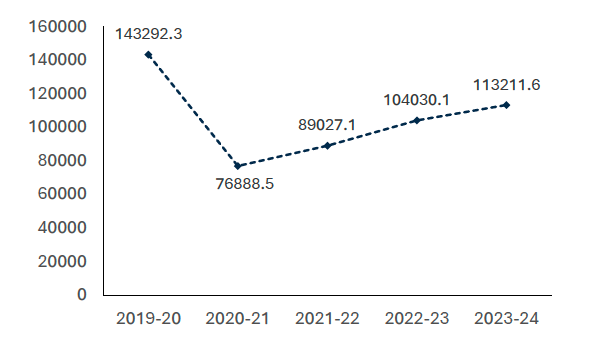
In 2023-24 there were 113211.6 minutes of weather related train delays in Scotland. This figure has risen year on year since 2020-21.
A more resilient train network should experience fewer weather related train delays.
Data around weather related train delays sensitive to frequency of severe weather events such as storms in a given year. A longer time series will be required to report on trends in train service resilience.
Contact
Email: ian.freeman@gov.scot