Scottish Marine and Freshwater Science Volume 3 Number 9: Data Mining of the Nephrops Survey Database to Support the Scottish MPA Project
Marine Scotland Science conducts annual underwater television surveys to estimate the abundance of Nephrops norvegicus on muddy sediments in seas around Scotland. Data within the Nephrops survey database will be used to assist with the Scottish Marine Pro
Data Mining
Nephrops Survey database
Initially, much of the work carried out for the MPA data mining project involved populating MSS' Nephrops survey database with all the data available from the recent UWTV surveys, i.e. those conducted from 2008 to 2010, inclusive. The database was developed with Microsoft Access and consists of twelve tables which can be broadly separated into those concerned with UWTV survey data and those containing trawl data (Figure 4). Relevant tables for this study included "Station info" which contains spatial information for each UWTV station and details on the occurrence of sea pens and other fauna and flora, and " PSA" which contains the results of the sediment analysis. Relationships are established between tables so that the database can be queried quickly and required data extracted. The Nephrops survey database was in its infancy at the time the data mining project was initiated and incorporation of (historical) data from earlier surveys continues as 'work in progress'.

Figure 4: Layout and relationships between tables in the Nephrops survey database.
Comparison of MSS' ROCA and SACFOR abundance scales
A second aspect of the work was to compare MSS' ROCA abundance scale (Table 1) with the six point MNCR (Marine Nature Conservation Review) SACFOR (Super abundant, Abundant, Common, Frequent, Occasional, Rare) scale used by JNCC, to record the abundance or density of a variety of benthic flora and fauna. For the SCAFOR scale, different ranges of densities apply depending on the size of the organism (Table 2).
Table 1
ROCA abundance scale used by MSS. The scale is applied to V. mirabilis, P. phosphorea and F. quadrangularis.
| Description | |
|---|---|
| Rare | Just a few (1-5) over the 10 minute run. |
| Occasional | A handful over the 10 minute run (a couple of dozen). |
| Common | Observed all the time, every few minutes. |
| Abundant | In almost all frames, multiples in frames. |
Table 2
SACFOR abundance scale used by JNCC, with corresponding densities (m -²) for V. mirabilis, P. phosphorea and F. quadrangularis.
| V. mirabilis , P. phosphorea (m -²) | F. quadrangularis (m -²) | |
|---|---|---|
| Super Abundant | 100.0 - 1000.0 | 10.0 - 100.0 |
| Abundant | 10.0 - 100.0 | 1.0 - 9.0 |
| Common | 1.0 - 9.0 | 0.1 - 0.99 |
| Frequent | 0.1 - 1.0 | 0.01 - 0.09 |
| Occasional | 0.01 - 0.09 | 0.001 - 0.009 |
| Rare | 0.001 - 0.009 | 0.0001 - 0.0009 |
This comparison involved re-examination of footage from 82 survey stations at which sea pen abundance had been previously assessed according to the MSS' ROCA scale. The stations for review were recorded on five UWTV cruises over a two year period (2009 and 2010) and, therefore, a number of MSS staff had been involved in assessing the sea pen abundance. Footage was selected from the main Scottish Nephrops functional units (Firth of Forth, Moray Firth, Fladen, Devil's Hole, North Minch, South Minch, Sound of Jura and Clyde) and included the full range of abundance levels (from zero to abundant) for each sea pen species and a range of visibility levels (from poor to excellent). Each species ( V. mirabilis, P. phosphorea and F. quadrangularis) was counted separately and counts were expressed as densities (m -2) for the ten minute run, where the viewed area was estimated as the product of the distance travelled by the sledge during the tow and the width of the viewed area (assumed to be 1 m, no adjustments were made for the sledge lifting or sinking).
Figure 5 shows the sea pen densities for each station, coloured to indicate the SACFOR scale classification. Sea pen densities, as determined from counts, were consistently within ranges for the 'Common', 'Frequent' or 'Occasional', classifications on the SACFOR scale. There were no stations where sea pens species would be classified as 'Abundant' or 'Super Abundant' on the SACFOR scale. At stations where sea pens were classified as 'Abundant' on the ROCA scale, densities were within the SACFOR 'Common' or 'Frequent' category. Densities of V. mirabilis and P. phosphorea with ROCA classifications of 'Common' and 'Occasional' were predominantly in the SACFOR 'Frequent' category. Densities of F. quadrangularis in the ROCA 'Common' displayed good agreement with 'Common' on the SACFOR scale.
Although the two scales were comparable, it was decided that the MSS' ROCA scale observations, as held in the Nephrops survey database, would be used to describe the sea pen abundance in each area.

Figure 5: Comparison of ROCA and SACFOR abundance scales at 82 stations for sea pens P. phosphorea, V. mirabilis and F. quadrangularis.
Data Layers
Once all relevant data had been entered into the database, various data sets were extracted and ArcView was used to assemble and display spatial data and produce data layers. These were based on 1,205 stations, surveyed during nine dedicated Nephrops UWTV survey cruises carried out by MRVs, Scotia, Clupea and Alba na Mara between 2008 and 2010 (Table 3). The stations (plus seven sediment day grab sites) were in the Firth of Forth, Arbroath area, Moray Firth, Fladen, Devil's Hole, North Minch, South Minch, Clyde, Sound of Jura and west coast sea lochs.
Data from a further 214 stations in sea lochs, bays and tidal inlets on the west coast of Scotland, surveyed from MRVs Clupea and Alba na Mara in 2008 and 2010 (Table 4) and UWTV footage from 205 stations at Rockall, Anton Dohrn Seamount, Rosemary Bank, Shelf Edge and St. Kilda Basin, recorded on drop frame deployments during eight deepwater cruises from MRV Scotia between 2000 and 2009 (Table 5), were also included.
Table 3
Number of stations surveyed on Nephrops UWTV survey cruises, 2008-2010.
| Year | Cruise | Vessel | No. Stations |
|---|---|---|---|
| 2010 | 0110a | Alba na Mara | 124 + 7 day grabs |
| 2010 | 0710s | Scotia | 237 |
| 2010 | 1110a | Alba na Mara | 92 |
| 2009 | 0109a | Alba na Mara | 82 |
| 2009 | 0809s | Scotia | 199 |
| 2009 | 1309a | Alba na Mara | 103 |
| 2008 | 0108c | Clupea | 83 |
| 2008 | 0708s | Scotia | 192 |
| 2008 | 0808a | Alba na Mara | 93 |
Separate data layers were produced for Nephrops burrow densities, sea pen occurrence (based on MSS' ROCA scale), depth, sediment type (from PSA or observations) and presence of trawl marks. Other features likely to be of conservation interest, for example deep water areas where corals were observed, were also mapped. A project timeline including GIS layer packages provided to JNCC and SNH are detailed in Annex A. Summary descriptions of the burrowed mud in the main Nephrops functional units and other species observed are provided below.
Table 4
Nephrops UWTV sea loch cruises, areas surveyed and number of stations in 2008 and 2010.
| Year | Cruise | Vessel | Area | No. Stations |
|---|---|---|---|---|
| 2010 | 0110a | Alba na Mara | Chairn Bhain | 6 |
| Eddrachillis Bay | 13 | |||
| Glen Coull | 8 | |||
| Glen Dhu | 11 | |||
| Gruinard Bay | 24 | |||
| Inchard | 22 | |||
| Laxford | 11 | |||
| Little Loch Broom | 15 | |||
| Loch Broom | 21 | |||
| 2008 | 0108c | Clupea | Inner Sound Applecross | 3 |
| Inner Sound Broadford | 2 | |||
| Inner Sound Crowlin | 3 | |||
| Inner Sound Pabay | 2 | |||
| Inner Sound Raasay | 3 | |||
| Inner Sound Scalpay | 3 | |||
| Loch Alsh | 3 | |||
| Loch Carron | 8 | |||
| Loch Duich | 6 | |||
| Loch Hourn | 6 | |||
| Loch Kishorn | 3 | |||
| Loch Nevis | 10 | |||
| Loch Torridon | 22 | |||
| Sound of Sleat | 9 |
Table 5
Number of Nephrops UWTV stations surveyed on deepwater cruises, 2000-2009.
| Year | Cruise | Vessel | No. Stations |
|---|---|---|---|
| 2000 | 1400s | Scotia | 29 |
| 2002 | 1302s | Scotia | 20 |
| 2004 | 1204s | Scotia | 16 |
| 2005 | 1205s | Scotia | 42 |
| 2006 | 1406s | Scotia | 32 |
| 2007 | 1307s | Scotia | 23 |
| 2008 | 1108s | Scotia | 13 |
| 2009 | 1209s | Scotia | 30 |
Mud Biotopes - Area Summaries/Descriptions
Firth of Forth
A total of 132 stations were surveyed in the Firth of Forth (43 in 2008; 48 in 2009 and 41 in 2010). Depth readings were available for 91 stations and ranged from 7 m to 79 m. Shallower stations were located in the southern region of the inner Firth of Forth whilst the deepest stations were in the outer Firth of Forth.
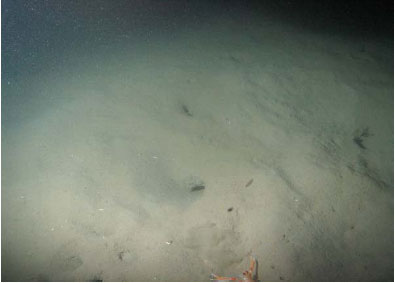
Nephrops burrow entrances tend to be smaller than those observed in the Fladen (Figure 6a). Mean Nephrops burrow densities were calculated for 122 stations and ranged from 0 to a maximum of 2.89 burrows m -2 (Figure 6b). Most stations had a burrow density of less than 2 burrows m -2.
Particle size analysis was carried out on samples obtained at 130 stations. Of these, 104 stations are described by the Folk scale (1954) as 'muddy sand', 21 stations as 'sandy mud' and five stations as 'sand'. These results were mostly in agreement with the BGS maps, with the exception of the 'sand' results which the BGS described as 'muddy sand'. Sediment grabs were not possible at two sites where substrate was described by observation as 'mussel shells' and 'rocks'.
F. quadrangularis were observed at one station in the Firth of Forth in 2008, at a station where the sediment observation was 'mussel shells'. P. phosphorea were present at 55 stations and V. mirabilis at 56 stations, with both species recorded as 'Rare', 'Occasional', 'Common' or 'Abundant'. All records of 'Abundant' were stations in the outer Firth. P. phosphorea and V. mirabilis were found together at 31 stations.
Gadoids were present at 46 stations and flatfish at 45. Other marine fauna were recorded at most stations; they included Goneplax rhomboids, Liocarcinus sp., sea anemones and starfish. Trawl marks were observed at 22 stations, mostly in the deeper water in the outer Firth.
(a)
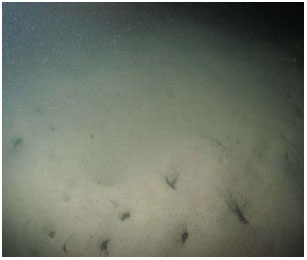
(b)
Figure 6: (a) Photograph of Firth of Forth seabed with typical Nephrops burrow complexes. (b) Map showing Nephrops burrow densities 2008-2010.
Arbroath
Fifteen stations were surveyed off Abroath between 2008 and 2010. Depth data were available for seven of these stations and ranged from 27 m to 87 m, with shallower stations closer to the shore. Nephrops burrows were present at eight of the stations; however, burrow densities have not been calculated for this area as it is not a functional unit and not considered in the stock assessment. Thirteen sediment samples underwent PSA; 12 stations were described as 'muddy sand' and one station as 'sand'. Sediment grabs were not possible at two stations where substrate was observed as 'rocks' and 'sandy with stones'. Gadoids were present at nine stations and flatfish in eight. Sea pens and trawl marks were not observed during any of the UWTV runs but the visual clarity was described as 'poor' in nine runs.
Moray Firth
Data were available from 223 stations in the Moray Firth, of which 82 were surveyed for sediment mapping only (no Nephrops burrow or sea pen density estimates). Station depth (available for 211 stations) ranged from 18 to 229 m. The shallowest stations were in the inner Moray Forth and the deepest stations in the Southern Trench in the eastern Moray Firth.
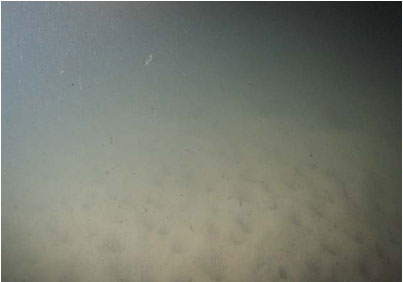
Nephrops burrow densities, calculated for 135 stations in the Moray Firth, ranged from 0 to 1.2 burrows m -2 . Nephrops burrow entrances are smaller than those observed in the Fladen (Figure 7a) and the majority of stations had a burrow density of less than 0.52 burrows m -2.
Particle size analysis on samples from 215 stations classified 148 stations as 'muddy sand', 34 as 'sandy mud', 32 as 'sand' and only one station was classed as 'mud' (Figure 7b). Sediment grabs were not possible at eight stations where observed ground types were 'rocks' (three stations), 'hard ground' (two stations), or 'sand with stones' (three stations). There were numerous discrepancies between BGS maps and PSA results concerning distribution of 'muddy sand' and 'sand'.
F. quadrangularis were not observed in the Moray Firth (Table 6). V. mirabilis were observed at 15 stations but were never recorded as 'Abundant'. P. phosphorea was present at 67 stations but only 'Abundant' in one station in the outer Moray Firth. Gadoids were observed at 79 stations and flatfish in 74. Other species observed included G. rhomboides, hermit crabs and starfish. Trawl marks were observed at three stations.
(a)
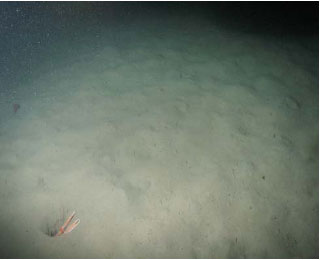
(b)
Figure 7: (a) Photograph of typical Moray Firth seabed with a Nephrops in burrow. (b) Map showing PSA results for 2008, 2009 and 2010.
Table 6
Number of stations where sea pens P. phosphorea, V. mirabilis and F. quadrangularis were observed for each functional unit (n = number of stations reviewed).
| FUNCTIONAL UNIT | P. phosphorea | V. mirabilis | F. quadrangularis |
|---|---|---|---|
| Firth of Forth (n= 132) | 55 | 56 | 1 |
| Moray Firth (n=141) | 67 | 15 | 0 |
| Fladen (n=203) | 150 | 147 | 1 |
| Devil's Hole (n=39) | 24 | 24 | 0 |
| North Minch (n=176) | 52 | 36 | 67 |
| South Minch (n=104) | 40 | 31 | 62 |
| Sound of Jura (n=24) | 5 | 6 | 0 |
| Clyde (n=119) | 10 | 38 | 16 |
Fladen
The Fladen is the largest of the Nephrops functional units and is located in the central northern North Sea. Between 2008 and 2010 a total of 203 stations were surveyed. The majority were at depths of between 92 and 160 m, although depths of 266 m were recorded at one station surveyed in 2010. Deeper stations tended to be in the south east corner of Fladen.
Nephrops burrow densities (201 stations) ranged from 0 to 1.01 burrows m -2. Slightly higher densities were found in the south eastern corner of the Fladen ground. Nephrops burrow entrances tend to be larger than other functional units (Figure 8a).
Particle size analysis results for 201 samples described 110 stations as 'muddy sand', 87 stations as 'sandy mud' and four stations as 'sand' (Figure 8b). The 'sandy mud' was generally found in the south eastern corner. There were discrepancies between the PSA results and BGS maps because no 'mud' was revealed by PSA. Grabs were unsuccessful at two stations; one UWTV run was abandoned and the other station was described as 'sand with stones'.
Sea pens were present at 169 stations in the Fladen. F. quadrangularis were observed at one station towards the centre of the Fladen ground in 2010 (Figure 8c), on a substrate characterized as 'sand'. P. phosphorea were observed at 150 stations and V. mirabilis at 147 stations. These two species were observed together at 118 stations.
Gadoids were observed at 83 stations and flatfish at 143 stations. Other species frequently noted include hagfish, rockling, dragonet, starfish, crabs and anemones. Trawl marks were observed at 65 stations.
(a)
(b)
(c)
Figure 8: (a) Photograph of typical Fladen seabed with Nephrops burrow. (b) Map showing PSA results for 2008-2010. (c) Map showing abundance of F. quadrangularis observed 2008-2010.
Devil's Hole
The Devil's Hole is an area to the south of Fladen which consists of several isolated deep trenches with 'muddy' sediments on the sea floor. The surrounding seabed is on average approximately 90 m deep but the 'holes' have very steep sides and can be 230 m deep. The area was surveyed in 2009 and 2010 with a total of 39 stations. Nephrops burrows were present at 35 stations, predominantly on 'muddy sand' substrate (one station on 'sand'). Particle size analysis described 'muddy sand' at 35 stations and 'sand' at four (Figure 9). This was mostly supported by the BGS maps with the exception of six stations which BGS described as 'sand' and PSA results showed as 'muddy sand'.
F. quadrangularis was not observed at the Devil's Hole but P. phosphorea and V. mirabilis were observed at 24 stations, occurring together at 17 stations. Gadoids were present at 11 stations and flatfish at 27. Other species observed include hagfish, rockling, hermit crabs and starfish. Trawl marks were noted at 12 stations.
Figure 9: A map showing PSA results for samples obtained during Nephrops UWTV surveys carried out in 2009 and 2010 in the Devil's Hole.
North Minch
The North Minch is the sea area on the west coast of Scotland between the main-land and the Outer Hebrides, to the north of Skye. Between 2008 and 2010, 139 stations were surveyed, ranging in depth from 50 m to 295 m. Nephrops burrow entrances in this area usually appear smaller than those observed in the Fladen, with densities from 0 to 1.91 burrows m -2. In most areas, high densities of burrows made by other species, including Calocaris, resulted in sediment resembling 'Swiss cheese' (Figure 10a).
Particle size analysis results for 128 samples were 'muddy sand' (62 stations), 'sandy mud' (44 stations), 'mud' (18 stations) and 'sand' (four stations) with occasional patches of rock and hard ground (observations at 11 stations). The sediment type as assessed by PSA showed many discrepancies when compared to the BGS maps, especially in the area to the east of the Isle of Lewis where substrate was described as 'sand' by the BGS maps but revealed as 'muddy sand' by PSA.
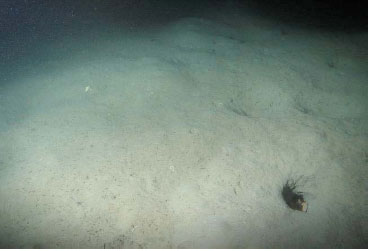
P. phosphorea were recorded at 52 stations, F. quadrangularis at 67 stations and V. mirabilis at 36 stations. F. quadrangularis were observed as 'Rare', 'Occasional' or 'Common' but never as 'Abundant' (Figure 10b). Gadoid fish were observed at 64 stations and flatfish at 48 stations. Other species commonly observed included hermit crabs, crabs, sea cucumbers, urchins, fan worms, anemones and starfish. Trawl marks were recorded on 22 stations.
(a)
(b)
Figure 10: (a) Photograph of typical North Minch seabed with characteristic 'Swiss cheese' appearance of burrows and V. mirabilis sea pens. (b) Map showing abundance of F. quadrangularis observed on Nephrops UWTV surveys 2008-2010.
South Minch
The South Minch is on the west coast of Scotland and located to the south of the North Minch. It comprises sheltered coastal regions and areas of more open water, and includes a diverse range of sediment types and habitats. A total of 104 stations at depths ranging from 30 to 251 m were surveyed in the South Minch between 2008 and 2010.
Nephrops burrow entrances in the South Minch are smaller than those in the Fladen (Figure 11a) and high densities of burrows made by other species were typically observed. Nephrops burrow densities were between 0 and 1.3 burrows m -2.
Particle size analysis was carried out for samples collected at 97 stations. Sediments were classified as 'sandy mud' (51 stations) and 'muddy sand' (41 stations) with patches of 'sand' (three stations) and 'mud' (two stations). Sediment grabs were not possible at seven stations where ground type was described as 'rock' (five stations), 'hard ground' (one station) and 'seaweed/growth on harder substrate'. Sediment results were similar to the BGS maps except for a patch of 'mud' as described by BGS was analysed to be 'sandy mud' by PSA.
P. phosphorea were observed at 40 stations and classified mainly as 'Rare' or 'Occasional'. V. mirabilis were present at 31, and F. quadrangularis at 62 stations. F. quadrangularis was observed as 'Abundant' at only one station but noted as 'Common' at 16 stations, 'Occasional' at 26 stations and 'Rare' at 19 stations (Figure 11b). Gadoids were reported on 47 stations and flatfish on 38 stations. Other commonly observed species included: crabs, anemones, hermit crabs, squat lobsters, fan worms, shrimps and starfish. Trawl marks were observed at 28 stations.
Sound of Jura
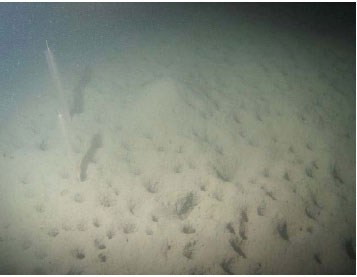
The Sound of Jura is a small strait on the west coast of Scotland between the Knapdale peninsula and the Isle of Jura. Data from 24 stations, 12 surveyed in 2009 and 12 in 2010, at depths ranging from 47 to 150 m were available in this area. Nephrops burrow entrances are general larger than the South Minch (Figure 12a) and burrow density is also higher, ranging from 0.5-2.04 burrows m -2, with few other species burrow types observed.
Sediments were classified as 'muddy sand' on 10 stations and 'sandy mud' on 14 stations and differed slightly to the BGS maps as our PSA results did not reveal any true 'mud' (Figure 12b).
P. phosphorea were observed as 'Rare' at three stations and 'Occasional' at two, and V. mirabilis were observed as 'Rare' at two stations, 'Occasional' and 'Common' at one station each and 'Abundant' at two stations.
Gadoids were observed in seven UWTV runs and flatfish in six. Other species noted included shrimps, fan worms and anemones.
(a)
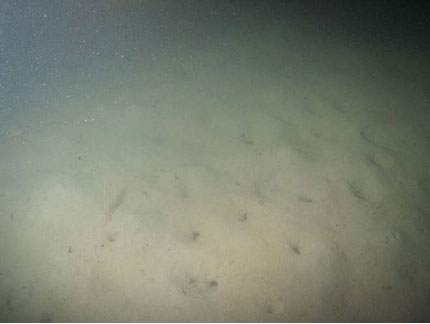
(b)
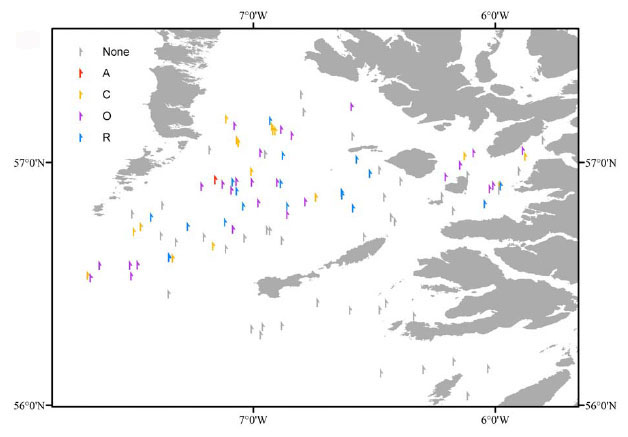
Figure 11: (a) Photograph of typical South Minch seabed with Nephrops burrows complexes. (b) Map showing abundance of F. quadrangularis (based on ROCA scale) observed in the South Minch on Nephrops UWTV surveys 2008-2010.
(a)
(b)
Figure 12: (a) Photograph of typical Sound of Jura seabed with Nephrops burrow and a Nephrops outside burrow. (b) Map showing PSA results for Nephrops UWTV stations surveyed in 2009-2010 overlaid on BGS map showing distribution of 'muddy' sediments (British Geological Survey, 2002).
The Clyde
The Clyde was surveyed in 2008 (40 stations), 2009 (40 stations) and 2010 (39 stations). Stations depths ranged from 37 to 165 m and shallower stations were generally those to the south of Ailsa Craig.
High densities of Nephrops and other burrows, including those made by Calocaris, produce sediment resembling 'Swiss cheese' (Figure 13a). Visual clarity in the Clyde area is usually 'poor' because of the amount of suspended particles in the water column. Nephrops burrows appear smaller than burrows found in other functional units and burrow density is generally higher in the Clyde to the south of Ailsa Craig (up to 2.05 burrow m -2).
Particle size analysis classified 62 stations as 'sandy mud', 34 stations as 'muddy sand' and 21 as 'mud'. Muddy sand was predominantly found to the south of Ailsa Crag, with 'sandy mud' and 'mud' located to the north east of the Clyde (Figure 13b). Discrepancies between PSA and BGS maps occurred between PSA 'sandy mud' and BGS 'mud'. Grabs were not possible at two stations where 'rocks' were observed.
All three species of sea pens were observed in the area, P. phosphorea at 10 stations, F. quadrangularis at 16 stations and V. mirabilis at 38 stations. Gadoids were observed in 23 and flatfish in 44 UWTV recordings. Other species occasionally observed included brittle stars, hermit crabs, starfish, urchins, anemones, queen scallops, crabs and fan worms.
(a)
(b)
Figure 13: (a) Photograph of typical 'poor' visibility and 'Swiss cheese' appearance of sediment in Clyde. (b) Map showing PSA results from 2008-2010 surveys in the area, overlaid onto BGS map showing distribution of 'muddy' sediments (British Geological Survey, 2002).
West Coast Sea Lochs
A total of 214 stations in various sea lochs, bays and tidal inlets on the west coast of Scotland were surveyed in two cruises in 2008 and 2010. Station depths ranged from 10 m to 204 m. All 83 UWTV stations were reviewed for 2008 but only nine UWTV stations have been reviewed from the cruise in 2010.
Nephrops burrows were observed at 156 stations (presence/absence data only as densities were not calculated because it was not possible to calculate the viewed area for the drop-frame).
Sediments types were determined by PSA for samples obtained at 204 stations, and classified mainly as 'sandy mud' (108 stations) and 'muddy sand' (84 stations), with patches of 'mud' (seven stations) and 'sand' (five stations). Sediment grabs were not possible at 10 sites where ground types were described as 'rocks' (six stations), 'sand with rocks' (three stations) and 'sand with stones' (one station). The BGS maps do not cover the sea loch areas surveyed therefore no comparisons could be made.
For the 92 reviewed UWTV stations, F. quadrangularis were observed at 39 stations and described as 'Abundant' at three stations in Loch Torridon and 'Common' at eight stations (three stations in the Inner Sound, three stations in Loch Torridon, one station in Loch Carron and one in Loch Nevis) (Figure 14). P. phosphorea were reported at 28 stations ('Abundant' at one station in Loch Torridon) and V. mirabilis was observed at 28 stations but never recorded as 'Abundant'. All three species were observed in the same UWTV run at five stations (two stations in Loch Kishorn, and one station in Loch Nevis, Loch Torridon and Loch Duich).
Gadoids were observed at 46 stations and flatfish at 13 stations. Other species such as pipefish, dogfish, rays, hagfish, urchins, scallops, squat lobsters, starfish, crinoids, sea cucumbers, anemones, fan worms and crabs were frequently reported.
A number of UWTV stations were relocated because of the presence of creels in the sea lochs. Creel marks or ropes were observed at five stations in Loch Torridon and the Inner Sound.
Figure 14: Observations of F. quadrangularis in west coast sea lochs, bays and tidal inlets (based on MSS' ROCA scale) at stations surveyed on Nephrops UWTV surveys in 2008 and 2010.
Deepwater West of Scotland
A total of 205 stations were surveyed in areas of Rockall, Anton Dohrn Seamount, Rosemary Bank, Shelf Edge and St. Kilda Basin between 2000 and 2009, using the drop-frame array. Sediment classifications at stations were based on observations. Presence or absence of Nephrops burrows, sea pens, corals, fish and other flora and fauna were recorded 'live' whilst surveying. Footage has not been reviewed by independent observers.
Rockall
A total of 85 stations were surveyed around Rockall: 28 in 2005, nine in 2006, 16 in 2007, 13 in 2008 and 19 in 2009. Depths ranged from 142 to 946 m.
Sediment types were described for 77 stations, as 'sand' (45 stations), 'sand with cobbles' (10 stations), 'mud' (nine stations), 'gravel' (six stations), 'rock' (six stations) and 'sandy mud' (one station) (Figure 15).
Sea pens were observed at four stations and corals on 23 stations. Nephrops-like burrows were observed during 11 UWTV recordings. Flatfish, gadoids and other fish were occasionally reported. Trawl marks were observed at one station east of Rockall.
Anton Dohrn Seamount
In 2005, five stations were surveyed around the Anton Dohrn Seamount. Depth ranged from 555 to 650 m. 'Sand' was the only type of sediment observed, with one station also noting 'cobbles'. No sea pens, corals or Nephrops-like burrows were reported in this area.
Rosemary Bank
Five stations were surveyed in the area of Rosemary Bank in 2007. Depths ranged from 352 to 777 m. Sediments types observed were 'sand' (three stations) and 'sand with cobbles' (two stations). Sea pens were observed at one station. No corals or Nephrops-like burrows were reported.
Shelf Edge
A total of 106 stations were surveyed along Shelf Edge between 2000 and 2009 at depths ranging from approximately 249 to 690 m. Sediment types observed were described for 77 stations as 'sand' (41 stations), 'sandy mud' (14 stations), 'mud' (13 stations), 'sand with cobbles' (three stations), 'gravel' (four stations), 'mud with stones' (two stations).
Nephrops-like burrows were reported at 55 stations and corals at two stations. Flatfish, gadoids and other fish were frequently reported. Trawl marks were observed on 19 stations in various locations along the shelf edge.
St. Kilda Basin
Four stations were surveyed in 2002 around the St. Kilda Basin. Depth ranged from 163 to 169 m and observed sediments were 'sandy mud' (three stations) and 'mud' (one station). Nephrops-like burrows were reported at two stations.

Figure 15: Sediment observations of deepwater UWTV stations off the west coast of Scotland on surveys from 2000-2009.