Scottish Housing Market Review: January - March 2021
Summary of the latest Scottish housing market data.
5. Residential LBTT; Homelessness
Residential LBTT; Homelessness
Source: Revenue Scotland
Residential LBTT
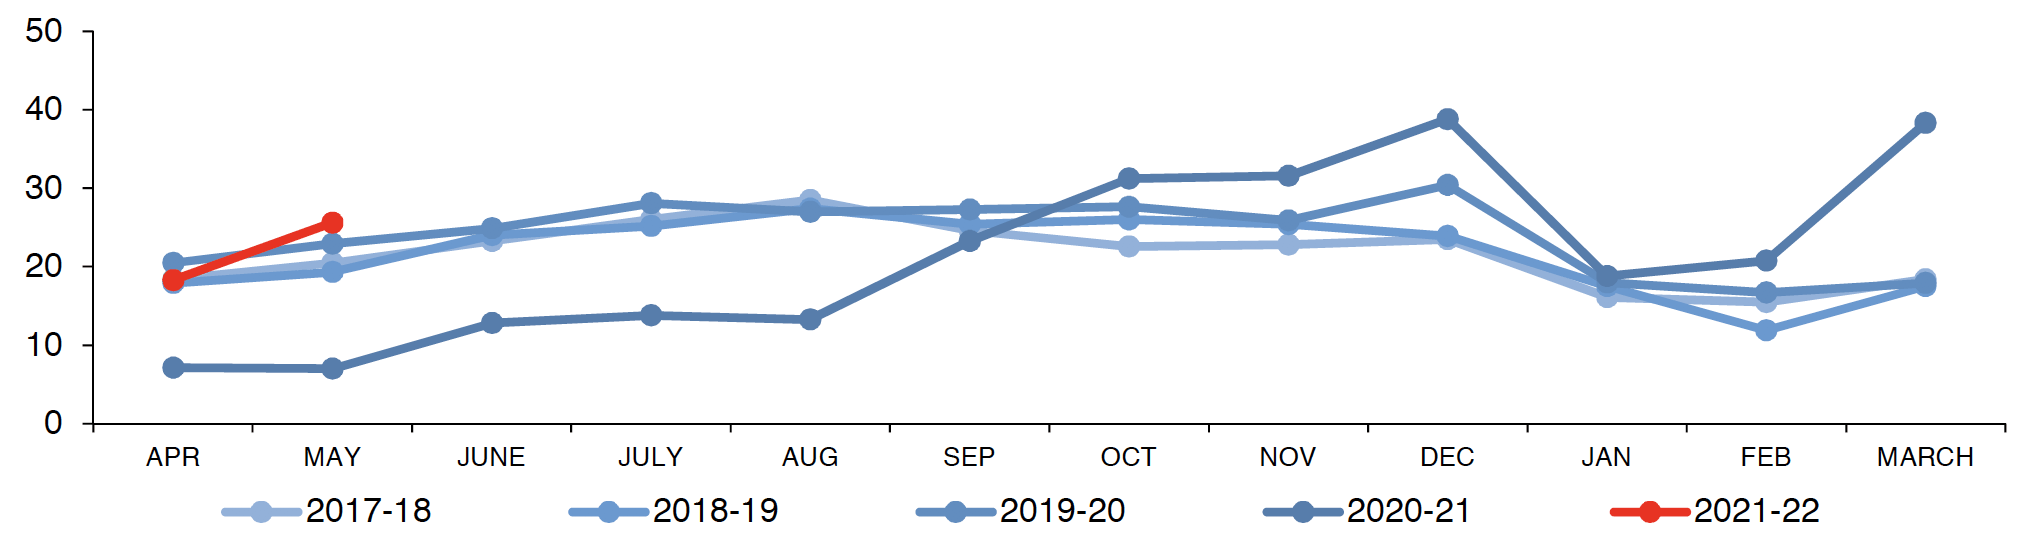
There was a reduction in residential LBTT revenue in 2020-21, with residential LBTT liabilities excluding ADS totalling £256.8m, down by 10.6% on 2019-20, and gross ADS liabilities totalling £156.6m, down by 5.9%. This was due to the housing market recovery from Q3 2020 onward being insufficient to offset the lost revenue from the period of housing market restrictions in Q2 2020, as well as from the temporary increase of the zero rate threshold for all buyers to £250K (from £175K for first-time buyers, and £145K for other buyers), which took effect on 15 July 2020 and ended on 31 March 2021.
Residential LBTT revenues excluding ADS rose sharply from £20.8m in February 2021 to £38.3m in March, before falling to £18.3m in April, as transactions were brought forward to benefit from the temporary reduction in LBTT. Revenues then returned to £25.6m in May 2021, which is higher than the £22.9m recorded in May 2019, suggesting the market may have stabilised at pre-covid levels.
Source: Scottish Government
Source: Scottish Government
Homelessness
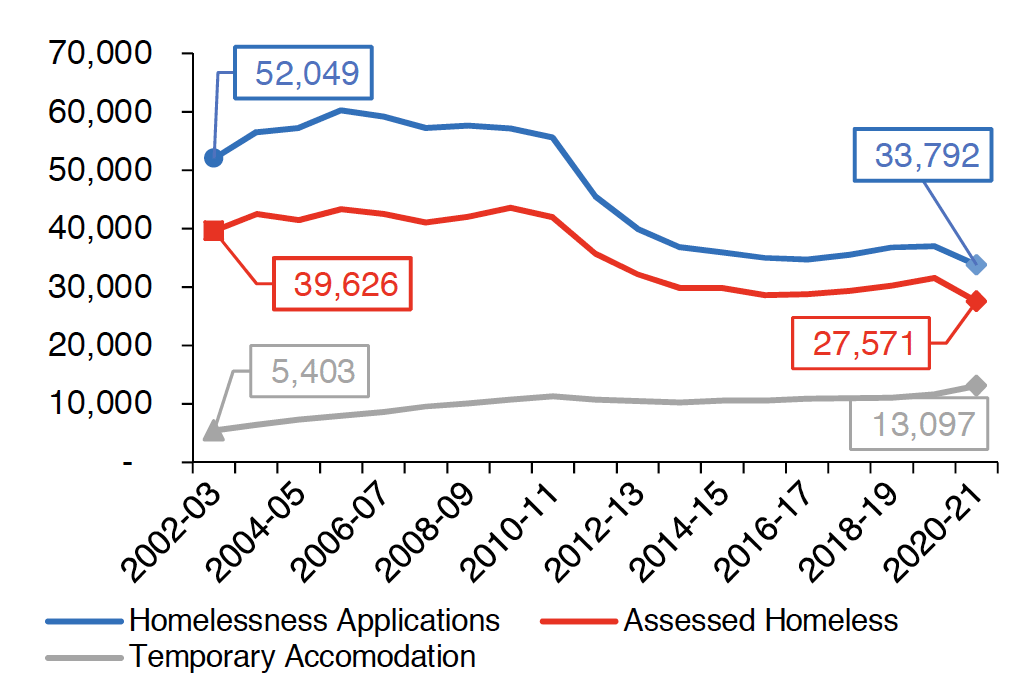
2020/21 saw 33,792 homelessness applications in Scotland, an annual decrease of 8.8% (-3,251). 27,571 households were assessed as being homeless (including those threatened with homelessness), a reduction relative to 2019/20 of 12.7% (-4,010). This included 30,345 (-15.5%) adults and 11,804 (-26.5%) children. There were 13,097 households in offered temporary accommodation as at 31 March 2021, an annual increase of 12.3% (+1,432).
On a per capita basis, West Dunbartonshire had the highest number of homeless households per 1,000 population (aged 16+) in 2020/21, at 11.9. This compares to a Scottish average of 6.1.
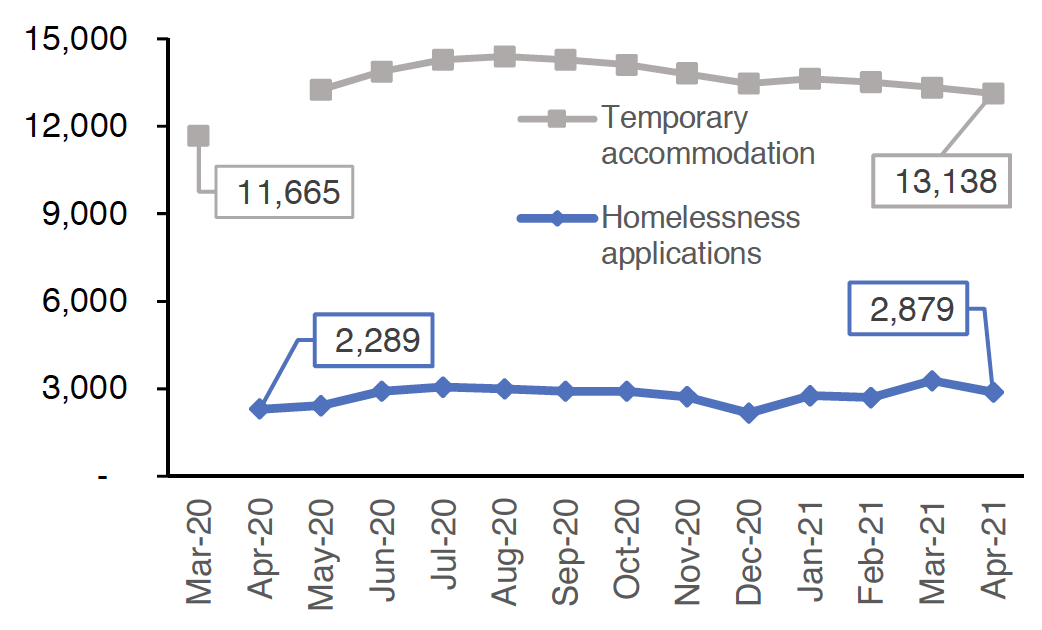
In response to Covid-19 pandemic, the Scottish Government is publishing monthly Management Information on homelessness applications and households in temporary accommodation, although this is not directly comparable to the official homelessness statistics. The monthly data shows that in April 2021 there were 2,879 homelessness applications. The number of households in temporary accommodation peaked at 14,397 at the end of August 2020, but has since fallen to 13,138 at the end of April.
* Note that the monthly temporary accommodation data for April 2020 was missing data from 5 local authorities. Therefore, this data point is suppressed in Chart 5.3. Instead, the figure at the end of March, taken from official statistics, is shown for comparison purposes.
Contact
Email: William.Ellison@gov.scot