Scottish House Condition Survey: Local Authority Analysis 2017-2019
Local Authority figures for 2017-2019, including fuel poverty rates, energy efficiency ratings, the condition of housing and the Scottish Housing Quality Standard.
Energy Efficiency
A dwelling's energy efficiency rating is scored between 1 and 100 using the Standard Assessment Procedure (SAP). Energy Performance Certificates (EPC) display these ratings, and which broad ranking band they fall into, the highest attainable being an A rating (high energy efficiency, low running costs), and the worst, G (low energy efficiency, high running costs).
Here, ratings and corresponding bands have been derived using the SAP 2012 (v9.92) methodology since this is the most recent version with 3 full years of data. Figure 3 shows the proportion of dwellings in local authorities which had the lowest rated properties (F or G) - the least energy efficient - and Figure 4 the highest rated properties (bands B or C; no A-rated properties were surveyed in the period 2017 to 2019).
Island and rural local authorities generally had the highest proportion of the least energy efficient dwellings. A total of eleven local authorities had rates above the national average (4%), with the highest being Na h-Eileanan Siar (18%), Orkney Islands (17%), Dumfries & Galloway (15%), Shetland Islands (14%). These local authorities also had the lowest proportions of properties in the highest efficiency bands.
Glasgow City (1%), Aberdeen City (1%), Renfrewshire (2%), South Ayrshire (2%) and Fife (3%) had the lowest average shares of F or G rated dwellings and were statistically different from the national average. Correspondingly, Glasgow City and Renfrewshire also had higher than average proportions of B or C rated dwellings. Island and rural local authorities tended to have lower than average proportions of B or C rated dwellings with Shetland Islands (8%), Na h-Eileanan Siar (9%) and Orkney Islands (15%) having the lowest. West Lothian had the highest proportion of B or C rated dwellings (61%) compared to 45% in Scotland overall.
Although in many cases it follows that those authorities with the lowest rates of F or G rated dwellings have amongst the highest rates of B or C rated dwellings there are instances where the pattern differs. For example, South Ayrshire has amongst the lowest rates of both F or G (2%) and B or C (35%) rated dwellings and therefore has a high rate amongst the middle energy efficiency bands, D or E.
It is important to bear in mind that the characteristics of the housing stock in an area can affect energy efficiency. For example, detached houses and housing which is off the gas grid are more likely to be F or G rated than other housing types while flats are more likely to be B or C rated. Apart from Argyll and Bute, all 11 local authorities with higher proportions of F or G rated stock also had a higher than average proportion of houses and apart from Angus, all 11 had a higher proportion of dwellings which were off the gas grid. Of the 8 local authorities with higher than average proportions of B or C rated properties, 3 also had higher than average proportion of flats as a share of their dwelling stock and 5 had a lower than average proportion of dwellings off the gas grid. Additionally, apart from City of Edinburgh and Glasgow City, all 8 local authorities had a lower proportion of dwellings built pre-1945.
The full local authority release also includes the share of properties rated EPC F or G using the SAP 2009 methodology. Dwellings with main heating fuels other than mains gas (for example oil or coal) have systematically lower SAP ratings in SAP 2012 than in SAP 2009 and this is particularly true at the lower end of the SAP range. The main reason for this is that SAP fuel prices for these fuels have risen more than for mains gas. As a result, average energy efficiency ratings tend to be slightly lower under SAP 2012 compared to SAP 2009. A summary of the main differences between the two methodologies can be found in the 2019 SHCS Methodology Report.
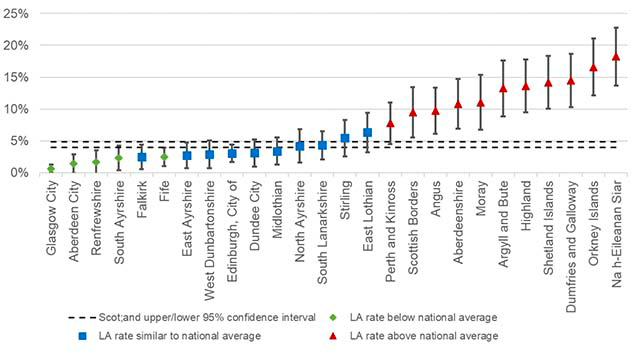
Note: In this chart, the proportion of dwellings with an EPC F or G rating for Scotland as a whole is a three-year average. This is different to the proportion published in the main SHCS Key Findings report, which is an annual figure. Clackmannanshire, East Dunbartonshire, East Renfrewshire, Inverclyde, North Lanarkshire and West Lothian are not shown due to small sample sizes.
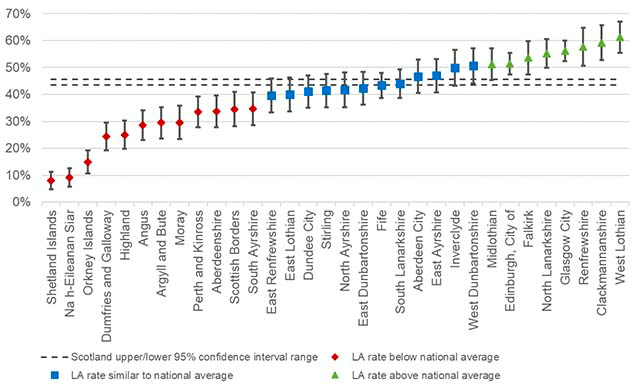
Note: In this chart, the proportion of dwellings with an EPC B or C rating for Scotland as a whole is a three-year average. This is different to the proportion published in the main SHCS Key Findings report, which is an annual figure.
Contact
Email: shcs@gov.scot