Scottish Fish Farm Production Survey 2020
This report is based on the returns of an annual survey questionnaire sent to all active authorised fish farming businesses in Scotland during 2020. Statistics on employment, production and value are presented.
3. Atlantic Salmon - Production
Production
Production survey information was collected from all 11 companies actively involved in Atlantic salmon production, farming 232 active sites. This figure represents the entire industry operating in Scotland.
| Year | Tonnes | Percentage difference | Year | Tonnes | Percentage difference |
|---|---|---|---|---|---|
| 2000 | 128,959 | 2 | 2011 | 158,018 | 2.5 |
| 2001 | 138,519 | 7 | 2012 | 162,223 | 2.7 |
| 2002 | 144,589 | 4 | 2013 | 163,234 | 0.6 |
| 2003 | 169,736 | 17 | 2014 | 179,022 | 9.7 |
| 2004 | 158,099 | -7 | 2015 | 171,722 | -4.1 |
| 2005 | 129,588 | -18 | 2016 | 162,817 | -5.2 |
| 2006 | 131,847 | 2 | 2017 | 189,707 | 16.5 |
| 2007 | 129,930 | -1.4 | 2018 | 156,025 | -17.8 |
| 2008 | 128,606 | -1 | 2019 | 203,881 | 30.7 |
| 2009 | 144,247 | 12 | 2020 | 192,129 | -5.8 |
| 2010 | 154,164 | 6.9 | 2021 | 236,000* |
*industry estimate of projected tonnage based on stocks currently being on-grown.
The total production of Atlantic salmon during 2020 was 192,129 tonnes, a decrease of 11,752 tonnes (5.8%) on the 2019 total. This was the second highest level of production recorded in Scotland.
| Year of smolt input | Year of harvest | Number (000's) | Production (tonnes) | Mean weight at harvest (kg) | |
|---|---|---|---|---|---|
| Harvest in year 0 (i.e. in year of input) | 2011 | 2011 | 109 | 307 | 2.8 |
| 2012 | 2012 | 127 | 301 | 2.4 | |
| 2013 | 2013 | 0 | 0 | - | |
| 2014 | 2014 | 286 | 720 | 2.5 | |
| 2015 | 2015 | 223 | 626 | 2.8 | |
| 2016 | 2016 | 114 | 333 | 2.9 | |
| 2017 | 2017 | 0 | 0 | - | |
| 2018 | 2018 | 84 | 247 | 2.9 | |
| 2019 | 2019 | 319 | 931 | 2.9 | |
| 2020 | 2020 | 323 | 1,208 | 3.7 | |
| Harvest in year 1 | 2010 | 2011 | 18,694 | 91,105 | 4.9 |
| 2011 | 2012 | 21,502 | 97,744 | 4.5 | |
| 2012 | 2013 | 21,264 | 106,161 | 5.0 | |
| 2013 | 2014 | 20,316 | 101,997 | 5.0 | |
| 2014 | 2015 | 24,038 | 114,112 | 4.7 | |
| 2015 | 2016 | 24,633 | 111,163 | 4.5 | |
| 2016 | 2017 | 25,596 | 126,445 | 4.9 | |
| 2017 | 2018 | 21,825 | 110,554 | 5.1 | |
| 2018 | 2019 | 26,324 | 132,090 | 5.0 | |
| 2019 | 2020 | 29,244 | 145,833 | 5.0 | |
| Harvest in year 2 | 2009 | 2011 | 13,772 | 66,606 | 4.8 |
| 2010 | 2012 | 13,053 | 64,178 | 4.9 | |
| 2011 | 2013 | 11,283 | 57,073 | 5.1 | |
| 2012 | 2014 | 13,712 | 76,305 | 5.6 | |
| 2013 | 2015 | 10,910 | 56,984 | 5.2 | |
| 2014 | 2016 | 10,940 | 51,321 | 4.7 | |
| 2015 | 2017 | 11,094 | 63,262 | 5.7 | |
| 2016 | 2018 | 7,165 | 45,224 | 6.3 | |
| 2017 | 2019 | 12,212 | 70,860 | 5.8 | |
| 2018 | 2020 | 8,169 | 45,088 | 5.5 |
| Year | Grilse (January-August) | Pre-salmon (September-December) | ||||
|---|---|---|---|---|---|---|
| Number | Tonnes | Average weight (kg) | Number | Tonnes | Average weight (kg) | |
| 2011 | 7,604 | 35,146 | 4.6 | 11,090 | 55,959 | 5.0 |
| 2012 | 11,337 | 53,216 | 4.7 | 10,165 | 44,528 | 4.4 |
| 2013 | 9,618 | 47,496 | 4.9 | 11,646 | 58,665 | 5.0 |
| 2014 | 9,048 | 46,686 | 5.2 | 11,268 | 55,311 | 4.9 |
| 2015 | 11,243 | 53,930 | 4.8 | 12,795 | 60,182 | 4.7 |
| 2016 | 13,463 | 59,853 | 4.4 | 11,170 | 51,310 | 4.6 |
| 2017 | 13,523 | 68,116 | 5.0 | 12,073 | 58,329 | 4.8 |
| 2018 | 10,815 | 53,244 | 4.9 | 11,010 | 57,310 | 5.2 |
| 2019 | 14,495 | 72,243 | 5.0 | 11,829 | 59,847 | 5.1 |
| 2020 | 18,328 | 88,025 | 4.8 | 10,916 | 57,808 | 5.3 |
| Year | 2011 | 2012 | 2013 | 2014 | 2015 | 2016 | 2017 | 2018 | 2019 | 2020 |
|---|---|---|---|---|---|---|---|---|---|---|
| Growth stage | - | - | - | - | - | - | - | - | - | - |
| Input year fish | <1 | <1 | 0 | <1 | <1 | <1 | 0 | <1 | <1 | <1 |
| Grilse | 22 | 33 | 29 | 26 | 31 | 37 | 36 | 34 | 35 | 46 |
| Pre-salmon | 35 | 27 | 36 | 31 | 35 | 31 | 31 | 36 | 29 | 30 |
| Year 2 salmon | 42 | 39 | 35 | 42 | 33 | 31 | 33 | 29 | 35 | 23 |
Survival and Production in Smolt Year Classes
| Year of smolt input | Smolt input (000's) | Harvest year 0 | Harvest year 1 | Harvest year 2 | Total % of year class harvested (survival) | Year class weight (tonnes) | Yield per smolt (kg) | |||||||||
|---|---|---|---|---|---|---|---|---|---|---|---|---|---|---|---|---|
| Number (000's) | Weight (tonnes) | Mean weight (kg) | % harvest | Number (000's) | Weight (tonnes) | Mean weight (kg) | % harvest | Number (000's) | Weight (tonnes) | Mean weight (kg) | % harvest | |||||
| 2001 | 48,643 | 557 | 1,227 | 2.2 | 1.1 | 23,528 | 90,230 | 3.8 | 48.4 | 15,619 | 73,255 | 4.7 | 32.1 | 81.6 | 164,712 | 3.39 |
| 2002 | 50,086 | 272 | 824 | 3.0 | 0.5 | 22,602 | 96,205 | 4.3 | 45.1 | 15,555 | 71,988 | 4.6 | 31.1 | 76.7 | 169,017 | 3.37 |
| 2003 | 43,083 | 82 | 276 | 3.4 | 0.2 | 19,596 | 85,792 | 4.4 | 45.5 | 13,920 | 61,850 | 4.4 | 32.3 | 78.0 | 147,918 | 3.43 |
| 2004 | 39,041 | 168 | 319 | 1.9 | 0.4 | 15,075 | 67,738 | 4.5 | 38.6 | 14,237 | 67,537 | 4.7 | 36.5 | 75.5 | 135,594 | 3.47 |
| 2005 | 37,168 | 0 | 0 | - | 0 | 14,036 | 64,099 | 4.6 | 37.8 | 14,999 | 69,000 | 4.6 | 40.3 | 78.1 | 133,099 | 3.58 |
| 2006 | 41,091 | 115 | 211 | 1.8 | 0.3 | 13,787 | 60,890 | 4.4 | 33.5 | 15,881 | 73,631 | 4.6 | 38.6 | 72.5 | 134,732 | 3.28 |
| 2007 | 37,853 | 23 | 40 | 1.7 | 0.06 | 13,011 | 54,759 | 4.2 | 34.4 | 14,133 | 66,448 | 4.7 | 37.3 | 71.8 | 121,247 | 3.20 |
| 2008 | 36,662 | 116 | 216 | 1.9 | 0.3 | 16,338 | 77,621 | 4.7 | 44.6 | 13,666 | 68,070 | 5.0 | 37.3 | 82.2 | 145,907 | 3.98 |
| 2009 | 38,548 | 81 | 178 | 2.2 | 0.2 | 18,266 | 85,826 | 4.7 | 47.4 | 13,772 | 66,606 | 4.8 | 35.7 | 83.3 | 152,610 | 3.96 |
| 2010 | 38,490 | 128 | 268 | 2.1 | 0.3 | 18,694 | 91,105 | 4.9 | 48.6 | 13,053 | 64,178 | 4.9 | 33.9 | 82.8 | 155,551 | 4.04 |
| 2011 | 42,733 | 109 | 307 | 2.8 | 0.3 | 21,502 | 97,744 | 4.5 | 50.3 | 11,283 | 57,073 | 5.1 | 26.4 | 77.0 | 155,124 | 3.63 |
| 2012 | 41,094 | 127 | 301 | 2.4 | 0.3 | 21,264 | 106,161 | 5.0 | 51.7 | 13,712 | 76,305 | 5.6 | 33.4 | 85.4 | 182,767 | 4.45 |
| 2013 | 40,936 | 0 | 0 | - | 0 | 20,316 | 101,997 | 5.0 | 49.6 | 10,910 | 56,984 | 5.2 | 26.7 | 76.3 | 158,981 | 3.88 |
| 2014 | 48,112 | 286 | 720 | 2.5 | 0.6 | 24,038 | 114,112 | 4.7 | 50.0 | 10,940 | 51,321 | 4.7 | 22.7 | 73.3 | 166,153 | 3.45 |
| 2015 | 45,465 | 223 | 626 | 2.8 | 0.5 | 24,633 | 111,163 | 4.5 | 54.2 | 11,094 | 63,262 | 5.7 | 24.4 | 79.1 | 175,051 | 3.85 |
| 2016 | 42,957 | 114 | 333 | 2.9 | 0.3 | 25,596 | 126,445 | 4.9 | 59.6 | 7,165 | 45,224 | 6.3 | 16.7 | 76.6 | 172,002 | 4.00 |
| 2017 | 46,116 | 0 | 0 | - | 0 | 21,825 | 110,554 | 5.1 | 47.3 | 12,212 | 70,860 | 5.8 | 26.5 | 73.8 | 181,414 | 3.93 |
| 2018 | 45,513 | 84 | 247 | 2.9 | 0.2 | 26,324 | 132,090 | 5.0 | 57.8 | 8,169 | 45,088 | 5.5 | 17.9 | 75.9 | 177,425 | 3.90 |
| 2019 | 52,990 | 319 | 931 | 2.9 | 0.6 | 29,244 | 145,833 | 5.0 | 55.2 | |||||||
| 2020 | 52,492 | 323 | 1,208 | 3.7 | 0.6 | |||||||||||
In 2018, the last year for which survival can be calculated, the survival rate from smolt input to harvest increased to 75.9%. Of the 2019 year class, 55.8% of the input has been harvested, 2.2% lower than the average harvest of fish one year after input in the 2018 year class. In 2020, 0.6% of the fish were harvested from the 2020 input. This was the same as the proportion of fish harvested from the same year class in 2019.
Smolts to Sea
| Year | Smolts put to sea (000's) | Total (000's) | Scottish Origin | English Origin | Other Origin | ||||
|---|---|---|---|---|---|---|---|---|---|
| S½ | S1 | S1½ | % | (000's) | % | (000's) | % | ||
| 2011 | 17,721 | 25,012 | 0 | 42,733 | 96 | 1,765 | 4 | 0 | 0 |
| 2012 | 17,334 | 23,480 | 280 | 41,094 | 96 | 1,510 | 4 | 0 | 0 |
| 2013 | 19,262 | 21,534 | 140 | 40,936 | 97 | 1,169 | 3 | 0 | 0 |
| 2014 | 23,758 | 24,212 | 142 | 48,112 | 94 | 893 | 2 | 2,072 | 4 |
| 2015 | 22,886 | 22,569 | 10 | 45,465 | 96 | 938 | 2 | 1,082 | 2 |
| 2016 | 22,052 | 20,905 | 0 | 42,957 | 97 | 1,048 | 2 | 611 | 1 |
| 2017 | 25,490 | 20,626 | 0 | 46,116 | 97 | 976 | 2 | 300 | <1 |
| 2018 | 21,767 | 23,746 | 0 | 45,513 | 96 | 1,318 | 3 | 364 | <1 |
| 2019 | 24,525 | 28,465 | 0 | 52,990 | 98 | 751 | 1 | 297 | <1 |
| 2020 | 24,809 | 27,683 | 0 | 52,492 | 96 | 1,070 | 2 | 1,130 | 2 |
The total number of smolts put to sea in 2020 was over 52.4 million. This smolt input comprised S½ (47.3%) and S1s (52.7%). Four percent of the smolts stocked to Scottish salmon farms were sourced from outwith Scotland, 2% of which came from sources outwith GB. This was an increase of 2% compared with the proportion observed in 2019.
Survival and Production in Smolt Year Classes by Production Area
| Region | Smolts put to sea (000's) | Harvest in year 0 | Harvest in year 1 | Harvest in year 2 | Total Harvest | ||||||||
|---|---|---|---|---|---|---|---|---|---|---|---|---|---|
| Year | No | Year | No | % | Year | No | % | Year | No | % | No | % | |
| North West | 2009 | 9,986 | 2009 | 42 | 0.4 | 2010 | 7,045 | 70.5 | 2011 | 2,003 | 20.1 | 9,090 | 91.0 |
| 2010 | 9,924 | 2010 | 117 | 1.2 | 2011 | 6,324 | 63.7 | 2012 | 2,802 | 28.2 | 9,243 | 93.1 | |
| 2011 | 12,605 | 2011 | 53 | 0.4 | 2012 | 7,937 | 63.0 | 2013 | 1,744 | 13.8 | 9,734 | 77.2 | |
| 2012 | 11,588 | 2012 | 127 | 1.1 | 2013 | 7,179 | 62.0 | 2014 | 2,623 | 22.6 | 9,929 | 85.7 | |
| 2013 | 10,975 | 2013 | 0 | 0 | 2014 | 6,549 | 59.7 | 2015 | 1,695 | 15.4 | 8,244 | 75.1 | |
| 2014 | 17,543 | 2014 | 191 | 1.1 | 2015 | 9,649 | 55.0 | 2016 | 3,768 | 21.5 | 13,608 | 77.6 | |
| 2015 | 8,646 | 2015 | 223 | 2.6 | 2016 | 6,122 | 70.8 | 2017 | 1,695 | 19.6 | 8,040 | 93.0 | |
| 2016 | 14,534 | 2016 | 114 | 0.8 | 2017 | 9,711 | 66.8 | 2018 | 1,882 | 12.9 | 11,707 | 80.5 | |
| 2017 | 9,527 | 2017 | 0 | 0 | 2018 | 3,809 | 40.0 | 2019 | 1,739 | 18.3 | 5,548 | 58.2 | |
| 2018 | 15,177 | 2018 | 84 | 0.6 | 2019 | 10,947 | 72.1 | 2020 | 1,852 | 12.2 | 12,883 | 84.9 | |
| 2019 | 15,071 | 2019 | 205 | 1.4 | 2020 | 7,838 | 52.0 | ||||||
| 2020 | 19,075 | 2020 | 126 | 0.7 | |||||||||
| Orkney | 2009 | 1,154 | 2009 | 0 | 0 | 2010 | 741 | 64.2 | 2011 | 95 | 8.2 | 836 | 72.4 |
| 2010 | 2,557 | 2010 | 0 | 0 | 2011 | 1,126 | 44.0 | 2012 | 936 | 36.6 | 2,062 | 80.6 | |
| 2011 | 2,718 | 2011 | 0 | 0 | 2012 | 1,203 | 44.3 | 2013 | 765 | 28.1 | 1,968 | 72.4 | |
| 2012 | 2,727 | 2012 | 0 | 0 | 2013 | 1,422 | 52.1 | 2014 | 1,167 | 42.8 | 2,589 | 94.9 | |
| 2013 | 2,104 | 2013 | 0 | 0 | 2014 | 1,023 | 48.6 | 2015 | 512 | 24.3 | 1,535 | 72.9 | |
| 2014 | 2,829 | 2014 | 0 | 0 | 2015 | 1,412 | 49.9 | 2016 | 1,244 | 44.0 | 2,656 | 93.9 | |
| 2015 | 3,266 | 2015 | 0 | 0 | 2016 | 1,580 | 48.4 | 2017 | 1,521 | 46.6 | 3,101 | 95.0 | |
| 2016 | 3,050 | 2016 | 0 | 0 | 2017 | 1,184 | 38.8 | 2018 | 1,571 | 51.5 | 2,755 | 90.3 | |
| 2017 | 3,524 | 2017 | 0 | 0 | 2018 | 1,699 | 48.2 | 2019 | 835 | 23.7 | 2,534 | 71.9 | |
| 2018 | 3,616 | 2018 | 0 | 0 | 2019 | 2,068 | 57.2 | 2020 | 1,382 | 38.2 | 3,450 | 95.4 | |
| 2019 | 4,670 | 2019 | 0 | 0 | 2020 | 2,230 | 47.8 | ||||||
| 2020 | 4,578 | 2020 | 0 | 0 | |||||||||
| Shetland | 2009 | 10,031 | 2009 | 29 | 0.3 | 2010 | 4,201 | 41.9 | 2011 | 3,234 | 32.2 | 7,464 | 74.4 |
| 2010 | 11,573 | 2010 | 0 | 0 | 2011 | 4,134 | 35.7 | 2012 | 4,292 | 37.1 | 8,426 | 72.8 | |
| 2011 | 11,206 | 2011 | 49 | 0.4 | 2012 | 4,911 | 43.8 | 2013 | 2,709 | 24.2 | 7,669 | 68.4 | |
| 2012 | 11,389 | 2012 | 0 | 0 | 2013 | 4,995 | 43.9 | 2014 | 4,022 | 35.3 | 9,017 | 79.2 | |
| 2013 | 9,956 | 2013 | 0 | 0 | 2014 | 4,289 | 43.1 | 2015 | 3,034 | 30.5 | 7,323 | 73.6 | |
| 2014 | 11,309 | 2014 | 0 | 0 | 2015 | 5,042 | 44.6 | 2016 | 2,663 | 23.5 | 7,705 | 68.1 | |
| 2015 | 9,040 | 2015 | 0 | 0 | 2016 | 5,322 | 58.9 | 2017 | 1,592 | 17.6 | 6,914 | 76.5 | |
| 2016 | 10,640 | 2016 | 0 | 0 | 2017 | 6,012 | 56.5 | 2018 | 1,723 | 16.2 | 7,735 | 72.7 | |
| 2017 | 8,539 | 2017 | 0 | 0 | 2018 | 4,579 | 53.6 | 2019 | 2,005 | 23.5 | 6,584 | 77.1 | |
| 2018 | 11,312 | 2018 | 0 | 0 | 2019 | 4,430 | 39.2 | 2020 | 1,813 | 16.0 | 6,243 | 55.2 | |
| 2019 | 7,613 | 2019 | 114 | 1.5 | 2020 | 4,955 | 65.1 | ||||||
| 2020 | 10,072 | 2020 | 84 | 0.8 | |||||||||
| South West | 2009 | 8,200 | 2009 | 10 | 0.1 | 2010 | 2,700 | 32.9 | 2011 | 4,697 | 57.3 | 7,407 | 90.3 |
| 2010 | 6,565 | 2010 | 12 | 0.2 | 2011 | 3,000 | 45.7 | 2012 | 2,648 | 40.3 | 5,660 | 86.2 | |
| 2011 | 7,493 | 2011 | 0 | 0 | 2012 | 2,673 | 35.7 | 2013 | 3,706 | 49.4 | 6,379 | 85.1 | |
| 2012 | 7,363 | 2012 | 0 | 0 | 2013 | 2,841 | 38.6 | 2014 | 3,863 | 52.5 | 6,704 | 91.1 | |
| 2013 | 7,801 | 2013 | 0 | 0 | 2014 | 3,202 | 41.0 | 2015 | 3,564 | 45.7 | 6,766 | 86.7 | |
| 2014 | 6,981 | 2014 | 95 | 1.4 | 2015 | 3,771 | 54.0 | 2016 | 2,023 | 29.0 | 5,889 | 84.4 | |
| 2015 | 11,156 | 2015 | 0 | 0 | 2016 | 4,944 | 44.3 | 2017 | 3,643 | 32.7 | 8,587 | 77.0 | |
| 2016 | 8,093 | 2016 | 0 | 0 | 2017 | 4,643 | 57.4 | 2018 | 1,622 | 20.0 | 6,265 | 77.4 | |
| 2017 | 11,106 | 2017 | 0 | 0 | 2018 | 5,330 | 48.0 | 2019 | 3,648 | 32.8 | 8,978 | 80.8 | |
| 2018 | 7,177 | 2018 | 0 | 0 | 2019 | 4,799 | 66.9 | 2020 | 1,150 | 16.0 | 5,949 | 82.9 | |
| 2019 | 11,100 | 2019 | 0 | 0 | 2020 | 6,126 | 55.2 | ||||||
| 2020 | 9,485 | 2020 | 112 | 1.2 | |||||||||
| Western Isles | 2009 | 9,177 | 2009 | 0 | 0 | 2010 | 3,579 | 39.0 | 2011 | 3,743 | 40.8 | 7,322 | 79.8 |
| 2010 | 7,870 | 2010 | 0 | 0 | 2011 | 4,110 | 52.2 | 2012 | 2,375 | 30.2 | 6,485 | 82.4 | |
| 2011 | 8,711 | 2011 | 7 | 0.1 | 2012 | 4,778 | 54.9 | 2013 | 2,358 | 27.1 | 7,143 | 82.0 | |
| 2012 | 8,027 | 2012 | 0 | 0 | 2013 | 4,827 | 60.1 | 2014 | 2,037 | 25.4 | 6,864 | 85.5 | |
| 2013 | 10,100 | 2013 | 0 | 0 | 2014 | 5,254 | 52.0 | 2015 | 2,105 | 20.8 | 7,359 | 72.8 | |
| 2014 | 9,451 | 2014 | 0 | 0 | 2015 | 4,164 | 44.1 | 2016 | 1,242 | 13.1 | 5,406 | 57.2 | |
| 2015 | 13,357 | 2015 | 0 | 0 | 2016 | 6,665 | 49.9 | 2017 | 2,643 | 19.8 | 9,308 | 69.7 | |
| 2016 | 6,640 | 2016 | 0 | 0 | 2017 | 4,046 | 60.9 | 2018 | 367 | 5.5 | 4,413 | 66.4 | |
| 2017 | 13,420 | 2017 | 0 | 0 | 2018 | 6,408 | 47.7 | 2019 | 3,985 | 29.7 | 10,393 | 77.4 | |
| 2018 | 8,231 | 2018 | 0 | 0 | 2019 | 4,080 | 49.6 | 2020 | 1,972 | 24.0 | 6,052 | 73.5 | |
| 2019 | 14,536 | 2019 | 0 | 0 | 2020 | 8,094 | 55.7 | ||||||
| 2020 | 9,282 | 2020 | 0 | 0 | |||||||||
The practice of putting smolts to sea in one region and subsequently moving them to another sea water site in another region for harvest can lead to an overestimation of survival in some regions and underestimation in others.
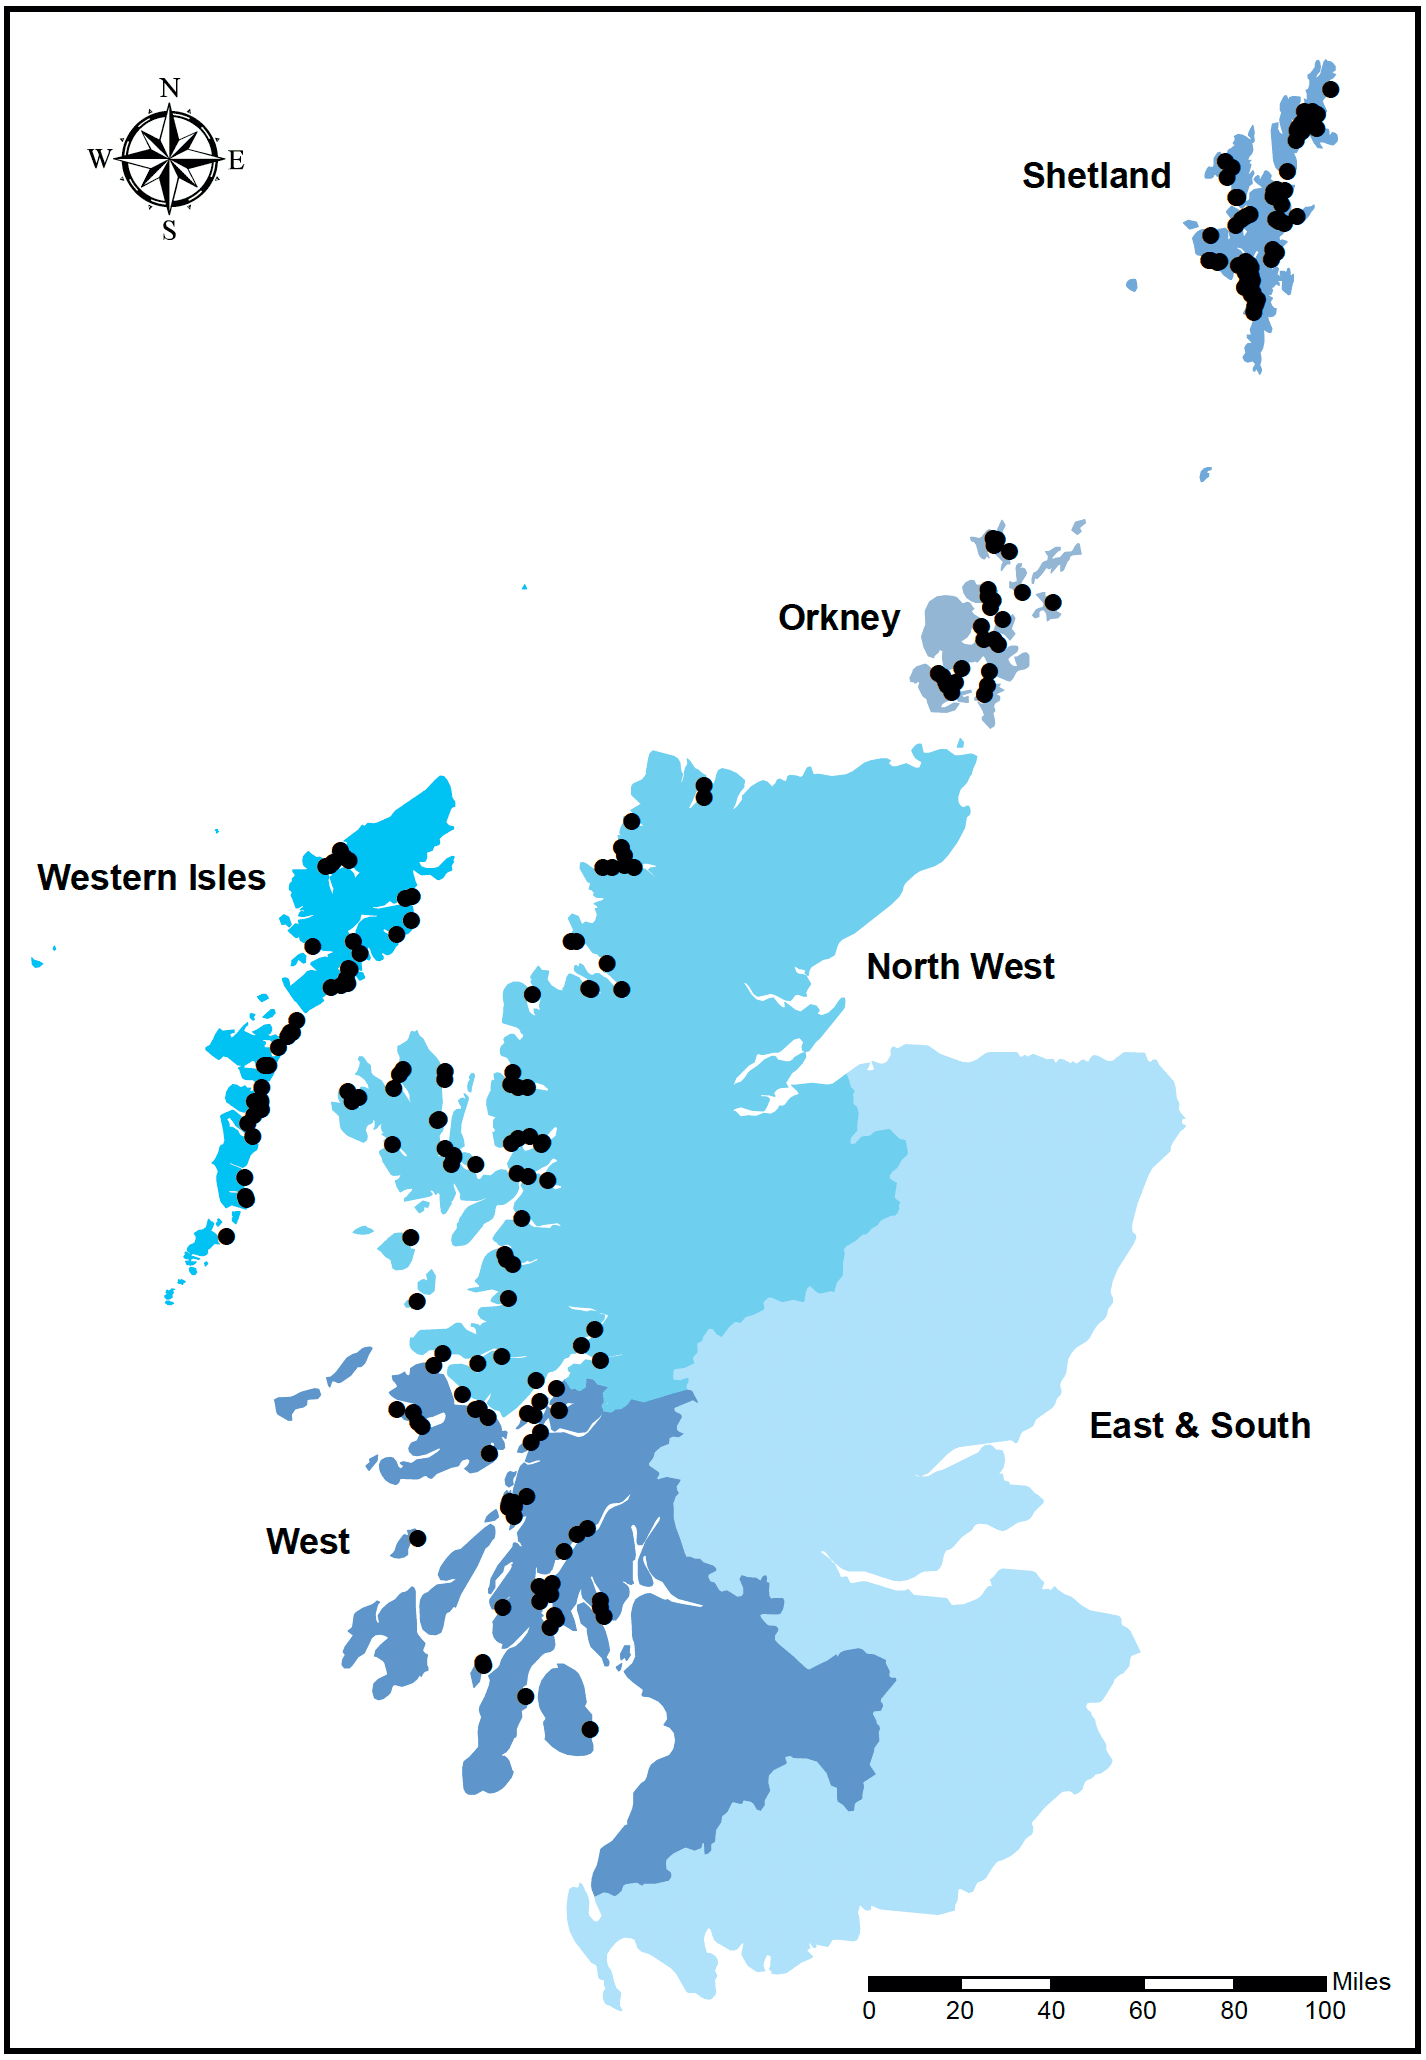
© Crown copyright and database rights 2020 OS (100024655)
Staffing
| Year | Full-time Male | Full-time Female | Total Full-time | Part-time Male | Part-time Female | Total Part-time | Total Staff | Productivity (tonnes/person) |
|---|---|---|---|---|---|---|---|---|
| 2011 | 847 | 76 | 923 | 62 | 28 | 90 | 1,013 | 156.0 |
| 2012 | 870 | 74 | 944 | 80 | 35 | 115 | 1,059 | 153.2 |
| 2013 | 997 | 84 | 1,081 | 74 | 25 | 99 | 1,180 | 138.3 |
| 2014 | 1,082 | 109 | 1,191 | 98 | 36 | 134 | 1,325 | 135.1 |
| 2015 | 1,125 | 131 | 1,256 | 70 | 37 | 107 | 1,363 | 126.0 |
| 2016 | 1,182 | 197 | 1,379 | 67 | 40 | 107 | 1,486 | 109.6 |
| 2017 | 1,175 | 145 | 1,320 | 59 | 10 | 69 | 1,389 | 136.6 |
| 2018 | 1,273 | 142 | 1,415 | 35 | 16 | 51 | 1,466 | 106.4 |
| 2019 | 1,425 | 166 | 1,591 | 35 | 25 | 60 | 1,651 | 123.5 |
| 2020 | 1,412 | 145 | 1,557 | 45 | 28 | 73 | 1,630 | 117.9 |
In 2020, the total number of staff employed in salmon production was 1,630, a decrease of 21 compared with 2019. The staffing figures collected refer specifically to the production of Atlantic salmon and do not include figures for staff involved with processing or marketing activities. Productivity decreased from 123.5 to 117.9 tonnes produced per person.
Production Methods
| Method | Number of sites | Total capacity (000's cubic metres) | Production (tonnes) | ||||||
|---|---|---|---|---|---|---|---|---|---|
| 2018 | 2019 | 2020 | 2018 | 2019 | 2020 | 2018 | 2019 | 2020 | |
| Seawater tanks | 4 | 2 | 1 | 7.1 | 6.3 | 5.1 | 35 | 28 | 18 |
| Seawater cages | 217 | 224 | 231 | 19,922 | 21,628 | 22,818 | 155,990 | 203,853 | 192,111 |
| For cage sites: ratio of production (kg) to cage capacity (m3) | 7.8 | 9.4 | 8.4 | ||||||
In 2020, the majority of fish were produced in seawater cages. There were 18 tonnes of production from seawater tank sites in 2020. This reflects the high installation and running costs incurred in operating seawater tank systems. Most seawater tank capacity has been re-deployed for the production of other species of marine finfish or salmon broodstock.
Sea cage capacity increased by 1,190,000 m3 during 2020 and the number of sea cage sites in production increased by seven. Production efficiency in sea cages, measured as the ratio of fish weight in kilograms produced per cubic metre, decreased from 9.4 kg/m3 in 2019 to 8.4 kg/m3 in 2020.
Scale of Production by Site
| Production grouping (tonnes) | 0 | 1-50 | 51-100 | 101-200 | 201-500 | 501-1,000 | >1,000 | Total | |
|---|---|---|---|---|---|---|---|---|---|
| Sites* | Tonnes | ||||||||
| 2011 | 106 | 9 | 7 | 9 | 28 | 29 | 66 | 254 | 158,018 |
| 2012 | 115 | 3 | 5 | 9 | 25 | 33 | 67 | 257 | 162,223 |
| 2013 | 112 | 9 | 3 | 12 | 18 | 36 | 67 | 257 | 163,234 |
| 2014 | 117 | 8 | 1 | 9 | 26 | 29 | 70 | 260 | 179,022 |
| 2015 | 115 | 2 | 1 | 9 | 26 | 26 | 75 | 254 | 171,722 |
| 2016 | 117 | 3 | 3 | 9 | 22 | 26 | 73 | 253 | 162,817 |
| 2017 | 93 | 2 | 0 | 8 | 13 | 33 | 77 | 226 | 189,707 |
| 2018 | 100 | 6 | 2 | 6 | 17 | 26 | 64 | 221 | 156,025 |
| 2019 | 80 | 8 | 7 | 1 | 17 | 24 | 89 | 226 | 203,881 |
| 2020 | 101 | 6 | 2 | 7 | 17 | 18 | 81 | 232 | 192,129 |
| 2011 | 0 | 0.2 | 0.3 | 0.8 | 6.4 | 13.4 | 78.9 | - | - |
| 2012 | 0 | <0.1 | 0.2 | 0.9 | 5.0 | 15.0 | 78.8 | - | - |
| 2013 | 0 | 0.1 | 0.1 | 1.1 | 4.0 | 16.7 | 78.0 | - | - |
| 2014 | 0 | 0.1 | <0.1 | 0.8 | 5.0 | 12.0 | 82.0 | - | - |
| 2015 | 0 | <0.1 | <0.1 | 0.9 | 5.0 | 11.6 | 82.4 | - | - |
| 2016 | 0 | <0.1 | 0.1 | 0.8 | 4.6 | 11.7 | 82.8 | - | - |
| 2017 | 0 | <0.1 | 0 | 0.6 | 3.2 | 13.9 | 82.3 | - | - |
| 2018 | 0 | <0.1 | <0.1 | 0.6 | 3.7 | 13.5 | 82.0 | - | - |
| 2019 | 0 | <0.1 | 0.3 | <0.1 | 2.8 | 9.7 | 87.1 | - | - |
| 2020 | 0 | 0.1 | 0.1 | 0.5 | 2.8 | 6.9 | 89.6 | - | - |
* Includes farms stocked but having no production.
In 2020, the number of sites with no production increased by 21 and the number producing 1 to 500 tonnes decreased by one. The number of sites producing over 500 tonnes decreased by 14 and the trend towards production in larger sites continued, with 89.6% of production being derived from sites producing over 1,000 tonnes.
Company Productivity
| Total Tonnage | 0-100 | 101-200 | 201-400 | 401-700 | 701-1,000 | 1,001-2,000 | >2,000 | Total | |
|---|---|---|---|---|---|---|---|---|---|
| No. of companies | 2019 | 4 | 0 | 0 | 0 | 0 | 1 | 6 | 11 |
| 2020 | 4 | 0 | 0 | 0 | 0 | 1 | 6 | 11 | |
| No. of tonnes | 2019 | 28 | 0 | 0 | 0 | 0 | 1,636 | 202,217 | 203,881 |
| 2020 | 18 | 0 | 0 | 0 | 0 | 1,722 | 190,389 | 192,129 | |
| Staff (total) | 2019 | 13 | 0 | 0 | 0 | 0 | 36 | 1,602 | 1,651 |
| 2020 | 36 | 0 | 0 | 0 | 0 | 40 | 1,554 | 1,630 | |
| Productivity (tonnes/person) | 2019 | 2 | - | - | - | - | 45 | 126 | 124 |
| 2020 | 0.5 | - | - | - | - | 43 | 123 | 118 | |
The greatest productivity of 123 tonnes per person was achieved in the companies producing over 2,000 tonnes. The least productivity of 0.5 tonnes per person was from the companies producing between 0-100
tonnes. In comparison with 2019, the average company productivity decreased from 124 to 118 tonnes per person. Overall, production was dominated by six companies in 2020 which between them accounted for 99% of Scotland's farmed Atlantic salmon production.
Staff and Production by Production Area
| Region |
Year |
Staff | Annual Production | Productivity (t/person) | Year of input | Grilse | Pre-salmon | Year 2 Salmon | |||||
|---|---|---|---|---|---|---|---|---|---|---|---|---|---|
| F/T | P/T | Tonnes | Mean weight (kg) | Tonnes | Mean weight (kg) | Tonnes | Mean weight (kg) | Tonnes | Mean weight (kg) | ||||
| North West | 2011 | 303 | 38 | 41,656 | 122 | 174 | 3.2 | 13,152 | 4.3 | 16,879 | 5.1 | 11,451 | 5.7 |
| 2012 | 300 | 40 | 50,987 | 150 | 301 | 2.4 | 31,121 | 4.7 | 5,842 | 4.7 | 13,723 | 4.9 | |
| 2013 | 350 | 48 | 43,320 | 109 | 0 | - | 17,937 | 4.9 | 16,417 | 4.7 | 8,966 | 5.1 | |
| 2014 | 348 | 46 | 50,873 | 129 | 511 | 2.7 | 26,440 | 5.3 | 8,731 | 5.5 | 15,191 | 5.8 | |
| 2015 | 382 | 66 | 54,741 | 122 | 626 | 2.8 | 18,046 | 4.8 | 26,897 | 4.6 | 9,172 | 5.4 | |
| 2016 | 538 | 30 | 46,917 | 83 | 333 | 2.9 | 21,576 | 4.7 | 7,515 | 5.0 | 17,493 | 4.6 | |
| 2017 | 437 | 11 | 55,690 | 124 | 0 | - | 32,113 | 5.1 | 14,920 | 4.4 | 8,657 | 5.1 | |
| 2018 | 453 | 17 | 30,948 | 66 | 247 | 2.9 | 11,899 | 4.9 | 7,780 | 5.6 | 11,022 | 5.9 | |
| 2019 | 662 | 32 | 66,633 | 96 | 472 | 2.3 | 35,020 | 5.0 | 21,873 | 5.5 | 9,268 | 5.3 | |
| 2020 | 546 | 19 | 48,762 | 86 | 539 | 4.2 | 24,065 | 4.7 | 13,852 | 5.2 | 10,306 | 5.7 | |
| 2021 | 86,934* | ||||||||||||
| Orkney | 2011 | 69 | 0 | 6,369 | 92 | 0 | - | 3,508 | 5.1 | 2,355 | 5.4 | 506 | 5.3 |
| 2012 | 65 | 6 | 11,694 | 165 | 0 | - | 3,532 | 5.3 | 2,720 | 5.1 | 5,442 | 5.8 | |
| 2013 | 86 | 3 | 11,479 | 129 | 0 | - | 3,191 | 5.1 | 4,491 | 5.7 | 3,797 | 5.0 | |
| 2014 | 90 | 6 | 13,029 | 136 | 0 | - | 980 | 5.5 | 5,045 | 6.0 | 7,004 | 6.0 | |
| 2015 | 93 | 1 | 11,074 | 118 | 0 | - | 1,386 | 5.0 | 6,129 | 5.4 | 3,559 | 6.9 | |
| 2016 | 102 | 8 | 14,752 | 134 | 0 | - | 3,491 | 4.6 | 4,668 | 5.7 | 6,593 | 5.3 | |
| 2017 | 108 | 9 | 16,756 | 143 | 0 | - | 3,215 | 5.3 | 3,823 | 6.6 | 9,718 | 6.4 | |
| 2018 | 93 | 0 | 20,956 | 225 | 0 | - | 2,808 | 5.2 | 6,906 | 6.0 | 11,242 | 7.2 | |
| 2019 | 110 | 1 | 17,758 | 160 | 0 | - | 6,393 | 5.9 | 5,952 | 6.1 | 5,413 | 6.5 | |
| 2020 | 138 | 13 | 21,612 | 143 | 0 | - | 4,383 | 5.8 | 8,875 | 6.0 | 8,354 | 6.0 | |
| 2021 | 23,104* | ||||||||||||
| Shetland | 2011 | 189 | 22 | 35,493 | 168 | 118 | 2.4 | 4,611 | 4.7 | 16,071 | 5.1 | 14,693 | 4.5 |
| 2012 | 188 | 16 | 43,010 | 211 | 0 | - | 6,083 | 4.3 | 15,784 | 4.5 | 21,143 | 4.9 | |
| 2013 | 210 | 14 | 36,694 | 164 | 0 | - | 5,822 | 4.5 | 18,121 | 4.9 | 12,751 | 4.7 | |
| 2014 | 224 | 24 | 46,369 | 187 | 0 | - | 6,196 | 5.7 | 17,604 | 5.5 | 22,569 | 5.6 | |
| 2015 | 228 | 19 | 42,786 | 173 | 0 | - | 11,134 | 5.4 | 14,939 | 5.0 | 16,713 | 5.5 | |
| 2016 | 200 | 23 | 37,464 | 168 | 0 | - | 11,844 | 4.4 | 12,906 | 4.9 | 12,714 | 4.8 | |
| 2017 | 207 | 12 | 38,908 | 178 | 0 | - | 14,132 | 4.6 | 15,284 | 5.2 | 9,492 | 6.0 | |
| 2018 | 206 | 3 | 35,947 | 172 | 0 | - | 12,741 | 5.4 | 12,835 | 5.8 | 10,371 | 6.0 | |
| 2019 | 227 | 6 | 36,141 | 155 | 459 | 4.0 | 11,478 | 5.2 | 12,451 | 5.6 | 11,753 | 5.9 | |
| 2020 | 280 | 12 | 40,749 | 140 | 356 | 4.2 | 16,452 | 5.6 | 12,743 | 6.3 | 11,198 | 6.2 | |
| 2021 | 42,131* | ||||||||||||
| South West | 2011 | 212 | 17 | 37,157 | 162 | 0 | - | 3,618 | 4.8 | 10,899 | 4.8 | 22,640 | 4.8 |
| 2012 | 221 | 24 | 26,850 | 110 | 0 | - | 9,315 | 5.4 | 4,508 | 4.8 | 13,027 | 4.9 | |
| 2013 | 251 | 19 | 34,924 | 129 | 0 | - | 5,847 | 4.8 | 9,111 | 5.6 | 19,966 | 5.4 | |
| 2014 | 279 | 29 | 34,976 | 114 | 209 | 2.2 | 4,278 | 5.1 | 10,476 | 4.4 | 20,013 | 5.2 | |
| 2015 | 302 | 12 | 35,911 | 114 | 0 | - | 10,356 | 4.7 | 6,686 | 4.3 | 18,869 | 5.3 | |
| 2016 | 305 | 26 | 31,022 | 94 | 0 | - | 12,349 | 4.3 | 9,246 | 4.4 | 9,427 | 4.7 | |
| 2017 | 316 | 18 | 44,575 | 133 | 0 | - | 11,206 | 5.7 | 12,903 | 4.8 | 20,466 | 5.6 | |
| 2018 | 375 | 14 | 37,506 | 96 | 0 | - | 9,690 | 5.1 | 17,246 | 5.0 | 10,570 | 6.5 | |
| 2019 | 338 | 7 | 44,881 | 130 | 0 | - | 8,071 | 5.4 | 13,846 | 4.2 | 22,964 | 6.3 | |
| 2020 | 331 | 17 | 36,367 | 105 | 313 | 2.8 | 16,394 | 4.9 | 13,519 | 4.8 | 6,141 | 5.3 | |
| 2021 | 47,189* | ||||||||||||
| Western Isles | 2011 | 150 | 13 | 37,343 | 229 | 15 | 2.1 | 10,257 | 4.7 | 9,755 | 5.0 | 17,316 | 4.6 |
| 2012 | 170 | 29 | 29,682 | 149 | 0 | - | 3,165 | 3.7 | 15,674 | 4.0 | 10,843 | 4.6 | |
| 2013 | 184 | 15 | 36,817 | 185 | 0 | - | 14,699 | 5.2 | 10,525 | 5.2 | 11,593 | 4.9 | |
| 2014 | 250 | 29 | 33,775 | 121 | 0 | - | 8,792 | 4.5 | 13,455 | 4.1 | 11,528 | 5.7 | |
| 2015 | 251 | 9 | 27,210 | 105 | 0 | - | 13,008 | 4.4 | 5,531 | 4.5 | 8,671 | 4.1 | |
| 2016 | 234 | 20 | 32,662 | 129 | 0 | - | 10,593 | 4.2 | 16,975 | 4.1 | 5,094 | 4.1 | |
| 2017 | 252 | 19 | 33,778 | 125 | 0 | - | 7,450 | 4.7 | 11,399 | 4.6 | 14,929 | 5.6 | |
| 2018 | 288 | 17 | 30,668 | 101 | 0 | - | 16,106 | 4.5 | 12,543 | 4.4 | 2,019 | 5.5 | |
| 2019 | 254 | 14 | 38,468 | 144 | 0 | - | 11,281 | 4.1 | 5,725 | 4.2 | 21,462 | 5.4 | |
| 2020 | 262 | 12 | 44,639 | 163 | 0 | - | 26,731 | 4.3 | 8,819 | 4.6 | 9,089 | 4.6 | |
| 2021 | 36,642* | ||||||||||||
| Scotland Total | 2011 | 923 | 90 | 158,018 | 156 | 307 | 2.8 | 35,146 | 4.6 | 55,959 | 5.0 | 66,606 | 4.8 |
| 2012 | 944 | 115 | 162,223 | 153 | 301 | 2.4 | 53,216 | 4.7 | 44,528 | 4.4 | 64,178 | 4.9 | |
| 2013 | 1,081 | 99 | 163,234 | 138 | 0 | - | 47,496 | 4.9 | 58,665 | 5.0 | 57,073 | 5.1 | |
| 2014 | 1,191 | 134 | 179,022 | 135 | 720 | 2.5 | 46,686 | 5.2 | 55,311 | 4.9 | 76,305 | 5.6 | |
| 2015 | 1,256 | 107 | 171,722 | 126 | 626 | 2.8 | 53,930 | 4.8 | 60,182 | 4.7 | 56,984 | 5.2 | |
| 2016 | 1,379 | 107 | 162,817 | 110 | 333 | 2.9 | 59,853 | 4.4 | 51,310 | 4.6 | 51,321 | 4.7 | |
| 2017 | 1,320 | 69 | 189,707 | 137 | 0 | - | 68,116 | 5.0 | 58,329 | 4.8 | 63,262 | 5.7 | |
| 2018 | 1,415 | 51 | 156,025 | 106 | 247 | 2.9 | 53,244 | 4.9 | 57,310 | 5.2 | 45,224 | 6.3 | |
| 2019 | 1,591 | 60 | 203,881 | 124 | 931 | 2.9 | 72,243 | 5.0 | 59,847 | 5.1 | 70,860 | 5.8 | |
| 2020 | 1,557 | 73 | 192,129 | 118 | 1,208 | 3.7 | 88,025 | 4.8 | 57,808 | 5.3 | 45,088 | 5.5 | |
| 2021 | 236,000* | ||||||||||||
*Estimated production for 2021.
Company and Site Data
| Year | Number of companies | Number of sites | ||||
|---|---|---|---|---|---|---|
| Producing | Non-producing | Total | Producing | Non- producing | Total | |
| 2011 | 21 | 6 | 27 | 148 | 106 | 254 |
| 2012 | 16 | 6 | 22 | 142 | 115 | 257 |
| 2013 | 15 | 6 | 21 | 145 | 112 | 257 |
| 2014 | 11 | 7 | 18 | 143 | 117 | 260 |
| 2015 | 10 | 6 | 16 | 139 | 115 | 254 |
| 2016 | 10 | 5 | 15 | 136 | 117 | 253 |
| 2017 | 8 | 4 | 12 | 133 | 93 | 226 |
| 2018 | 8 | 4 | 12 | 121 | 100 | 221 |
| 2019 | 8 | 3 | 11 | 146 | 80 | 226 |
| 2020 | 8 | 3 | 11 | 131 | 101 | 232 |
The number of companies authorised and actively producing Atlantic salmon in 2020 was eight, the same number as in 2019. Three companies remained active and authorised, although not producing salmon for harvest in 2020. This continued the trend of Atlantic salmon production becoming concentrated within fewer companies. These 11 companies had 232 registered active sites, although not all these sites produced fish for harvest in 2020.
Fallowing
| Year | Fallow Period (weeks) | Total | |||||
|---|---|---|---|---|---|---|---|
| 0 | <4 | 4-8 | 9-26 | 27-51 | 52 | ||
| 2011 | 60 | 10 | 31 | 85 | 27 | 39 | 252 |
| 2012 | 58 | 4 | 31 | 97 | 28 | 37 | 255 |
| 2013 | 51 | 4 | 31 | 92 | 35 | 43 | 253 |
| 2014 | 48 | 4 | 36 | 89 | 29 | 51 | 257 |
| 2015 | 45 | 6 | 41 | 84 | 27 | 47 | 250 |
| 2016 | 47 | 5 | 27 | 88 | 32 | 49 | 248 |
| 2017 | 40 | 9 | 21 | 88 | 24 | 40 | 222 |
| 2018 | 46 | 5 | 32 | 76 | 26 | 32 | 217 |
| 2019 | 37 | 12 | 31 | 85 | 22 | 37 | 224 |
| 2020 | 57 | 8 | 33 | 74 | 14 | 45 | 231 |
Of the 231 seawater cage sites recorded as being active in 2020, 45 sites were fallow for the entire year whilst 129 sites were fallow for a variable period. There were 57 sites that did not fallow in 2020. The normal production cycle in seawater varies in length between 12 months and two years. A fallow period at the end of production can break the cycle of disease or parasitic infections.
Broodstock Sites
| Year | 2011 | 2012 | 2013 | 2014 | 2015 | 2016 | 2017 | 2018 | 2019 | 2020 |
|---|---|---|---|---|---|---|---|---|---|---|
| Broodstock sites | 11 | 7 | 8 | 8 | 4 | 3 | 4 | 4 | 3 | 4 |
In 2020, the number of freshwater and seawater sites holding broodstock increased to four sites. The number of sites holding broodstock in any one year can be variable, as can be seen from the previous years' figures, which indicate no obvious trend. A total of 3,776 fish were stripped, yielding 20.0 million ova, giving an average yield of 5,297 ova per fish.
Organic Production
| Year | Number of active cage sites | Number of cage sites certified as organic | Production (tonnes) |
|---|---|---|---|
| 2011 | 252 | 10 | 3,104 |
| 2012 | 255 | 7 | 4,597 |
| 2013 | 253 | 8 | 5,207 |
| 2014 | 257 | 8 | 3,588 |
| 2015 | 250 | 5 | 2,382 |
| 2016 | 248 | 5 | 3,903 |
| 2017 | 222 | 5 | 4,644 |
| 2018 | 217 | 5 | 4,219 |
| 2019 | 224 | 4 | 4,462 |
| 2020 | 231 | 9 | 12,528 |
Of the 231 active Atlantic salmon seawater cage sites in 2020, nine were certified as organic, producing 12,528 tonnes.
Escapes
There were five incidents involving the loss of 204,901 fish from seawater Atlantic salmon sites in 2020. There were 13 additional incidents reported where the companies confirmed there was no loss of fish.
Contact
Email: lorna.munro@gov.scot