Scotland 2045: fourth National Planning Framework - draft: integrated impact assessment - environmental report
Environmental report setting out the findings of the strategic environmental assessment (SEA) undertaken to inform preparation of Scotland's draft National Planning Framework 4 (NPF4).
3.0 Environmental Baseline
3.1 Purpose of this Section
3.1.1 This section presents the environmental baseline to meet the requirements of Schedule 3 of the 2005 Act, which requires the Environmental Report to identify:
- Relevant aspects of the current state of the environment and its likely evolution without the implementation of the plan or programme
- Environmental characteristics of areas likely to be significantly affected
- Relevant existing environmental problems
- Relevant environmental protection objectives established at the international or national level which are relevant to the plan or programme.
Structure of this Section
3.1.2 The following information is provided for each of the environmental topics:
- High–level summary of relevant environmental protection objectives established at an international or national level. A fuller analysis is provided in Appendix B
- Overview of baseline conditions
- Key pressures and trends
- Relevant SEA objectives
- Summary of key points
Geographical Scope
3.1.3 NPF4 will be a long-term plan for Scotland, therefore the environmental baseline takes a largely national perspective with reference to the marine environment where appropriate. This approach allows the SEA to reflect on the interaction of the draft NPF4 with wider environmental trends. In addition, further more detailed baseline information has been set out, where relevant in the assessment sections of this report, for example where relevant to the spatial strategy and national developments.
3.2 Biodiversity, Flora and Fauna
Relevant Environmental Protection Objectives
3.2.1 The importance of halting and reversing biodiversity loss is recognised at international and national level, including through the international Aichi Targets[13] and the 2020 Challenge for Scotland's Biodiversity[14], which set out objectives for the conservation and enhancement of biodiversity in Scotland. As the United Nations (UN) moves from the Decade of Biodiversity to the Decade of Ecosystem Restoration, it will set new international targets and Scotland will set out a post 2020 biodiversity strategy accordingly[15]. Habitats and species identified as of particular value are also considered in legislation and policies relating to the protection of biodiversity, flora and fauna. These establish a hierarchy of protection, from the international to local level. Beyond designated sites and species, there are longer-term aspirations for enhancing biodiversity, strengthening nature networks and addressing the impacts of climate change on the natural environment, so that Scotland's nature is protected and restored[16].
Baseline
3.2.2 Biodiversity is crucial for the functioning of healthy ecosystems and supports life by providing resources such as clean air, water and food. Biodiversity is also closely linked with the other environmental topics.
3.2.3 Scotland is well known for its rich biodiversity and the complex and varied habitats that make up the diverse landscapes; approximately 90,000 animal, plant and microbe species are found in Scotland[17] along with habitats, ranging from raised bog to native and ancient woodland. Scotland is home to a wide range of species and internationally important habitats. For example:
- Scotland has 90% of the high mountain habitat in the UK, which accommodates some of the best examples of near-natural habitats and wildlife in the northern and remote parts of Europe.
- Wetlands, including peatlands, can be found across Scotland and are a key provider of services such as carbon sequestration and water purification.
- Scotland's seas, which make up around 61% of the UK's total marine area, are highly dynamic, supporting a diverse range of habitats and species and an increasingly varied array of marine industries[18].
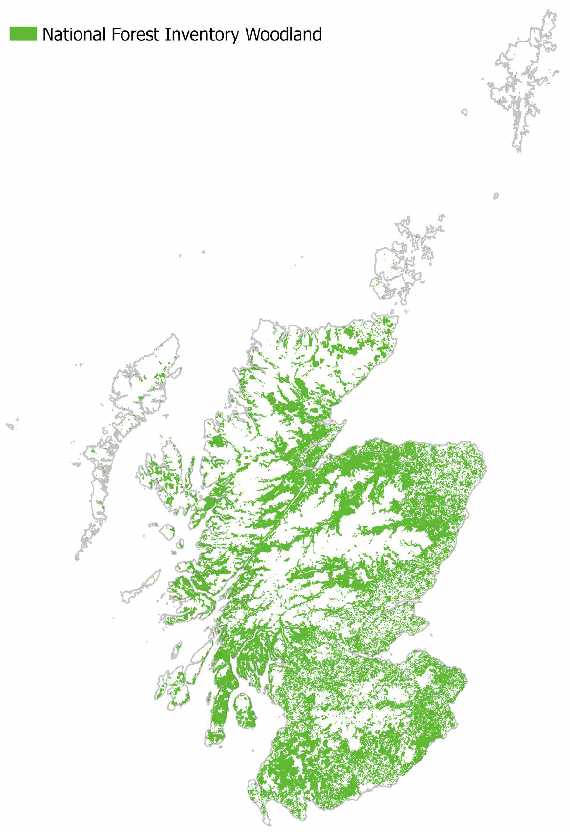
- Agriculture is Scotland's dominant use of land, covering over 70% of the country, with woodlands and forests covering 18% (Figure 3.1). These support a wide range of important flora and fauna diversity, including rare and threatened species.
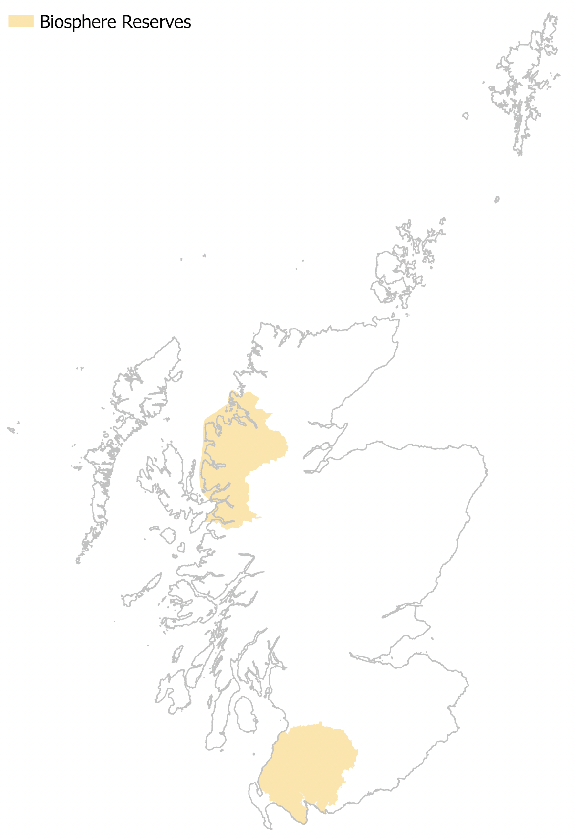
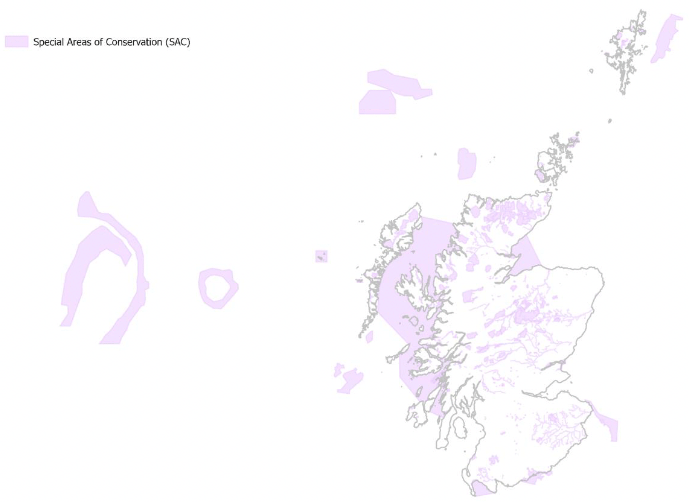
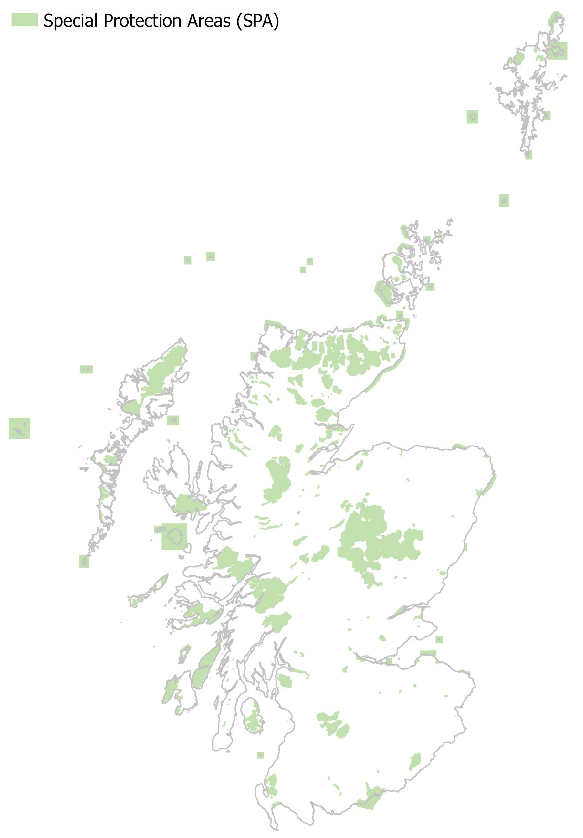
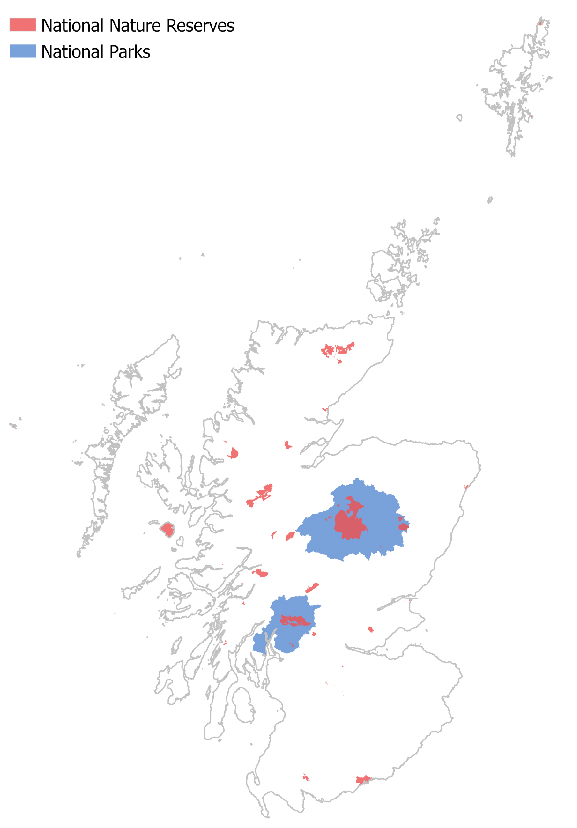
3.2.4 Scotland's protected areas include 251 Special Areas of Conservation, 153 Special Protection Areas, 51 Ramsar sites and 2 Biosphere Reserves, 1,422 Sites of Special Scientific Interest (SSSI), 43 National Nature Reserves and 2 National Parks, among other designations[19]. There are also 244 Marine Protected Areas and a wide range of designated Priority Marine Features which help conserve and enhance the marine environment[20]. Figure 3.2 - Figure 3.6 show the spatial distribution of designated natural heritage sites across Scotland. Many sites are concentrated in rural areas, particularly in the north and west but also more widely around coastal areas.
3.2.5 Greenspaces such as public and private gardens, parks, woodlands, recreational grounds, green corridors, allotments and community growing spaces can also provide habitats and ecosystems which are not only important to wildlife, but for human health and wellbeing[18].
Key Pressures and Trends
3.2.6 Global declines in biodiversity are mirrored in Scotland and the abundance and distribution of Scotland's species has on average declined over recent decades, with most measures indicating this decline has continued in the most recent decade[18]. The State of Nature Scotland Report 2019 shows that from 1994 to 2016, 49% of Scottish species have decreased and 28% have increased in abundance[18]. Further, 11% of species have been classified as threatened with extinction from Great Britain and 133 (of those assessed) have already become extinct[18]. Since 1970, changes in species distribution have also been recorded, with 33% of Scotland's wildlife found in fewer places and 20% found in more places[21]. The condition of protected nature sites is monitored by NatureScot and currently shows that 78.2% of sites are in favourable or recovering condition while 21.8% of sites are in unfavourable condition[22].
3.2.7 There are a range of pressures with the potential to impact Scotland's wildlife and biodiversity. The greatest drivers of change in biodiversity in Scotland are: climate change, urbanisation, pollution, woodland management, fisheries, invasive non-native species, freshwater management and agricultural management.
3.2.8 Climate change in particular impacts biodiversity on a global scale and changes in temperature, precipitation and other climatic changes have affected species distribution in Scotland (including the spread of invasive non-native species), population dynamics and ecosystem functions[21]. Climate change will alter both habitats and species in a number of ways, however there is considerable uncertainty over exactly what the changes may look like[23],[24]. Some habitat loss may occur, with significant changes within existing habitats likely. Commercially important species may also be lost. Indirect impacts may also arise through climate change adaptation and action taken in sectors such as agriculture, forestry, planning, water and coastal management in the face of a changing climate[25]. New species are already arriving in Scotland as the climate becomes more suitable for them, like the nuthatch. Most new species will have little impact on our existing species. But some will outcompete existing species and become problem invasive species[24]. Climate change is also likely to affect vegetation growth[23]. There are also potential opportunities for agriculture and forestry in the form of extended growing seasons[26].
3.2.9 Changes in land-use, such as the intensification of agriculture and woodland expansion can adversely impact habitats, soil and water quality, with land use reported to have had the largest negative impact on terrestrial and freshwater ecosystems[27]. Land-use intensification, modification and overgrazing can also reduce diversity, quality and connectivity of landscapes and habitats. Across the uplands, this has been due to increased grazing pressure, and historically, as a result of forestry. In the lowlands, land-use changes are primarily due to agricultural intensification, and more recently, changes in grazing[28]. Urbanisation can lead to habitat fragmentation due to the expansion of transport systems and infrastructure. However, many species have become reliant on urban environment habitats such as allotments and other greenspaces[28]. Overexploitation of natural resources is also a known pressure, with the consumption of goods and services negatively impacting biodiversity[29].
3.2.10 The main air emissions that affect habitats and species are the gases ammonia, sulphur dioxide and oxides of nitrogen, mainly sourced from intensive livestock units and combustion plants. The impacts range from direct toxic effects, eutrophication of habitats, to acidification altering the availability of nutrients for plants[30].
Relevant SEA Objectives
3.2.11 The above baseline conditions, pressures and trends helped identify the following SEA objectives for biodiversity, flora and fauna:
Biodiversity, Flora and Fauna - SEA Objectives
- Avoid adverse impacts to designated habitats and species
- Avoid adverse impacts to undesignated habitats and species
- Protect, maintain and enhance biodiversity
Biodiversity, Flora and Fauna – summary of pressures and trends
- The abundance and distribution of Scotland's species has on average declined over recent decades
- 78% of protected sites are in favourable or recovering condition while 22% of sites are in unfavourable condition
- 11% of species have been classified as threatened with extinction from Great Britain and 133 (of those assessed) have already become extinct
- The greatest drivers of change in biodiversity in Scotland are: climate change, urbanisation, pollution, woodland management, fisheries, invasive non-native species, freshwater management and agricultural management
Source: Forestry and Land Scotland (2019) SpatialData.gov.scot Contains, or is based on, information supplied by the Forestry Commission. © Crown copyright and database right [2021] Ordnance Survey
Source: NatureScot (2016) Natural Spaces - Scottish Natural Heritage (snh.gov.uk) Contains SNH information licensed under the Open Government Licence v3.0. Contains Ordnance Survey data © Crown copyright and database right (2021
Source: NatureScot (2019) Natural Spaces - Scottish Natural Heritage (snh.gov.uk) Contains SNH information licensed under the Open Government Licence v3.0. Contains Ordnance Survey data © Crown copyright and database right (2021)
Source: NatureScot (2020) Natural Spaces - Scottish Natural Heritage (snh.gov.uk) Contains SNH information licensed under the Open Government Licence v3.0. Contains Ordnance Survey data © Crown copyright and database right (2021)
Source: Scottish Government (2010) SpatialData.gov.scot, SpatialData.gov.scot, SpatialData.gov.scot Licensed under the Open Government Licence v3.0. Copyright Scottish Government, contains Ordnance Survey data © Crown copyright and database right (2021)
Source: NatureScot (2020) Natural Spaces - Scottish Natural Heritage (snh.gov.uk) Contains SNH information licensed under the Open Government Licence v3.0. Contains Ordnance Survey data © Crown copyright and database right (2021)
3.3 Climatic Factors
3.3.1 The Scottish Government commissioned independent consultants LUC to undertake an assessment of the likely impact of each proposed national development's lifecycle greenhouse gas (GHG) emissions on achieving national greenhouse gas emissions reductions targets[31] (the 'GHG research'). This section of the baseline takes into account information to support that assessment, ensuring linkages between the GHG research findings and the wider SEA climatic factors assessment are fully explored.
Introduction
3.3.2 There is a global climate emergency. Due to human activities including industrialisation, deforestation, and large scale agriculture, quantities of GHG in the atmosphere have risen to record levels not seen in three million years[32]. The concentration of GHGs in the atmosphere is directly linked to the average global temperature, and there is unequivocal evidence that human influence has warmed the atmosphere, ocean and land[33]. The scale of recent changes across the climate system as a whole, and the present state of many aspects of the climate system, are unprecedented over many centuries to many thousands of years[33]. Scotland's climate has already changed and is both warmer and wetter on average[34]. In Scotland an estimated 284,000 homes and premises are at risk of flooding; with an additional 110,000 properties predicted to be at risk by the 2080s[35].
Relevant Environmental Protection Objectives
3.3.3 The Climate Change (Scotland) Act 2009, as amended[36] ('the Climate Change (Scotland) Act') created a statutory framework for GHG emissions reduction in Scotland and set targets for reduction in emissions of the Kyoto Protocol GHGs. This "basket" of seven GHGs include carbon dioxide (CO2), methane (CH4), nitrous oxide (N2O), hydrofluorocarbons (HFC), perfluorocarbons (PFC), sulphur hexafluoride (SF6) and nitrogen trifluoride (NF3).
3.3.4 In direct response to the Paris Agreement[37], a legally binding international treaty on climate change, the 2009 Act was amended by the Climate Change (Emissions Reduction Targets) (Scotland) Act 2019[38]. This set new, more ambitious, targets to reduce emissions of all GHGs to net-zero by 2045 at the latest, with interim targets for reductions of at least 56% by 2020, 75% by 2030 and 90% by 2040, relative to a 1990/1995 baseline. An update to the Climate Change Plan[39] was subsequently published to set a pathway to achieve the new targets.
3.3.5 The Climate Change (Scotland) Act also requires a programme for climate change adaptation to be set out every 5 years. This must address risks identified in statutory UK Climate Change Risk Assessments (UKCCRA), which are also updated every five years, based on independent expert advice. The second Scottish Climate Change Adaptation Programme (the Adaptation Programme)[40] addresses the impacts identified for Scotland in the UK Climate Change Risk Assessment (CCRA)[41]. The Adaptation Programme sets out Scottish Ministers' objectives in relation to adaptation to climate change, their proposals and policies for meeting these objectives, and the period within which these proposals and policies will be introduced.
Baseline Conditions
Sources of Scottish GHG Emissions
3.3.6 The Climate Change (Scotland) Act 2009 (as amended) places annual emissions reporting on a statutory footing. An annual Scottish GHG Inventory is used to report progress against all emissions reduction targets under the Act.
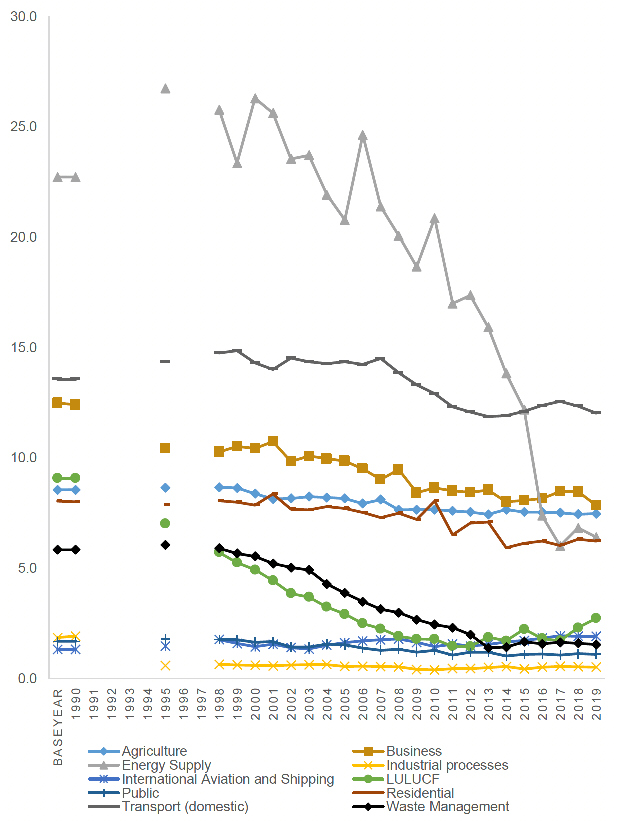
3.3.7 In 2019, Scottish source emissions of the basket of seven GHGs were estimated to be 47.8 million tonnes carbon dioxide equivalent (MtCO2e)[41]. Domestic Transport (excluding International Aviation and Shipping) (12.0 MtCO2e) was the largest source of net emissions, followed by Business (7.9 MtCO2e), Agriculture (7.5 MtCO2e), Energy Supply (6.4 MtCO2e) and Residential (6.2 MtCO2e) (Table 3.1).
3.3.8 Table 3.1 details GHG emissions by gas and by Scottish Government source sector. Carbon dioxide was the main greenhouse gas emitted or removed in most sectors, with the exceptions of the Agriculture, Land use, Land Use Change and Forestry (LULUCF) and Waste Management sectors. Methane was the main net gas emitted in the Agriculture sector (4.1 MtCO2e), followed by nitrous oxide (2.2 MtCO2e) and carbon dioxide (1.1 MtCO2e). Almost all emissions in the Waste Management sector were emitted in the form of methane (1.4 MtCO2e). Where Fluorinated gases are emitted, they have been in relatively small amounts via the Business and Residential sectors.
| NC Category | Carbon dioxide | Methane | Nitrous oxide | Fluorinated gases | Total |
|---|---|---|---|---|---|
| Agriculture | 1.1 | 4.1 | 2.2 | 7.5 | |
| Business | 6.7 | 0.0 | 0.1 | 1.1 | 7.9 |
| Energy supply | 6.0 | 0.4 | 0.1 | 6.4 | |
| Industrial processes | 0.5 | 0.0 | 0.0 | 0.0 | 0.5 |
| International aviation and shipping | 1.9 | 0.0 | 0.0 | 1.9 | |
| Land use, land use change and forestry | -1.7 | 3.2 | 1.2 | 2.7 | |
| Public | 1.1 | 0.0 | 0.0 | 1.1 | |
| Residential | 6.0 | 0.1 | 0.0 | 0.1 | 6.2 |
| Transport | 11.9 | 0.0 | 0.1 | 12.0 | |
| Waste management | 0.0 | 1.4 | 0.1 | 1.5 | |
| Total | 33.5 | 9.2 | 3.8 | 1.2 | 47.8 |
Emission Targets
3.3.9 The Climate Change Committee (CCC) recommended a new method of reporting emissions for the purposes of reporting against statutory targets which was implemented for the first time in June 2020. This is known as the GHG Account, and includes net source emissions adjusted to remove the effect of successive revisions to the data over time[42]. On this adjusted basis, the GHG Account reduced by 51.5% between the baseline periods and 2019 (Table 3.2). The Climate Change (Emissions Reduction Targets) (Scotland) Act 2019 specifies a 55.0% reduction over the same period. Therefore the target for 2019 was not met. A statutory report setting out proposals and policies to compensate in future years for the excess emissions resulting from the missed 2019 emissions reduction target was published in October 2021[43].
| Baseline period | 2016 | 2017 | 2018 | 2019 | |
|---|---|---|---|---|---|
| GHG Account (latest inventory, less combined revision) | 75.7 | 38.6 | 37.2 | 37.8 | 36.7 |
| GHG Account figures, expressed as a percentage reduction from the baseline period | 0.0% | -49.0% | -50.9% | -50.0% | -51.5% |
Key Pressures and Trends
Source Emissions Trends
3.3.10 As noted above, Scottish source emissions of the basket of seven GHGs were estimated to be 47.8 million tonnes carbon dioxide equivalent (MtCO2e) in 2019. This is a 43.8% reduction in estimated emissions from 1990, a 37.3 MtCO2e decrease.
3.3.11 Emissions in 2019 were 2.3% lower than the 2018 figure of 48.9 MtCO2e; a 1.1 MtCO2e decrease. The main contributors to the decrease in emissions between 2018 and 2019 were reductions in emissions in the business (-0.6 MtCO2e), Energy Supply (-0.4 MtCO2e), and Domestic Transport (-0.3 MtCO2e) sectors. All other sectors demonstrated modest reductions over this period, with the exception of Land Use, Land Use Change and Forestry (LULUCF) which increased by 0.4 MtCO2e. The Agriculture and International Aviation and Shipping sectors showed essentially no change in emissions in the latest year[44]. Between 1990 and 2019, most sectors saw a general downward trend (Figure 3.7). Energy Supply emissions have seen the largest decrease in GHG emissions (-16.3 MtCO2e, a reduction of 71.8 per cent) followed by LULUCF (-6.4 MtCO2e, a reduction of 70.0 per cent), Business (-4.6 MtCO2e, a reduction of 36.7 per cent), and Waste Management (-4.3 MtCO2e, a reduction of 73.5 per cent). International Shipping and Aviation emissions are the only category to have increased (0.6 MtCO2e, a 46.0 per cent increase) over the period[44].
Key Sector GHG Emission Trends
Land use, land use change and forestry (LULUCF)
3.3.12 Emissions are reported as a combination of emissions minus removals from the atmosphere. The LULUCF sector includes removals associated with carbon sequestration by grasslands and forestry, as well as the carbon stored in wood products. Carbon emissions can occur where land use changes, for example, where existing cropland or natural land is converted to cropland or settlement[46]. Emissions of other GHG can occur from drainage and rewetting of soils, nitrogen mineralisation associated with loss and gain of soil organic matter, and fires[47].
3.3.13 Additional emissions associated with the historical drainage and rewetting of peatlands have been added to the scope of LULUCF in the latest Scottish GHG inventory (1990-2019)[47]. With this addition, LULUCF emissions in Scotland are now shown to be a net-source of greenhouse gas emissions for all periods where previously this category has been shown to be a net-sink. LULUCF emitted 2.7 MtCO2e of emissions in 2019; in 1990 emissions were 9.1 MtCO2e[47].
3.3.14 Peatland restoration had been identified as one of the key actions needed to prevent further carbon loss and help remove excessive GHG from the atmosphere. The Scottish Government's Climate Change Plan Update[48] sets targets to restore 250,000 ha of degraded peatland by 2030. The Climate Change Plan Update also emphasises the role woodland plays in reducing emissions through sequestration, and introduces a stepped increase in the annual woodland creation rates from 2020-2021.
3.3.15 The 'Biodiversity, flora and fauna' and 'Soils' section of this baseline, identifies the areas of forestry and peatland in Scotland, and highlights the pressures of land use intensification, modification and overgrazing which also impacts on GHG release.
Agriculture
3.3.16 In 2019, agriculture was responsible for 7.5 MtCO2e of the total Scottish emissions and was the largest source of methane emissions. This is a 1.1 MtCO2e (12.7 per cent) reduction in net emissions between 1990 and 2019. Between 2018 and 2019 there was essentially no change in net emissions of overall greenhouse gases from this sector[49].
3.3.17 Emissions from agriculture are predominantly methane and nitrous oxide gases, with smaller amounts of carbon dioxide. Methane emissions have reduced by 14.9% between 1990 and 2019 mainly due to a decrease in livestock numbers.
3.3.18 Poor land management leads to increased soil erosion by decreasing the amount of soil organic carbon. This as a result can lead to reduced capacity of soil to sequester carbon and increase the overall carbon emissions from agriculture.
Transport
3.3.19 Domestic transport has consistently been a large part of Scotland's emissions, and was the largest source of net emissions in 2019. Emissions show a relatively small decrease of 11.3% between 1990 (13.6 MtCO2e) and 2019 (12.0 MtCO2e). These emissions have decreased by 0.3 MtCO2e (2.5%) between 2018 and 2019[49].
3.3.20 Emissions from international aviation and shipping has increased by 0.6 MtCO2e (46.0 per cent) from 1990 to 2019. There was essentially no change in emissions between 2018 and 2019, with the value remaining at 1.9 MtCO2e.
3.3.21 Improved efficiency for given car classes enforced by international standards[50] contributes to lower emissions, however this is counterbalanced by increases in kilometres driven as traffic levels (vehicle km) have increased slightly over the last few years[51].
3.3.22 Newly registered cars are becoming more efficient, and there has been an increase in the numbers of ultra-low emission vehicles registered in Scotland with 22,095 vehicles registered at the end of September 2020, a 24% increase since March 2020. However, this still represents a very small proportion of cars on roads[52].
3.3.23 Although Scotland has implemented policies such as Smarter Choices Smarter Places, and the Cycling Action Plan, there has been no significant behavioural shift away from cars towards public transport, walking and cycling in the last decade[53].
Energy
3.3.24 The Energy Supply category has seen large reductions in emissions from 22.7 MtCO2e in 1990 to 6.4 MtCO2e in 2019 (71.8%)[54]. These reductions are mainly driven by the complete cessation of coal use in electricity generation and reductions in emissions from power stations, balanced by the expansion of renewable capacity. The progress in decarbonising the electricity generation sector now provides the basis for decarbonising other sectors of the economy via electrification[53].
Waste
3.3.25 Emissions from waste management have been relatively static over recent years, with a value of 1.5 MtCO2e for 2019, very slightly down from 1.6 MtCO2e between 2016-2018. However, between 1990 and 2019 emissions reduced by 4.3 MtCO2e (73.5 per cent). Almost all emissions in the waste management sector were emitted in the form of methane (1.4 MtCO2e). This decrease is largely due to the progressive introduction of methane capture and oxidation systems within landfill management[54].
3.3.26 The Scottish Carbon Metric measures the whole-life carbon impacts of Scotland's waste[55]. The most recent report indicates that in 2019, Scottish household waste increased by 0.7% to 2.4 million tonnes. The household waste recycling rate was 44.9%, a slight increase from 44.7% in 2018, and the volume of Scottish household waste landfilled in 2019 was 758,141 tonnes, a reduction of 26.5% from 2018[56]. Additional information on waste generation and recycling is provided in the 'Material Assets' section of this baseline.
3.3.27 The total carbon impacts per tonne of household waste has steadily declined since 2011, primarily due to increased recycling rates and reduced waste to landfill. The net carbon intensity of Scottish Household waste decreased by 2% in 2019 to 2.34 tCO2e /tonne[55].
3.3.28 The carbon impacts of household waste decreased by 1.6% from 2018 to 5.7 MtCO2e equivalent in 2019, resulting in the lowest recorded carbon impacts for household waste since Carbon Metric reporting began in 2011[57].
Circular Economy
3.3.29 A circular economy can reduce the demand for raw material in products; to encourage reuse, repair and manufacture by designing and selling products and materials to last as long as possible, in line with the waste hierarchy.
3.3.30 In order to reduce the carbon footprint of infrastructure it is important that account is taken of the energy that is embodied in the materials used[58]. The dictionary of energy defines "embodied energy" as "the sum of the energy requirements associated, directly or indirectly, with the delivery of a good or service"[58]. This includes the emissions caused by extraction, manufacturing/processing, transportation and assembly of every product and element in an asset[59]. In some cases, (depending on the boundary of an assessment), it may also include the maintenance, replacement, deconstruction, disposal and end-of-life aspects of the material and systems that make up the asset[59]. It excludes operational emissions of the asset.
3.3.31 Taking a circular economy approach to construction, such as designing to enable adaptability and use of discrete elements that can facilitate low cost repair and maintenance, can increase life-span and can reduce the need for new construction materials with associated embodied carbon. Designing out waste from the outset is estimated to have the potential to divert 11 million tonnes from landfill[60].
Residential
3.3.32 The residential sector is dominated by direct fuel combustion in households. There has been a decrease in direct fuel combustion of 22.3% between 1990 and 2019, mainly due to a switch from less efficient solid (e.g. coal) and liquid fuels to natural gas for heating, and improvements in energy efficiency. Residential emissions decreased between 2018 and 2019 by 1.5%. This marginal change was possibly driven by a warmer January-March in 2019 compared to 2018, resulting in less fuel burned for domestic heating[61]. Scotland's building stock is extremely varied in terms of building type, construction method, age and energy efficiency rating. Natural gas is used to supply the majority of heat in Scotland, but electricity and heating oil also account for significant shares. More recently, renewable sources have been used for supplying heat and they include biomass, heat pumps and Energy from Waste (EfW)[62]. The remaining challenge to decarbonising buildings in Scotland includes provision of heating and hot water. Specifically, it includes low-carbon heat and energy efficiency in existing homes and ensuring that new homes use low-carbon heat, are ultra-energy efficient and are resilient to a changing climate.
3.3.33 The Scottish House Condition Survey 2019 highlights that 45% of Scottish homes were rated as Energy Performance Certificate rating C or better and only one third of dwellings had an Environmental Impact Rating in band C or better. Approximately 17% of dwellings in Scotland are estimated to be off gas grid. The majority (93%) of urban dwellings are within the coverage of the gas grid, whereas 65% of those in rural areas are not[63].
3.3.34 Electrification of heat and power for homes is significant in terms of achieving carbon reductions for buildings and business. For new build homes, net zero standards are anticipated to come into force in 2024.
3.3.35 Timber is frequently used in construction, and it accounts for 75% of all new homes in Scotland, locking carbon in for the life of the building. It is estimated that a typical timber-framed house saves 4 tonnes of carbon dioxide compared with an equivalent masonry house. Moreover, timber creates less waste, and has lower emissions in its manufacture than materials such as brick, plastic, concrete or steel.
Climate trends and adaptation
3.3.36 Scotland's climate has already changed. Over the last few decades Scotland has experienced a warming trend, shifting rainfall patterns and rising sea levels[64]:
- Scotland's 10 warmest years on record have all occurred since 1997. The average temperature in the last decade (2010-2019) was around 0.7 °C warmer than the 1961-1990 average.
- There has been an increase in rainfall over Scotland in the past few decades, with an increasing proportion coming from heavy rainfall events. The annual average rainfall in the last decade (2010-2019) was 9% wetter than the 1961-1990 average.
- Average sea level around the UK has risen by approximately 1.4 mm/year from the start of the 20th century.
3.3.37 Key long-term climate change trends for Scotland are:
- Average temperatures will increase across all seasons
- Weather will remain variable and may become more variable
- Typical summers will be warmer and drier
- Typical winters will be milder and wetter
- Intense, heavy rainfall events will increase in both winter and summer
- Sea levels will rise
- Reduced frost and snowfall
3.3.38 Climate change adaptation aims to increase society's resilience to climate change. Adaptation serves as a framework for managing future risk, and offers the potential of reducing future economic, environmental and social costs[65]. It refers to changes in processes, practices, and structures to minimise potential damages or to benefit from opportunities associated with climate change. Adaptation solutions take different shapes and forms, and there is no 'one-size-fits-all-solution'[66]. Climate adaptation will be crucial to ensure that Scotland's society and economy will be resilient to future climate impacts.
3.3.39 The extent of the effects of climate change will vary by location and projections indicate that climate change trends observed over the last century will continue and intensify over the coming decades.
3.3.40 It is predicted that the greatest climate change impacts for the UK are large increases in flood risk, exposure to high temperatures and heat waves; shortages in the public water supply and for agriculture, energy production and industry; substantial risks to wildlife and natural ecosystems risks to domestic and international food production and trade[67].
3.3.41 Climate change can also give rise to indirect impacts arising from mitigation and adaptation measures. For example, renewable energy is crucial to meeting Scotland's emissions reduction targets. However, individual technologies can have negative environmental impacts such as localised visual effects, changes in landscape and land use, and impacts on biodiversity, water and air quality, amongst others. Climate change has been identified as a primary pressure on the SEA topic areas of air quality, population and human health, soil, water, biodiversity, cultural heritage and the historic environment. These pressures and predicted impacts have been discussed further under the individual SEA topics.
3.3.42 Further changes in temperature and rainfall are expected to change the patterns of Scotland's agricultural land-uses and could lead to increased pressure on the land[68].
Relevant SEA Objectives
3.3.43 The above baseline conditions, pressures and trends helped identify the following SEA objectives for climatic factors:
Climatic factors - SEA Objectives
- Avoid new Greenhouse Gas (GHG) emissions
- Reduce GHG emissions in order to meet Scotland's emissions reduction target of net zero by 2045
- Promote and enable adaptation to climate change
Climatic Factors - Summary of Pressures and Trends
- Source emissions continue to fall.
- Between 1990 and 2019, there was a 43.8 per cent reduction in estimated emissions, a 37.3 MtCO2e decrease.
- The most significant contributors to this decrease were energy supply, waste management, business and land use, land use change and forestry (LULUCF).
- In 2019, domestic transport was the largest source of net emissions.
- Climate change adaptation needs to be integrated into all aspects of future development to withstand the impacts of changes in weather patterns, and sea level rise.
3.4 Air
3.4.1 Air pollution has significant effects on public health and the environment. Exposure to air pollution is harmful to human health in terms of premature mortality and morbidity, mainly related to respiratory and cardiovascular disease[69]. Air pollution can impact on the more vulnerable members of society – the very young, the elderly and those with existing health conditions such as asthma, respiratory and heart disease, thus making air quality an important health inequalities issue[69] (refer to section 3.10 Population and Human Health). Air pollution also effects ecosystems. Air pollution and its deposition onto vegetation, soil and water can damage vegetation directly or indirectly through the addition of nutrients or changes in acidity levels within a habitat. These can lead to a shift in the competitive balance between species, changes in plant species composition or subtle changes in vegetation structure, which can affect the use of a habitat by an animal species[70]. Refer to section 3.2 Biodiversity, Flora and Fauna for further information.
Relevant Environmental Protection Objectives
3.4.2 Cleaner Air for Scotland 2[69], sets out the Scottish Government's air quality policy framework with a series of actions to deliver continued air quality improvement and secure compliance with international commitments. The strategy notes that policies that improve air quality can potentially have multiple co-benefits for biodiversity, population health, for addressing inequality and for mitigating and adapting to climate change. For example, policies to promote active travel such as walking, wheeling and cycling, can increase physical activity, significantly reduce cardiovascular incidence and mortality, and have been shown to reduce all-cause mortality.
3.4.3 The National Emission Ceilings Directive[71] (NECD) (2016/2284/EU) sets national emission ceilings for certain atmospheric pollutants in keeping with the United Nations Economic Commission for Europe (UNECE) Convention on Long-Range Transboundary Air Pollution of 1979[72] (CLRTAP) and, in particular, its 1999 Protocol[73] to Abate Acidification, Eutrophication and Ground-level Ozone of 1999, which was revised in 2012 (the revised Gothenburg Protocol). The NECD transposes 2020 targets agreed under the revised Gothenburg Protocol, along with more ambitious targets for 2030. The NECD is part of retained EU law and has been transposed into domestic law through the National Emission Ceilings Regulations (NECR) 2018[74] with the requirements implemented at UK level through a National Air Pollution Control Programme[75] (NAPCP).
Local Air Quality Management
3.4.4 Objectives relevant to local air quality management (LAQM) are set out in the Air Quality (Scotland) Regulations 2000[76], as amended. Where targets are not met, local authorities must declare an Air Quality Management Area (AQMA) and produce an action plan setting out measures to address the issues identified.
Baseline
3.4.5 There are currently 100 monitoring sites in Scotland which record pollutant concentrations, including ground-level ozone, ammonia, nitrogen oxides, sulphur oxides, carbon monoxide and PM. Currently, 36 AQMAs have been declared, with 14 of Scotland's 32 local authorities having declared at least one[77]. All but two of the AQMAs were declared for transport-related exceedances of nitrogen dioxide and/or PM10. The majority of issues in these AQMAs relate to localised pollution hotspots within urban centres. The remaining two AQMAs have been declared for industrial emissions of sulphur dioxide and PM10 respectively[77].
Key Pressures and Trends
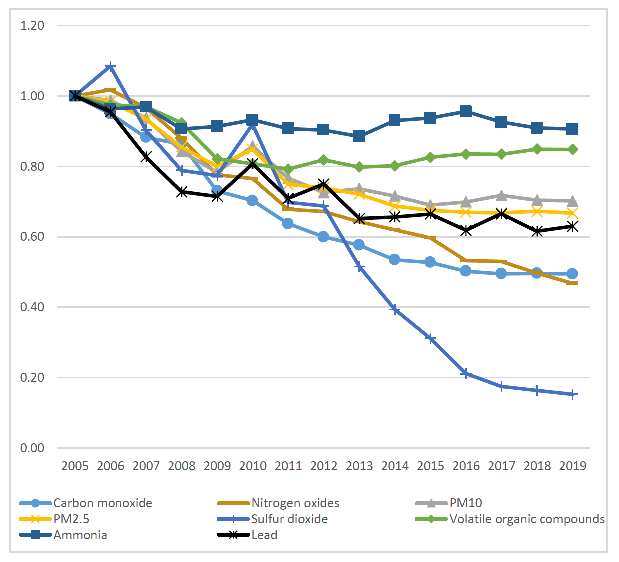
3.4.6 In summary, emissions of the eight main air pollutants (NH3, CO, NOX, NMVOCs, PM10, PM2.5, SO2, and Pb) were lower in 2019 than they were in 2005[78]. SO2 emissions show the greatest rate of decline, with more modest declines evident for CO, NOX, Pb, VOCs, PM2.5 and PM10. By contrast, emissions of NH3 are less varied over the time series with no strong decline observed since 2005 (Figure 3.8).
Emission trends
Ammonia (NH3)
3.4.7 In 2019, emissions of ammonia in Scotland were estimated to be 31kt, a decline of 9% since 2005. Agriculture is the main source of ammonia emissions, with initial reductions driven primarily by decreases in livestock numbers and declines in the use of nitrogen-based fertilisers. However, since 2010, the decline began to be offset by increased application of urea-based and organic fertilisers to agricultural soils causing fluctuating emissions totals, with no significant trends since[79].
Carbon monoxide (CO)
3.4.8 In 2019, emissions of carbon monoxide in Scotland were estimated to be 113 kt, a decline by 51% since 2005. This decline is due to changes in the contribution of transport sources, particularly in the road sector where emissions have declined by 86% since 2005. This trend is associated with increased numbers of vehicles compliant with more recent standards, and a switch from petrol cars to diesel cars which have lower associated CO emissions rates. Emissions from the residential, commercial and public sector combustion have steadily increased since 2005 which corresponds with an increase in use of wood fuel in the domestic sector[80].
Nitrogen oxides
3.4.9 In 2019, emissions of nitrogen oxides in Scotland were estimated to be 85kt, a decline of 53% since 2005. Emission reductions are predominantly due to changes in transport sources, particularly in road transport. This decline is associated with more stringent emission standards and improvements in catalyst repair rates. However, an uptake of diesel cars over petrol cars partly offsets these emissions reductions, as diesel cars emit higher NOX relative to their petrol counterparts[80].
3.4.10 Energy industry emissions have declined since 2005, linked to installation of abatement systems at Longannet and Cockenzie power stations. Longannet power station closed in March 2016 marking the end of coal combustion for power generation in Scotland, and causing a step-change in emissions between 2015 and 2016[80].
PM10
3.4.11 In 2019, emissions of PM10 in Scotland were estimated to be 14kt, declining by 30% since 2005. Transport sources, residential and industrial processes each accounted for over 16% of total emissions in 2019. Reductions in PM10 emissions from energy, primarily due to abatement at coal-fired stations, the increase in renewable energy sources and the increase in the use of natural gas in energy generation in place of coal[80].
3.4.12 In the transport sector, decreasing exhaust emissions from diesel-fuelled vehicles are leading to PM10 emission reductions. However, non-exhaust sources of PM10 (for example tyre wear) have become more important to consider as exhaust PM10 has been reduced, with 79% of emissions from the road transport sector related to non-exhaust sources in 2019. Emissions from the residential and other combustion sectors have slightly increased recently, and is considered due to an increasing quantity of wood fuel use[80].
PM2.5
3.4.13 In 2019, emissions of PM2.5 in Scotland were estimated to be 9kt, declining by 33% since 2005. The primary drivers for this decline are the continued switch from coal to natural gas in electricity generation, and reductions in emissions from the transport sector. However, these declines in emissions have been offset by increases in emissions from the residential sector, and in particular, the combustion of wood[81].
Sulphur dioxide
3.4.14 In 2019, emissions of sulphur dioxide in Scotland were estimated to be 14kt, declining by 85% since 2005. This is primarily due to continued changes in the power generation sector including improved emission controls on some large coal fired plants; the use of coal of lower sulphur content in later years at Cockenzie (Scottish Power, 2012) before its closure in 2013, and finally the complete cessation of coal combustion for power generation in Scotland in 2016. SO2 emissions from transport sources have also declined, coincident with the reduced sulphur content of road fuels, for both petrol and diesel[81].
Lead
3.4.15 In 2019, emissions of lead in Scotland were estimated to be 5.5 tonnes, declining by 37% since 2005 due to changes in energy sources, industrial combustion, and industrial processes. Emissions from power stations have decreased by 86% since 2005, due to the phase out of coal from the energy generation mix in 2016. Transport sources, in particular non-exhaust emissions, account for 50% of total lead emissions in 2019. Industrial combustion accounted for 15% of total lead emissions in 2019, and use of fireworks contributed a further 10%. Three of the seven sites in the UK which manufacture fibreboard, chipboard and oriented strand board are located in Scotland, and are key sites for lead emissions due to the burning of waste wood as fuel[81].
Relevant SEA Objectives
3.4.16 The above baseline conditions, pressures and trends helped identify the following SEA objectives for air:
Air - SEA Objectives
- Avoid adverse impacts to air quality
- Reduce emissions of key pollutants and improve air quality throughout Scotland
- Reduce levels of nuisance e.g. noise, vibration, dust, odour and light
Air – Summary of Pressures and Trends
- Air pollution has significant effects on human health, and is an important health inequalities issue.
- Air pollution can also effect habitats and species.
- Currently, 36 AQMAs have been declared in Scotland, 34 are transport-related and the remaining two have been declared for industrial emissions.
- Emissions of the eight main air pollutants are lower in 2019 than they were in 2005.
- Sulphur dioxide emissions show the greatest rate of decline, with more modest declines evident for other pollutants. Emissions of Ammonia show no strong decline since 2005.
- The main sources of emissions are transport, domestic and industrial.
- Policies that improve air quality can potentially have multiple co-benefits for biodiversity, population health, for addressing inequality and for mitigating and adapting to climate change.
3.5 Water
Relevant Environmental Protection Objectives
3.5.1 Objectives for the protection and improvement of Scotland's water environment are set out in a policy and regulatory framework, including through the Water Environment and Water Services (Scotland) Act 2003 (as amended)[82] which governs objectives for rivers, lochs, transitional waters, coastal waters and groundwater resources. Objectives and action programmes are set out in River Basin Management Plans[83] (RBMPs), produced by SEPA every six years.
3.5.2 Activities that may affect Scotland's water environment, including discharges of wastewater or industrial effluent; abstractions for irrigation, hydropower or drinking water; and engineering activities in or near rivers are controlled by The Water Environment (Controlled Activities) (Scotland) Regulations 2011 (as amended)[84].
Baseline Conditions
3.5.3 Water provides numerous benefits including; drinking water provision, water for use in industry and agriculture, hydropower, wave and tidal energy, fisheries, aquaculture, recreation from, for example, wildlife watching, angling and water sports[85],[86], and carbon storage[87]. The water environment also supports diverse species and habitats of national and international importance.
3.5.4 Scotland has a wide range of water bodies including two thirds of British river systems and streams, varying from mountain burns to wide lowland rivers such as the Tay. There are over 30,000 lochs in Scotland, Loch Ness holds the most water with 7.4 million m3, more than all English and Welsh lakes combined[88]. Scotland's coast stretches 18,000 km with marine waters out to 12 and 200 nautical miles making up Scotland's territorial and offshore waters, which combined make up 13% of all European seas. There are also 1,526 protected areas associated with the water environment. These are shellfish waters, predominantly found along Scotland's west coast and in the Shetland Islands, bathing waters, areas protected for wildlife conservation or areas used to supply drinking water[89].
3.5.5 Much of the water environment in Scotland is in good condition. However, there are still significant problems affecting water quality, physical condition, water flows and levels, and the migration of wild fish. Invasive non-native species are also damaging aquatic plant and animal communities. The river basin management plans for Scotland set out a range of actions to address these impacts[90].
Key Pressures and Trends
3.5.6 In 2019, 63% of Scotland's surface waters were assessed as being in good or better condition, improving 8% since 2007 (Figure 3.9), and 84% of groundwaters were assessed as good condition in the same year, an 8% improvement on 2012. It is forecasted that 71% of waterbodies are expected to be in good or better condition by 2021 an almost 8% increase from the start of the last RBMP cycle[91]. In 2018, 73% of Scotland's bathing waters were in good condition or better condition, up from 66% in 2015[92].
Source: SEPA[92]
3.5.7 Key pressures on the surface water environment include urbanisation, invasive non-native species, intensive agriculture/aquaculture and climate change. Rural and urban diffuse pollution remains a concern for water quality, particularly in relation to agriculture, forestry, and urban development[93]. Groundwater quality and flow can be affected by diffuse pollution from rural sources, discharges from industries such as mining and quarrying, and agriculture irrigation[94]. Water abstraction and storage can also place a burden on water resources, with public demand, and abstraction and demand for irrigation in agriculture both growing[95].
3.5.8 As mentioned under the Air topic, airborne pollution can impact water bodies. Heightened nitrogen concentrations can cause the acidification and eutrophication of water bodies. Eutrophication occurs when the concentrations of otherwise limiting nutrients increase, allowing aquatic plants and algae to grow unchecked and deplete oxygen levels.
3.5.9 Flooding can have significant and long-lasting impacts on people, communities, and businesses. Flood Risk Management Strategies[96] coordinate action to tackle flooding in Scotland, setting out the national direction for flood risk management and helping target investment and coordinate action across public bodies. Flood risk maps show where areas are likely to be at risk of flooding from rivers, seas and surface water[97].
3.5.10 Water scarcity is expected to increase due to climate change[98] with Scotland predicted to experience more frequent and more severe droughts with associated implications on water availability for drinking, agriculture and ecosystems[99]. The vulnerability to water scarcity is not expected to be evenly distributed, the west of Scotland is predicted to become wetter and the east drier, with the north-east expected to face the most issues around water scarcity[100] A changing climate is also expected to lead to warmer sea and river temperatures and an increased risk of non-native species spreading and becoming established in water environments[101], further impacting aquatic ecosystems.
3.5.11 The risk of flooding from rivers, surface waters and seas is predicted to increase. It is estimated that there are currently 284,000 homes, businesses and services at risk of flooding in Scotland, more than double that identified to be at risk in 2015[102]. It is predicted that the number of properties at risk will increase by a further 110,000 by 2080[102]. Flooding can damage material assets, pose risks to population and human health through the spread of infectious diseases, and lead to a loss of habitats, resulting from erosion.
3.5.12 Development has the potential to negatively impact water quality, for example during construction or via pollution run-off where applicable. New structures on land can also affect the capacity of flood plains or flood defences.
Relevant SEA Objectives
3.5.13 The above baseline conditions, pressures and trends helped identify the following SEA objectives for water:
Water - SEA Objectives
- Avoid adverse impacts on the ecological status of water bodies
- Ensure the sustainable use of water resources
- Reduce the number of people and properties at risk of flooding and promote adaptive flood risk management
- Protect, maintain and improve the ecological status and physical state of the water environment
Water – Summary of Pressures and Trends
- Water quality in most of Scotland is in good or better condition, however, some localised areas of concern remain.
- Key pressures on the surface water environment include urbanisation, invasive non-native species, intensive agriculture/aquaculture and climate change.
- Groundwater quality and flow can be affected by diffuse pollution from rural sources, discharges from industries such as mining and quarrying, and agriculture irrigation.
- Water abstraction and storage can also place a burden on water resources, with demand growing.
- Airborne pollution can impact water bodies causing overgrowth of plants and algae and depleting oxygen levels.
- Climate change is expected to lead to increases in water scarcity, flood risk, and to increase the risk of non-native species spreading and becoming established in water environments.
- The development and operation of new infrastructure has the potential to negatively impact water quality. New structures on land can also affect the capacity of flood plains or flood defences.
3.6 Soil
Relevant Environmental Protection Objectives
3.6.1 Nationally, the protection of prime quality agricultural land and peatlands is set out in the Scottish Soil Framework[103]. Soil objectives include national commitments to sustainable soil management that protect valued soils including prime quality agricultural land and those with a high carbon content, such as peat (for example via the Scottish Soil Framework, Scotland's National Peatland Plan[104]).
Baseline Conditions
3.6.2 Soil is a non-renewable resource and is one of Scotland's most important assets. Soils support a wide range of functions and provide many environmental, economic and societal benefits including[105]:
- Providing the basis for food and biomass production.
- Storing carbon and maintaining the balance of gases in the air as a major store of terrestrial carbon.
- Providing raw materials such as the use of sand and sand gravel in construction.
- Providing valued habitats and sustaining and supporting biodiversity.
- Controlling and regulating environmental interactions such as water flow and quality – for example, soil sealing can change the rate at which water enters rivers and other water functions.
- Preserving cultural and archaeological heritage by providing records and protective cover.
- Providing a platform for buildings and roads but therein largely losing its capacity to carry out other functions.
3.6.3 Soil quality is defined as the ability of soil to carry out these functions[103]. Soils contribute to ecosystem services such as food provision, fibre and raw material (a provisioning service), provision of clean water (a regulating service), protects and is part of Scotland's cultural heritage (a cultural service) and soil formation itself (a supporting service)[105].
3.6.4 Scotland has a diverse range of soils, which are generally more organic, more acidic, more leached and wetter than those of most other European countries. Over 25% of Scotland is used for arable crops (mostly in the eastern half of the country) and improved grassland, mostly on the more mineral soils of the central belt and in lowland areas, and predominantly found in the south west. The remainder of the country is occupied by semi natural habitats over more organic soils with over 20% of Scotland being covered in peatland habitat on peat soils[106] (Figure 3.10).
3.6.5 Scotland's soils play a key role as the main store of terrestrial carbon, acting as "carbon sinks", most of it being held in soils under peatland habitat, estimated to store 1.6 billion tonnes of carbon[107]. As with all soils, those under peatland habitat are at risk from land use change and the effects of climate change, and their loss or degradation (and the associated loss of carbon) has the potential to be a significant contributor to Scotland's GHG emissions[108]. The role of healthy peatland in sequestering soil carbon, helping to reduce downstream flood risk and providing benefits to biodiversity is recognised in Scotland's National Peatland Plan.
3.6.6 Other soils can also act as a sink for GHG. Soil organic carbon content is higher in the North West Highlands and Islands and Shetland, and the uplands of southern Scotland. Higher quality agricultural land suitable for crops is distributed throughout the Lothians, Fife, Tayside and the eastern Scottish Borders through to Ayrshire, the Clyde Valley, parts of Dumfries and Galloway and the north east of Scotland including the coastal areas around the Moray and Cromarty Firths (Figure 3.11 & Figure 3.12).
3.6.7 There is a strong interrelation between soil deterioration and the increased number of extreme floods as soils sealing, soil compaction and capping exacerbates flooding as the capability of soils to absorb water decreases and water runs off more quickly. Appropriate soil management therefore is a central plank for the development of a sustainable approach to flood risk management[106].
Key Pressures and Trends
3.6.8 While Scotland's soils are considered to generally be in good health, there are a range of pressures on them. Climate change and loss of organic matter pose significant threats to Scottish soils, with both likely to affect soil function, including loss of soil carbon. Other threats include upland development such as tracks and renewable energy schemes. Poorly located and designed built developments with associated drainage and excavation of peat can result in peatland degradation and habitat loss[109]. The loss of valued soils in particular has the potential for national impacts which will be difficult to reverse. In the case of climate change, these impacts have the potential to be felt on a global scale[110].
3.6.9 Approximately 80% of peatland is thought to be damaged[111]. However, in 2018, of the sites designated as SSSIs, SACs, and RAMSAR sites, the majority were found to be in favourable condition; upland bog (67%), wetland bog (64%), upland fen, marsh and swamp (77%), wetland fen, marsh and swamp (72%)[112]. Damaged bogs can also lead to reduced water quality and negatively impact a range of other services[113].
3.6.10 Changes in land use and land management practices are also a key pressure on soil. These include activities such as transport and development, including road building and the expansion of agriculture and forestry[114]. At present, there is uncertainty and a lack of quantitative information regarding threats to soil functions, particularly in relation to the extent of soil sealing, changes in soil biodiversity, and compaction of soils[115]. Estimates of soil sealing suggest figures of approximately 1000 hectares a year[116]. Soil contamination can also arise from many causes, including atmospheric deposition, agriculture and forestry operations, mining and historic land contamination, and can impact soil function and biodiversity[117]. It is the case that urban soils typically exhibit higher degrees of metal contamination than rural soils formed from the same parent material[116].
3.6.11 Contaminated and vacant and derelict land can have a number of negative impacts on the environment, including on soil, air and water quality, both within the sites and potentially outside its boundaries. The amount of derelict and urban vacant land in Scotland has decreased by 164 hectares (1.5%) from 11,090 hectares in 2018 to 10,926 hectares in 2019[118]. The impacts of vacant and derelict land have also been considered under Population and Human Health.
Relevant SEA Objectives
3.6.12 The above baseline conditions, pressures and trends helped identify the following SEA objectives for soil:
Soil - SEA Objectives
- Safeguard and improve soil health, protect soil resource and soil functions of all soil types in Scotland
- Safeguard and improve high value agricultural land and carbon-rich soils
- Reduce the extent of contaminated and vacant and derelict land
Soils – Summary of Pressures and Trends
- Scotland's soils are considered to generally be in good health
- Approximately 80% of peatland is thought to be damaged. However, the majority of designated peatland sites were found to be in favourable condition
- Climate change and loss of organic matter pose significant threats to Scottish soils, with both likely to affect soil function
- Changes in land use and land management practices are also a key pressure on soil
- Contaminated and vacant and derelict land can have a number of negative impacts on the environment, including on soil
Source: NatureScot (2016) Natural Spaces - Scottish Natural Heritage (snh.gov.uk) Contains SNH information licensed under the Open Government Licence v3.0. Contains Ordnance Survey data © Crown copyright and database right (2021)
Source: James Hutton Institute (2014) Scotland's Soil Data | Soils@Hutton | The James Hutton Institute Copyright and database right, The James Hutton institute (2021). Used with the permission of The James Hutton institute. All rights reserved. Licensed under the Open Government Licence v3.0.
Source: James Hutton Institute (1981) Scotland's Soil Data | Soils@Hutton | The James Hutton Institute Copyright and database right, The James Hutton institute (2021). Used with the permission of The James Hutton institute. All rights reserved. Licensed under the Open Government Licence v3.0.
3.7 Cultural Heritage and Historic Environment
Relevant Environmental Protection Objectives
3.7.1 Existing cultural heritage objectives are set out in legislation including the Town and Country Planning (Scotland) Act 1997, as amended[119], the Planning (Listed Buildings and Conservation Areas) (Scotland) Act 1997[120] and the Ancient Monuments and Archaeological Areas Act 1979[121]. These objectives are focused primarily on the protection of valued sites and features, including townscapes (i.e. places, buildings and open spaces), buildings, archaeological sites, battlefields, wrecks and landscapes that have been recognised at the international, national and local levels through a hierarchy of designations.
3.7.2 Policies such as the current Scottish Planning Policy (SPP)[122] aim to improve the quality of settlements and built environment with a national level focus. These are complemented by the Historic Environment Scotland (HES) Policy[123] which defines how the historic environment in Scotland should be managed. Together, they emphasise the importance of preserving recognised sites, avoiding negative impacts on them and their wider setting, and contributing to their enhancement where possible. Key objectives also extend to taking account of, and avoiding damage to, or loss of currently unknown archaeology.
Baseline Conditions
3.7.3 Scotland's many and varied historical sites are unique and irreplaceable. These sites and features are regarded as making a valuable contribution to quality of life, cultural identity, education and economy. While these assets are distributed widely throughout Scotland, there are clusters of sites in and around Scotland's settlements and coastlines.
3.7.4 The majority of Scotland's historic environment is undesignated, with estimates that the scale of the undesignated resource is around 90-95% of the total resource[124]. There are more than 56,000 designated/protected historic assets across Scotland (Figure 3.13). These are protected through the process of designation, which aims to identify the most important parts of the historic environment, to recognise their significance and enhance protection. Designations include world heritage sites, listed buildings, scheduled monuments, gardens and designed landscapes, battlefields, historic marine protected areas and conservation areas.
Figure 3.13 Scotland's Historic Environment
- 47,000 listed buildings
- 668 Conservation Areas
- 8,000 Scheduled
- 363 Gardens and Designed Landscapes
- 40 Historic Battlefields
- 6 World Heritage Sites
- 8 Historic Marine Protected Areas
Source: Historic Environment Scotland[125]
Key Pressures and Trends
3.7.5 Scotland's Historic Environment Audit provides statistics on Scotland's heritage assets, and details of how these are changing over time. Key trends from the 2018 audit include[125]:
- 67% of pre-1919 housing stock is in need of critical repairs (which refers to weather tightness and structural stability). This has reduced from 74% in 2008.
- 83% of scheduled monuments are perceived to be in an optimal or generally satisfactory condition.
- 750 historic buildings on the Buildings at Risk Register (BARR) have been saved between 2009 and 2018 and more than 200 others are in the process of being restored. Almost 2,000 buildings have been saved since 1990 when BARR began.
- One in five (483,000) of Scotland's dwellings are more than 99 years old (built pre-1919).
- 35% of adults had visited a historic site (increased from 28% in 2012).
- 336 Properties in Care of HES, decreased from 345 in 2008.
3.7.6 Key existing pressures affecting the historic environment include development pressures, maintenance, land use, coastal erosion and climate change.
3.7.7 Climate change, including a continuous increase in temperatures, altering patterns of precipitation and increased frequency of unpredictable and extreme weather events may alter and accelerate decay processes of historic monuments and archaeological sites. Sites may also be exposed to changing flood risk, and altered vegetation growth patterns which could accelerate decay of vulnerable stonework. Changing weather patterns can change the distribution of plant species which may impact the character of historic gardens and landscapes[126].
3.7.8 An indirect impact of climate change is that to maintain or repair historic buildings and sites at risk of degradation, access to appropriate repair material may be needed (e.g. various rock materials) to maintain its characteristic look[127]. This may increase pressure on natural assets from which the materials are sourced. Often, sourcing of such material was local and many of the ancient quarry sites have been reused, backfilled, or designated[128].
Relevant SEA Objectives
3.7.9 The above baseline conditions, pressures and trends helped identify the following SEA objectives for cultural heritage and historic environment:
Cultural heritage and historic environment - SEA Objectives
- Avoid adverse impacts on the historic environment including its setting
- Protect and enhance valued landscapes, historic and archaeological sites and other culturally and historically important features, landscapes and their settings
Cultural Heritage and Historic Environment – Summary of Pressures and Trends
- 67% of pre-1919 housing stock is in need of critical repairs
- Key existing pressures affecting the historic environment include development pressures, maintenance, land use, coastal erosion and climate change
- Climate change has the potential to affect cultural heritage and historic sites by accelerating decay, this may increase the pressure on natural assets needed to repair or maintain sites
3.8 Landscape and Geodiversity
Relevant Environmental Protection Objectives
3.8.1 Landscape objectives, including those from the European Landscape Convention[129], recognise and protect special landscapes but also aim to improve degraded landscapes and highlight the importance of all landscapes. Areas identified as having outstanding scenic value in a national context are designated as National Scenic Areas, which protects the special qualities of nationally important landscapes and seascapes[130]. Policies include a commitment to protecting the special qualities of nationally important landscapes, with planning also recognising and protecting regional and locally important landscapes. The importance of quality local places for population and human health and areas without statutory protection such as wildland, are also recognised[131].
3.8.2 The environmental protection objectives set out in legislation and policy for geodiversity are broadly aimed at protecting geological and geomorphological features from damage and disturbance, principally by identifying and conserving areas of particular value. Scotland's geodiversity is safeguarded in protected areas and Geological Conservation Review sites and through local geodiversity action plan activities. Sites are mainly protected at a national level through designation of SSSI but also through other designations such as National Parks[132]. Some sites also have international recognition as UNESCO Global Geoparks[133].
Baseline Conditions
3.8.3 Scotland's diverse and distinctive landscapes are a significant part of the country's natural and cultural heritage contributing to the economy and the population's wellbeing and providing a range of benefits[134]. Scotland is internationally renowned for its varied and dramatic landscapes (Figure 3.14) including impressive mountain ranges, broad plateaus, expansive lowlands, and striking coastal features[135]. Many of these landscapes are the result of ancient glacial and periglacial activity as well as changes in sea level[136]. The primary classifications are the Central Lowlands, the Highlands and Islands to the north and west, and the Southern Uplands[137]. Situated among these natural features are the many iconic built landmarks and townscapes that help give Scotland its reputation as a tourist destination[138].
3.8.4 Geodiversity underpins landscape, and protecting our rocks, landforms and soils is also an important part of landscape planning and management[139]. Many places in Scotland are of great importance to geoscience for their rocks, fossils and landforms, demonstrating important geological processes or events that have significant value for education and research and as part of Scotland's geo-heritage[140].
3.8.5 The character and quality of Scotland's landscape and geodiversity provide various benefits and underpins most types of ecosystem services. It is a fundamental component of supporting services, but also contributes to provisioning, regulating and cultural services. These include improving the population's health by providing space for recreation, exercise and improvements in wellbeing. Attractive, accessible landscapes, including urban greenspace, can make an important contribution to quality of life. Landscape inspires art and culture, contributing to a sense of place and belonging. Alongside supporting Scotland's economy, attracting investment and adding value, landscape makes an important contribution to quality of life and local distinctiveness and identity[141],[142].
3.8.6 Geodiversity is also the physical basis for Scotland's varied landscapes (both rural and urban) and scenery. It has a profound influence on terrestrial and marine habitats, wildlife and use of land and water[143]. Geodiversity assets of regional or local importance may be protected as Local Geodiversity Sites but coverage is not complete. Around 9.5% of the total area covered by Scotland's National Parks and 37% of National Nature Reserve areas have Geological Conservation Review site status[144]. Some of these are also protected at the national level by SSSI legislation[145]. Landscapes of the highest quality have been designated and include 40 National Scenic Areas and two National Parks (Loch Lomond and the Trossachs, and the Cairngorms). There is a high concentration of wildland areas, National Scenic Areas and other designations along the west coast of Scotland, and in the Highlands (Figure 3.15 - Figure 3.17).
3.8.7 Wild land character is displayed in some of Scotland's more remote upland, mountain and coastal areas that show minimal signs of human influence[146]. Areas with stronger wild land characteristics are more commonly found in the north and west, particularly in areas of higher ground, although additional areas of wild land are present in other areas of Scotland (Figure 3.15)[147].
Key Pressures and Trends
3.8.8 Scotland's landscapes have evolved over thousands of years due to natural and cultural forces, and are still changing. Regional and local landscapes are becoming less distinct due to more similarities in building form, settlement patterns, agricultural practices and infrastructure, for example, the development of renewable energy technology. Similarly, in agriculture there has been a focus on maximising yields, resulting in a move towards a monoculture, at the expense of a more diverse landscape of field types and hedgerows[148]. Changes in landscape tend to occur over long periods, and gradual change, as a result of development such as housing, and changes in farming and forestry practice, can be difficult to determine[149].
3.8.9 Climate change is expected to lead to extensive landscape change across Scotland with the greatest changes likely to occur in lowland and coastal areas where human population is highest. Geodiversity assets are also expected to be affected by climate change. Direct impacts are likely to occur due to changing temperatures and patterns of precipitation, weather events, and sea level change. However, mitigation and adaptation measures are expected to have a greater influence on Scotland's landscapes, geodiversity and quality of life than the direct effects of climate change[150].
3.8.10 The coast and foreshore are under many pressures particularly from climate change, rising sea levels and coastal erosion. These areas are also very important recreational resources, dependent on the landscape, geodiversity and environmental quality of these areas[151]. Coastal erosion currently affects 46% of soft shorelines (an increase from 38% over that reported in 2017). The extent and rate of coastal erosion, and the risk to coastal assets, is expected to increase. As much as 75% of soft coasts are expected to be eroding by 2050 depending on the extent of future climate change[152]. Aquaculture development, energy generation development, including on and offshore windfarms can impact landscape, geodiversity and seascape if poorly sited and designed[153].
3.8.11 Development and changes in land use associated with urban expansion and associated infrastructure are also a key pressure and the distinctive landscape settings of many towns and cities are under pressure.
3.8.12 Natural landscapes, landforms and geodiversity assets can be lost, destroyed or obscured due to inappropriate building or infrastructure development, waste practices, and associated pollution, commercial afforestation or extraction processes[154].
Relevant SEA Objectives
3.8.13 The above baseline conditions, pressures and trends helped identify the following SEA objectives for landscape and geodiversity:
Landscape and geodiversity - SEA Objectives
- Avoid adverse effects on landscapes and geodiversity
- Safeguard and enhance the character and diversity of the Scottish landscape and areas of valuable landscape and geodiversity
Landscape and Geodiversity – Summary of Pressures and Trends
- Regional and local landscapes are becoming less distinct due to more similarities in building form, settlement patterns, and agricultural practices
- A move towards a monoculture has created a less diverse landscape of field types and hedgerows
- Climate change is expected to lead to extensive landscape change across Scotland, with the greatest changes likely to occur in lowland and coastal areas where human population is highest. Geodiversity assets are also expected to be affected by climate change
- The coast and foreshore are under many pressures, particularly from climate change, rising sea levels and coastal erosion
- Aquaculture development, energy generation development, including on and offshore windfarms, can impact landscape, geodiversity and seascape
- Development and changes in land use associated with urban expansion and associated infrastructure are also a key pressure
Source: NatureScot (2019) Natural Spaces - Scottish Natural Heritage (snh.gov.uk) Contains SNH information licensed under the Open Government Licence v3.0. Contains Ordnance Survey data © Crown copyright and database right (2021)
Source: NatureScot (2014) Natural Spaces - Scottish Natural Heritage (snh.gov.uk) Contains SNH information licensed under the Open Government Licence v3.0. Contains Ordnance Survey data © Crown copyright and database right (2021)
Source: NatureScot (1998, 2010), International Dark Sky Association (2021) Natural Spaces - Scottish Natural Heritage (snh.gov.uk), International Dark Sky Communities - International Dark-Sky Association, Contains SNH information licensed under the Open Government Licence v3.0. Contains Ordnance Survey data © Crown copyright and database right (2021). Information provided by the International Dark Skies Association
Source: NatureScot (2020) Natural Spaces - Scottish Natural Heritage (snh.gov.uk) Contains SNH information licensed under the Open Government Licence v3.0. Contains Ordnance Survey data © Crown copyright and database right (2021)
3.9 Material Assets
3.9.1 The 2005 Act requires material assets as a topic to be addressed in SEA but does not set out a specific definition of the factors it should encompass. SEPA guidance[155] notes that consideration of material assets in SEA is usually taken to cover a wide variety of both natural (e.g. minerals, water, forestry, agriculture) and built assets (e.g. transport infrastructure, built infrastructure and buildings).
3.9.2 Relevant natural material assets including soil and water are addressed elsewhere within this environmental baseline, with this section describing built assets most relevant to the draft NPF4 including:
- Energy infrastructure
- Transport infrastructure
- Blue-green infrastructure
- Waste
- Housing
- Digital infrastructure
Relevant Environmental Protection Objectives
3.9.3 Objectives and policies related to material assets are wide-ranging, taking into account the broad nature of the topic. Multiple policies and plans address built material assets including the programme for long-term infrastructure investment in Scotland set out in the Infrastructure Investment Plan[156], and practices and commitments for action against climate change such as the Climate Change Plan[157] and update to the Climate Change Plan[158] are also relevant. Making Things Last: A Circular Economy Strategy for Scotland sets out Scotland's ambitions for changing how waste is considered in the economy, including promoting a circular economy[159].
Baseline
3.9.4 This section summarises the baseline and key trends for the key material assets identified above.
Energy
3.9.5 The Scottish Energy Strategy[160] sets out the Scottish Government's vision for how the energy system in Scotland would look in 2050. The strategy notes that a diverse, well-balanced energy supply portfolio is essential to decarbonise heat, transport and electricity systems and provide the basis for secure and affordable heat, mobility and power in future decades. The Energy Strategy Position Statement published in 2021 identified key priorities, and aligned the Energy Strategy with recent policy publications including the Hydrogen Policy Statement[161], Local Energy Policy[162] Statement and Offshore Wind Policy Statement[163] which collectively support the delivery of the Climate Change Plan[164]. The Onshore Wind Policy Statement was published in 2017 and was intended as a statement of the Scottish Government's support for the onshore sector. This publication did not take account of the climate emergency (declared in April 2019) and the legal commitments stemming from this and achieving net zero. Therefore, on 28 October 2021 a consultation on a new draft Onshore Wind Policy Statement was launched, and will run until 21 January 2022 reflecting the increased deployment of onshore wind necessary to achieve net zero[165].
3.9.6 Table 3.3 below outlines progress against current energy targets.
| Energy Target | Latest | Target |
|---|---|---|
| Overall renewable energy target Total Scottish energy consumption from renewables | 23.8% In 2019 | 50% by 2030 |
| Renewable electricity target Gross electricity consumption from renewables | 95.9% in 2020 (provisional) | 100% By 2020 |
| Renewable heat target Non-electrical heat demand from renewables | 6.6% in 2019 | 11% By 2020 |
| Energy consumption target Reduction in total energy consumption from 2005-07 | -14.14% in 2019 | -12% By 2020 |
| Energy productivity target % change in gross value added achieved from the input of one gigawatt hour of energy from 2015. | + 4.6% in 2019 | + 30% In 2030 |
3.9.7 In March 2021, Scotland had 11.9 GW of installed operational renewable electricity generation capacity. This has steadily risen over time, however, has levelled off since June 2019 possibly as fewer projects have been able to access subsidies. Most of Scotland's operational capacity comes from onshore wind (8.4 GW), with offshore wind (0.9 GW) capacity increasing in the last few years. Half of the renewable capacity in Scotland comes from large installations of over 50 MW (6.2 GW in total). However, a total of 1.3 GW comes from small-scale installations of less than 5 MW. These projects are important as they are likely to contribute to the development of smart, decentralised and local energy markets in Scotland. This is made up of 0.5 GW of onshore wind, 0.3 GW of solar PV, 0.3 GW of hydro and 0.1 GW of bioenergy and waste[167].
3.9.8 The renewable electricity capacity pipeline in June 2021 was 14.8 GW. Of this, 5.4 GW is in planning, 6.8 GW is awaiting construction and 2.6 GW is under construction[168].
3.9.9 As Scotland's energy mix continues to change, the electricity transmission network (grid) that supports the balance between energy generation and demand will change significantly, for example, as a result of the increased electrification of the transport and heat network. Infrastructure will play a key role in ensuring security of supply and decarbonising Scotland's energy systems in the most cost effective and affordable way[169]. This is partly because the spatial pattern of electricity generation is changing from a centralised system focused on small number of large power stations to a decentralised system with development in areas with a previously weak network. Figure 3.18 illustrates the location of electricity generators in Scotland.
3.9.10 Energy storage is likely to be an increasingly important part of the transition to delivering clean, affordable and secure supplies of energy[170]. For example, the continued development of battery storage technologies and hydrogen fuel cells for vehicle use in the transport sector. Offshore wind and the development of hydrogen can make important contributions to reducing the carbon emissions of energy. As part of the transition to net zero, technologies such as Carbon Capture Utilisation and Storage can enable further reductions of carbon emissions.
3.9.11 Considerable opportunities for the re-use of energy infrastructure have also been identified. The reuse of equipment from wind turbines and decommissioned oil and gas platforms is one of four key priority areas for action within "Making Things Last: A Circular Economy Strategy for Scotland"[171]. There are also opportunities to extend the lifespan of infrastructure; for example, through repowering of existing windfarms.
Source: BEIS (2020) Digest of UK Energy Statistics (DUKES) 2021 - GOV.UK (www.gov.uk) © Crown copyright 2021. Licensed under the Open Government Licence v3.0.
Transport Infrastructure
3.9.12 Scottish Transport Statistics[172] show that over the last five years there have been increases in car traffic, and in air, rail and ferry passenger numbers. Conversely, the number of bus passengers decreased over the same time period. In 2019-20 of journeys made by public transport, 73% were by bus, 19% by rail, 6% by air and 2% by ferry. In 2019, 30% of journeys to work were by public or active travel, one percent lower than in 2009. Public and active travel to work has remained at around 30% since 2009, with cycling retaining a low modal share.
3.9.13 In 2019, 49 billion vehicle kilometres were travelled on Scotland's roads, the highest level ever recorded. Cars account for 75% of the total volume of traffic on the roads while the remaining traffic is split between light goods vehicles (17%), heavy goods vehicles (5%) and other (3%). More than 98% of road vehicles in Scotland ran on petrol (50%) or diesel (48%) in 2019. In the same year, there were 56,722km of public roads in Scotland. Overall, there was a minor increase in the amount of trunk road that was newly constructed, reconstructed, strengthened, or surface dressed in 2018-19 compared to the previous year. Trunk roads are the most frequently used, in 2019, 40% of distance travelled by road vehicles was on trunk roads, which account for only 7% of the road network[172].
3.9.14 Scotland's primary train operator, Scotrail, recorded 96.4 million passenger journeys in 2019-2020, an increase of 26% since 2008-2009. As of the end of 2018/19, the Scottish rail network had 2,758 kms of rail network and 359 stations. In 2019-20, Glasgow Central was the busiest national rail station in Scotland, with 32 million passenger journeys. Edinburgh Waverley was used by 23 million passengers, Glasgow Queen Street by 17 million, Paisley Gilmour Street by 4 million, Haymarket by 3.0 million, Partick by 2.9 million, Aberdeen and Stirling by 2.5 million, Charing Cross by 2.2 million, Exhibition Centre Glasgow by 2.0 million and Dundee by 1.9 million. Including those already listed, there were 77 stations for which more than half a million passenger journeys each were recorded in the national ticketing system.
3.9.15 There has been an increase in air travel with 28.9 million passengers in 2019 down 2% compared to the previous year, and 28% higher than 2009. Scotland's busiest airport by passenger numbers is Edinburgh followed by Glasgow, Aberdeen and Inverness.
3.9.16 In 2019, 117 million tonnes of road freight was lifted in Scotland. By weight, much more freight is carried by road than by any other mode of transport. Prior to 2011, more tonne-kilometres of freight (a measure which takes account of the distance that freight is carried) were moved by coastwise shipping than any other mode of transport. However, since then more tonne-kilometres are moved by road. After falling between 1960 and 1994-5, rail freight traffic has since increased in most years until 2005, when it began to decline again. Fourteen million tonnes of freight were lifted by coastwise shipping in 2015 – a fall from 25 million in 2000.
3.9.17 The key transport routes in Scotland are shown in Figure 3.19 Key Transport Routes
Source: NapTAN (2021) NaPTAN user guide - GOV.UK (www.gov.uk) Ordnance Survey (2021) Free OS OpenData Map Downloads | Free Vector & Raster Map Data | OS Data Hub Scottish Government (2021) SpatialData.gov.scot Licensed under the Open Government Licence v3.0. Copyright Scottish Government, contains Ordnance Survey data © Crown copyright and database right (2021). © Crown copyright 2021 Licensed under the Open Government Licence v3.0. Contains Ordnance Survey data © Crown copyright and database right (2021)
Blue-green infrastructure
3.9.18 Blue-green infrastructure is an interconnected network of natural and semi-natural areas, ranging in size from small rain gardens and green streets to larger parks and greenspace including ponds and watercourses. These features can perform several functions and provide a range of benefits within the same spatial area[173]. Benefits of blue–green infrastructure include a reduced potential for flooding, improved water quality, reduced infrastructure costs, and increased space for communities and wildlife[174]. For example sustainable urban drainage systems mimic natural drainage processes, improving the quality and reducing the quantity of runoff from development[175]. In addition to reducing the risk of flooding and diffuse pollution, other benefits include creating attractive open spaces and diverse habitats for wildlife[176]. Green infrastructure can also encourage active travel, improve accessibility and connectivity, and lead to wider health benefits through increased physical activity, providing spaces to relax, benefitting mental health and improving air quality. As a key component in placemaking it can also influence the economy through land values, tourism and economic development and enhance communities by building community cohesion and regeneration[177].
Waste
3.9.19 The Scottish Government has several targets for reducing waste and increasing recycling[178]. By 2025, the Scottish Government aims to:
- reduce total waste arising in Scotland by 15% against 2011 levels
- reduce food waste by 33% against 2013 levels
- recycle 70% of remaining waste
- send no more than 5% of remaining waste to landfill
- The Scottish Government also aims to match the EU ambition for all plastic packaging to be economically recyclable or reusable by 2030 and end the practice of landfilling biodegradable municipal waste by 2025
3.9.20 Around 11.45 million tonnes of waste were generated in Scotland in 2018, which was unchanged from 2017 and a 4.2% reduction since 2011. There was no significant change in the total amount of waste produced between 2017 and 2018 as the continued reduction in commercial and industrial and household wastes was offset by an increase (3.9%, 0.2 million tonnes) in Construction and Demolition waste generated. In terms of the types of waste generated, Soils was the largest waste category generated in 2018 (4.29 million tonnes, 37.5% of all waste generated), followed by Household and Similar Wastes (2.06 million tonnes, 18.0%) and Mineral Waste from Construction and Demolition (1.28 million tonnes, 11.1%)[179].
3.9.21 In 2018, the recycling rate for waste from all sources was 60.7%, an increase of 1.1 percentage points from the 59.6% of waste recycled in 2017. Of the estimated 11.45 million tonnes of waste generated in 2018, around 7.07 million tonnes were recycled, an increase of 0.4% from 2017[179]. In 2018, the waste category with the largest amount recycled was Soils (2.90 million tonnes, 41.1% of all waste recycled) followed by Mineral waste from construction and demolition (1.02 million tonnes, 14.4%).
3.9.22 The total amount of waste disposed of to landfill has generally decreased steadily since 2009, following large reductions between 2007 and 2009. In 2018, around 4.0 million tonnes of waste was disposed of by landfill or incineration without energy recovery, with 32.1% of all waste being sent to landfill[179]. A further 0.5 mt was recovered by incineration with energy recovery or co-incineration. Scotland sent 3 million tonnes of waste to landfill in 2019 (latest data), a reduction of 735,807 tonnes (20%) from 2018 and a reduction of over 4 million tonnes (57%) from 2005. The reduction was largely due to the amount of Household and similar wastes landfilled, which fell by 36% from 1.19 million tonnes in 2018 to 0.76 million tonnes in 2019[180]. The total quantity of waste incinerated in Scotland in 2019 was 1.23 million tonnes, an increase of 0.52 million tonnes (72%) from 2018, and an increase of 0.82 million tonnes (199%) from 2011. This was largely due to the Household and similar wastes incinerated, which increased by 131% from 2018 to 330,368 tonnes in 2019[180].
3.9.23 In 2019, the amount of biodegradable municipal waste disposed to landfill fell below one million tonnes for the first time. The drop to 0.7 million tonnes is a decrease of 324,486 tonnes (32%) from 2018 and 1.3 million tonnes from 2005.
3.9.24 Emissions from Waste Management declined significantly from 1995 to 2013, from 6.1 to 1.4 million tonnes per year, and have remained relatively stable in recent years, with a value of 1.5 Mt per year in 2019[181]. The Climate Change Plan sets out an ambition to reduce these emissions to 1.2 Mt per year by 2025, and to 0.8 Mt per year by 2030[182]
3.9.25 Every year SEPA provides an estimate of the national shortfall in waste management infrastructure capacity required to meet the targets set out in 'Making Things Last: a circular economy strategy for Scotland'[183]. The total estimates for 2018 are reported in Table 3.4.
| Total additional diversion capacity needed | 1,785,000 |
|---|---|
| Additional capacity needed to manage source segregated recyclables | 775,000 |
| Additional capacity needed to manage unsorted waste | 1,010,000 |
| 10 year capacity of existing landfill infrastructure | 20,590,000 |
| 10 year landfill required capacity | 13,370,000 |
Housing
3.9.26 Housing to 2040[184] sets out a vision for housing in Scotland to 2040, and aims to deliver an ambition for everyone to have a safe, good quality and affordable home that meets their needs in the place they want to be. The strategy notes a desire for all homes to be digitally connected and have easy access to quality green space, services and public transport links – with no barriers to walking, wheeling or cycling and easy access to learning, health services and employment opportunities.
3.9.27 The strategy also highlights the role homes can play in tackling the global climate emergency. It notes a vision that all homes will be warm, affordable to heat, and will reduce direct emissions from heating to zero.
3.9.28 The strategy sets an ambition to deliver 100,000 affordable homes by 2031/32 with at least 70% of these for social rent. It also looks to accelerate funding from 2027/28 to bring more existing homes into this programme, as well as building new ones. More recently A Fairer, Greener Scotland: Programme for Government 2021-22[185], commits to the delivery of 110,000 affordable homes by 2032, of which at least 70% will be available for social rent and 10% will be in remote, rural and island communities.
Digital Infrastructure
3.9.29 Scotland's digital strategy recognises digital and data infrastructure as critical national infrastructure, and notes that robust and resilient digital infrastructure is essential to maintain and improve the ability of businesses to compete in a global market place; be successful in attracting inward investment; transform the delivery of public services; respond to the challenges of a low carbon economy and have vibrant, strong and connected communities in cities, towns and rural areas[186].
3.9.30 Modern digital connectivity is recognised as an essential component of creating a successful country. For businesses and social enterprises, it enhances productivity and drives innovation. In rural communities and fragile areas, it has the potential to boost economic development, retain young people and attract new residents. Connectivity, both fixed and mobile, is central to the successful development of emerging sectors such as renewables, digital healthcare and cloud computing, but also to more traditional sectors, such as tourism or business services, which are increasingly using digital technologies.
3.9.31 The digital strategy also addresses inequalities associated with a digital divide. The 2019 Scottish Household Survey indicates that home internet access has increased steadily and is now at an all-time high. However, access to getting online in the most deprived areas is lower (82%) than in the most affluent areas (96%)[187]. Other studies also suggest that a digital divide exists across generations.
3.9.32 A progress report published in 2021[188] reported progress against actions identified in the digital strategy, key infrastructure actions include:
- The commitment to provide 100% of residential and business premises in Scotland with access to superfast broadband by the end of 2021 will be met;
- The Scottish 4G Infill programme is investing in future-proofed infrastructure to improve rural 4G mobile coverage. 11 masts are now live, with delivery anticipated at up to 46 locations;
- The 5G strategy was published August 2019[189], and continued with the establishing of the Scotland 5G Centre (S5GC), to facilitate investment in the development, deployment and commercialisation of 5G in Scotland;
- The S5GC will deliver a network of 5G Innovation Hubs; and
- The commitment to ensuring Scotland is equipped with the underlying infrastructure capable of supporting a widespread sensor network to maximise the benefits to our businesses and communities of the Internet of Things (IoT) is delivering through multiple initiatives. For example, in 2018 £2.7 million was in IoT Scotland, a three year programme to create a widespread network using one of the world's most popular standards (LoRa).
Key Pressures and Trends
3.9.33 Built and natural assets are a key part of Scotland's environment, they include infrastructure for energy, heat, flood protection, water supply, and waste and wastewater management.
3.9.34 In some areas the capacity of some material assets to deal with demand is being over-stretched such as wastewater management systems and energy generation, which can affect human health and wellbeing. Increasing demand for goods and services puts pressure on existing material assets and causes an increased demand for resources together with the need for waste management and disposal mechanisms.
3.9.35 Consumption of products and materials now accounts for up to 74% of Scotland's carbon footprint[190]. Further, infrastructure is estimated to account for 53% of total UK emissions in 2013 and is predicted to increase to 90% by 2050[191]. Construction also accounts for around 50% of all waste in Scotland and has a major influence on the efficient use of resources[192]. Consideration of embodied carbon within the built environment at the initial design and construction stages can not only contribute to meeting GHG emissions reductions, but also reduce pressure on resources.
3.9.36 Most of the underlying infrastructure that will be required in the next 30 years already exists today and it is essential that these assets are maintained, effectively and efficiently utilised, and enhanced to net zero readiness[191]. Additionally, infrastructure does not sit in isolation, for example, homes and schools need roads and utilities and it is anticipated that this interdependency is expected to increase with a transition to low and zero carbon solutions[191].
3.9.37 As Scotland transitions to net zero, a growing and increasingly decarbonised electricity sector is critical to enabling other parts of the economy to decarbonise, notably, transport, buildings and industry[193]. Infrastructure will play a key role in ensuring security of supply and decarbonising Scotland's energy systems in the most cost effective, affordable way[194]. Data infrastructure will also become more vital as the population grows and economies and societies become more reliant on getting more value from data to meet a range of needs[195]. There are also key synergies between digital and data infrastructure and other forms of infrastructure such as energy and transport.
3.9.38 Agricultural change can impact landscape character, and the viability of rural communities and offer some ways to help tackle climate change. Expanding the area of Scotland's forests and woodlands can also contribute to reduced GHG emissions, and provide an important commercial natural resource, improve biodiversity and provide spaces for people to enjoy[196]. Increasing development, land use change and poor land management can impact forestry and agriculture.
3.9.39 Technological developments, behaviour change and reducing demand for less sustainable modes of transport, following the sustainable travel hierarchy, will play a key role in reducing emissions arising from the transport sector. However, the reasons for how, why and when people travel have fundamentally changed due to COVID-19[196]. For example, demand for public transport reduced during lockdown from March to June 2020, whilst there has been a mass shift to home working in some professions[196].
3.9.40 Derelict and vacant land can affect a community's health, environment, economy and social cohesion[197]. Transforming vacant and derelict land, for example, through new homes or creating urban greenspaces, can deliver both environmental and broader social benefits, including addressing health inequalities[198].
3.9.41 The benefits of blue-green infrastructure include a reduced potential for flooding, improved water quality, reduced infrastructure costs, and increased space for communities and wildlife[199]. A key aspect of blue-green infrastructure is its ability to perform several functions and provide multiple benefits in the same spatial area. Blue-Green infrastructure can also contribute to climate change mitigation and adaptation.
3.9.42 Flooding poses the greatest long-term climate related risk to infrastructure performance, however, growing risks posed from heat, water scarcity and slope instability caused by severe weather could also prove significant[200]. Road and rail transport are generally more vulnerable to a changing climate than air and water transport and flooding is anticipated to be the most significant impact on these networks, as well as those arising from extreme weather conditions and landslides[200].
3.9.43 It is estimated that 33-50% of coastal buildings, roads, rail and water networks lie in erodible areas[201]. Some stretches of the Scottish coastline is reported as actively eroding, exposing these networks[200]. If the current rate of coastal erosion continues, around £400 million of assets could be threatened by 2050, including residential and non-residential buildings, railways, roads and the freshwater aquatic environment[201].
3.9.44 The network support services underlying energy, transport, water, and information and communications technology are vital to health and wellbeing and economic prosperity. The effect of climate change on these infrastructure systems will be varied but is likely to include an increase in disruptive events such as flooding, landslides, drought, and heatwaves. Further, this infrastructure is closely inter-linked and failure in any area can lead to wider disruption across these networks[202].
Relevant SEA Objectives
3.9.45 The above baseline conditions, pressures and trends helped identify the following SEA objectives for material assets:
Material Assets - SEA Objectives
- Avoid adversely impacting on material assets (e.g. water, heat, energy and flood protection infrastructure etc)
- Promote the principles of circular economy
- Reduce use and promote sustainable management of natural and built environment resources
- Promote the sustainable design, use and management of new and existing assets/infrastructure to support the development of high-quality places
Material Assets – Summary of Pressures and Trends
- Material assets is considered to comprise all natural and built assets in Scotland.
- Examples of material assets include infrastructure for transport, energy, heat, flood protection, water supply, and waste and water treatment.
- Increasing demand for goods and services puts pressure on natural resources.
- Flooding poses the greatest long-term climate related risk to infrastructure performance, however, growing risks posed from heat, water scarcity and slope instability caused by severe weather could also prove significant.
- Network services for energy, transport, water, and information & communications technology are vital, and failure in any one area can lead to wider disruption across these networks.
- Expanding the area of Scotland's forests and woodlands can also contribute to reduced GHG emissions, and provide an important commercial natural resource, improve biodiversity and provide spaces for people to enjoy.
3.10 Population and Human Health
Relevant Environmental Protection Objectives
3.10.1 A wide range of environmental protection objectives are relevant to population and human health. Protection against environmental effects such as impacts to air, water, land and disturbance, particularly from noise and vibration are established in legislation at International, UK and national levels. The provision of access to the outdoors for recreational and educational purposes, sustainable transport and housing, green infrastructure and the role of the environment and place in mental and physical health and wellbeing are also well established. Wider policy including reducing inequalities, social inclusion and improving health also form an important context for the NPF4.
Baseline Conditions
Figure 3.20 Scotland's Population in Numbers
- 5.46 million Scotland’s current population
- 71% of people live in large urban and other urban areas
- 9% of people live in remote small towns and remote rural areas
- 5.57 million expected population by 2043
Source: National Records for Scotland[203],[204],[205]
3.10.2 The population of Scotland was estimated at 5,466,000 in 2020[206]. Projections forecast that the population will continue to rise to around 5.57 million by 2043, an increase of 2.5%[207]. Whilst life expectancy is also projected to increase by 2043, the expected rate of increase will be slower than previous projections[207].
3.10.3 In mid-2020, 71% (over 3.8 million) of Scotland's population lived in large urban and other urban areas, 20% (over 1 million) in accessible small towns and accessible small rural areas and 9% (over 500,000) in remote small towns and remote rural areas[208]. The highest population density per council is found in Glasgow City, with a cluster of high-density council areas in the central belt, whilst the lowest population density is in Na h-Eileanan Siar and Highland Council[206].
3.10.4 Over the last decade, rural and island areas have aged the most in terms of median age. Conversely, the areas becoming more youthful tend to be in cities. Over the past decade, the average age of data zones increased the most in Na h-Eileanan Siar (+4.1 years) and the least in Dundee City (-0.1 years)[208].
3.10.5 After housing costs, 19% of people were living in relative poverty in 2017-20. The council areas with the most data zones within the most deprived 20% were Inverclyde, Glasgow City, North Ayrshire, West Dunbartonshire, and Dundee City, while those with the most data zones in the least deprived 20% were Aberdeenshire, Aberdeen City, City of Edinburgh, East Dunbartonshire, and East Renfrewshire (Figure 3.21)[209]. Finally, the Scottish index of multiple deprivation also shows that over half of people on low income do not live in the 20% most deprived areas in Scotland[209].
3.10.6 Among all adults in 2019, 72% described their general health as 'good' or 'very good' and 9% described their general health as 'bad' or 'very bad'. Among children, 95% described their general health as 'good' or 'very good' and 1% described their general health as 'bad' or 'very bad'. Self-assessed 'good' or 'very good' general health in all adults has reduced since 2009 when it was at 77%. The proportion of adults who self-assessed their general health as 'good' or 'very good' varied by area deprivation in 2019, with 83% in the least deprived areas and 54% in the most deprived areas.
3.10.7 Compared to 2019, the findings from the Scottish Health Survey 2020 found that 20% less adults undertook at least 150 minutes of moderate physical activity, 75 minutes of vigorous physical activity, or an equivalent combination per week. The implications of this are currently unclear, as the context for public health in 2020 presented unique and unprecedented challenges with the emergence of the COVID-19 pandemic[210].
3.10.8 Scotland has the lowest life expectancy in western Europe. There is a strong relationship between deprivation and life expectancy, with people living in more deprived areas expected to have shorter lives. In the most deprived 10% of areas in Scotland in 2018-2020, life expectancy at birth was on average 68.9 (± 0.3) years for males and 75.4 (± 0.3) years for females. In contrast, in the least deprived areas, it was 82.4 (± 0.3) years and 85.6 (± 0.2) years respectively[211].
3.10.9 The physical environment can influence health directly (e.g. through air quality or water pollution) and more widely through how people interact with the natural and built environment (e.g. enjoying well-designed public and/or green spaces within our towns and cities). The impact of environmental factors such as climate, geography, geology, topography and environmental hazards on health is termed the environmental burden of disease, much of which (in theory) could be preventable[212]. Key service areas such as social care, housing, education, employability and leisure also have a relationship with health inequalities and health improvement[213]
3.10.10 Socioeconomic inequalities, such as those related to income, employment, education, as well as demographic differences, such as age or gender, are associated with unequal exposure to environmental risk factors. They contribute to health inequalities and most often put disadvantaged groups at significantly higher risk to environmental health effects[214]. Age, pre-existing medical conditions and social deprivation are also key factors that make populations more vulnerable to the health impacts of climate change, and they experience greater adverse health outcomes[215].
Key Pressures and Trends
3.10.11 Climate change poses a wide range of potential effects on human health, both positive and negative. For example, increases in flood events can affect dwellings and human health, whilst milder winters can positively affect health and reduce cold-related service disruptions[216].
3.10.12 Scotland's population is ageing, with around 19% of the population aged 65 or over, compared with 17% ten years ago[217]. It is projected that those aged 75 and over will be the fastest-growing age group in Scotland, with estimated increases of 27% by 2026 and 29% by 2041 expected[218].
3.10.13 In the year to mid-2020, 25 of the 32 council areas saw more people move to the area than leave. Only one council area, Midlothian, had more births than deaths over the same period. Areas experiencing the highest population increases include East Lothian, Midlothian, Orkney Islands, and East Renfrewshire. The largest decreases included Inverclyde, Na h-Eileanan Siar, and West Dunbartonshire[217]. Most of the central belt and other urban areas are projected to grow in population. But it is projected that the population in almost half of the 32 local authorities will decline. These are mainly in the west and south west of Scotland[219].
3.10.14 There is significant variation between areas such as the Highlands and Islands and some areas in the Southern Uplands versus the more densely populated areas. The sparsely populated areas of Scotland have a demographic legacy which, without intervention is predicted to result in long term population decline, and shrinkage of its working-age population (projected to decrease by 33% by 2046), on a scale that implies serious challenges for economic development[220].
3.10.15 The number of households in Scotland increased by 15% in 2018-2019, but it is still 19% below the level seen in 2007-2008. New housing supply remains below pre-recession levels and is 19% below the 2007-08 figure, however annual supply has increased by 49% since 2012-13. Housing completions in 2018-2019 show the highest rates were observed in Midlothian, East Lothian, Perth and Kinross, Highland and Orkney Islands. The lowest rates were observed in Dumfries and Galloway, Dundee City, Stirling, Na h-Eilean Siar and Argyll and Bute[221].
3.10.16 Fuel poverty is linked to health issues. Challenging weather, poor energy efficiency at home and reduced heating options (especially in rural areas) can make fuel bills unaffordable, resulting in fuel poverty[222]. In 2018, 25.0% of households (619,000) were estimated to be in fuel poverty, a similar level to 2017 (23.7% or 583,000 households). 11.3% (or 279,000 households, a subset of the 619,000 in fuel poverty) were living in extreme fuel poverty in 2018[223],
3.10.17 Greenspace has substantial environmental and health impacts, and links to community aspects, such as community cohesion, social connectedness and community resilience. Accessing high-quality greenspace can improve the health, wellbeing and confidence of people and communities as well as creating a sense of place[224]. There is a corresponding greenspace indicator[225]. 65.6% of adults lived within a 5-minute walk of their nearest greenspace in 2019, compared to 65.3% in 2018. People living in the most deprived areas are less likely to live within a 5-minute walk of their nearest greenspace than those in less deprived areas. Over 90% of urban Scots feel that it is important to have greenspace in their local area, however, the quality of Scotland's parks and greenspaces has continued to decline, with fewer people using these spaces regularly[226].
3.10.18 Vacant and derelict land can affect a community's health, environment, economy and social cohesion[227]. Overall in Scotland, 28% of the population were estimated to live within 500 metres of a derelict site, though there are differences across the county. Shetland and Orkney had the lowest percentage, both less than 1%. 55% of people living in the most deprived decile in Scotland are estimated to live within 500 metres of derelict land, compared to 11% of people in the least deprived decile[228]. Transforming vacant and derelict land, for example, through new homes or the creation of urban greenspaces, has the potential to deliver both environmental and broader social benefits, including addressing health inequalities[229].
3.10.19 While air quality is generally good in Scotland, improvements are required to reduce the adverse effects caused by air pollution particularly in urban areas. Certain pollution hotspots in Scotland have been declared Air Quality Management Areas (AQMAs). Health effects range from chronic (long-term) disease and premature death to lesser symptoms affecting a large percentage of the population and contributing to greater use of medication, more days of restricted activity, and increased requirements for medical care. Air quality, as well as nuisances such as odour, dust and noise are affected by human activities, including transport, energy generation, industry, waste management, construction and agriculture, and natural sources.
3.10.20 Ill health caused by air pollution is a health inequalities issue. It disproportionately affects the most vulnerable members of society, including the very young, the elderly, people with existing medical conditions and those living in deprived urban areas and deprived circumstances. Thus, reducing air pollution can help protect human health, eliminate health inequalities, and improve the quality of places and habitats in the wider environment[230],[231].
3.10.21 Flooding can have significant environmental impacts and affect people, communities and businesses[232]. When floods occur, they disrupt day-to-day lives and their impacts can be long lasting. Climate change is expected to increase the risk of flooding in coming years, and it also brings additional risks to human health posed by changes to air quality and rising temperatures[232]. In 2018, around 284,000 homes, businesses and services across Scotland were identified to be at risk of flooding. By 2080, it is reported that climate change will increase the numbers at risk by an additional 110,000 properties[233].
3.10.22 It is expected that potential risks and benefits to population and health from climate change will not be evenly distributed. For example, areas of dense urban development will be more at risk of surface water flooding and summer heat stress. Remote coastal communities may be more vulnerable to disruption to services from extreme weather events. The negative health effects are also likely to be disproportionately severe in areas of high deprivation because of the reduced ability of individuals and communities in these areas to prepare, respond and recover[234].
Relevant SEA Objectives
3.10.23 The above baseline conditions, pressures and trends helped identify the following SEA objectives for population and human health:
Population and human health - SEA Objectives
- Reduce the health gap and inequalities and improve healthy life expectancy
- Promote and enhance/improve access to open space, greenspace and the wider countryside
- To protect and improve human health and wellbeing through improving the quality of the living environment of people and communities
- Increase sustainable access to essential services, employment and the natural and historic environment
Population and Human Health - Summary of Pressures and Trends
- Projections forecast that the population will continue to rise. Most of the central belt and other urban areas are projected to grow in population. But it is projected that the population in almost half of the 32 local authorities will decline.
- Life expectancy is projected to increase.
- Over the last decade, rural and island areas have aged the most in terms of median age. Conversely, areas becoming more 'youthful' tend to be in cities.
- Climate change poses a wide range of potential effects on human health. It is expected that climate change's potential risks and benefits to population and health will not be evenly distributed.
- New housing supply remains below pre-recession levels and is 19% below the 2007-08 figure, however annual supply has increased by 49% since 2012-13.
- The overall fuel poverty rate in 2018 was 25%, similar to 2017.
- The quality of Scotland's parks and greenspaces has continued to decline, with fewer people using these spaces regularly.
- Derelict and vacant land can affect a community's health, environment, economy and social cohesion.
- Air quality is generally good in Scotland, but improvements are required to reduce the adverse effects caused by air pollution, particularly in urban areas.
- In 2018, around 284,000 homes, businesses and services across Scotland were identified to be at risk of flooding from rivers, surface water and the sea. By 2080, climate change will increase the numbers at risk by 110,000 properties.
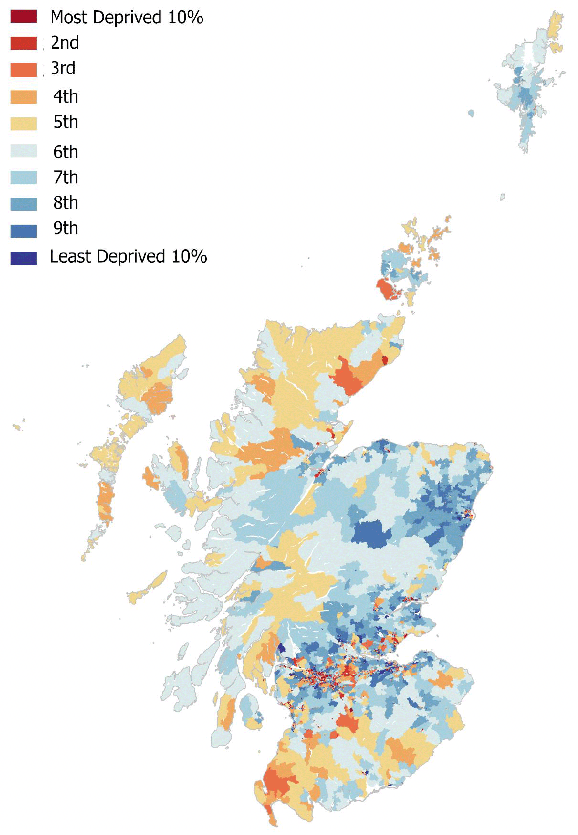
Source: Scottish Government (2020) Scottish Index of Multiple Deprivation Licensed under the Open Government Licence v3.0. Copyright Scottish Government, contains Ordnance Survey data © Crown copyright and database right (2021)
Contact
Email: Chief.Planner@gov.scot