Sandeel fishing consultation: review of scientific evidence
The review of scientific evidence that has been used to inform the development of proposals to close fishing for sandeel in all Scottish waters.
2 Sandeel
Sandeel are part of the Ammodytidae family, consisting of small eel-like fishes, and represent the most abundant species group in the North Sea (around 15% of the total fish biomass, Sparholt, 1990), playing a key role in North Atlantic marine food webs. This key role is associated with the structure of North-Atlantic food-webs, often described as a having "wasp-waist" structure, where a relatively low diversity of forage i.e., prey fish (including sandeel and clupeids) form the intermediate trophic link between a large diversity at both lower trophic levels (phyto/zooplankton) and higher trophic levels (predatory fish, marine mammals, and seabirds). In accordance, variations in the abundance and availability of sandeel or other forage fish can have important effects on both ends of marine food web (top-down regulation of lower trophic levels and bottom-up effects on marine predators) and disrupt the energy transfer across the whole food-web (Lynam et al. 2017).
Sandeel in the North Atlantic and the North Sea refers to a complex of species of which the most abundant is the lesser sandeel (Ammodytes marinus), which supports the largest single-species fishery in the North Sea. The lesser sandeel is a winter-spawning species which lay eggs on the sand in winter months, with planktonic larvae occupying the water column from hatching in February - April to settlement in May - June. Settlement marks a key transition in the sandeel life cycle, after which they form pelagic feeding schools (targeted by marine predators) during the day, burying into the sand at night. Following the summer feeding season, sandeel remain in the sand day and night for the overwintering period, apart from a short spawning period in December - January, until emergence from the sand the following spring. These aspects of sandeel life cycle, particularly this life-long attachment to a sand bank, are important determinants of their distribution.
2.1 Sandeel distribution and movements
2.1.1 Habitat preference and broad-scale distribution
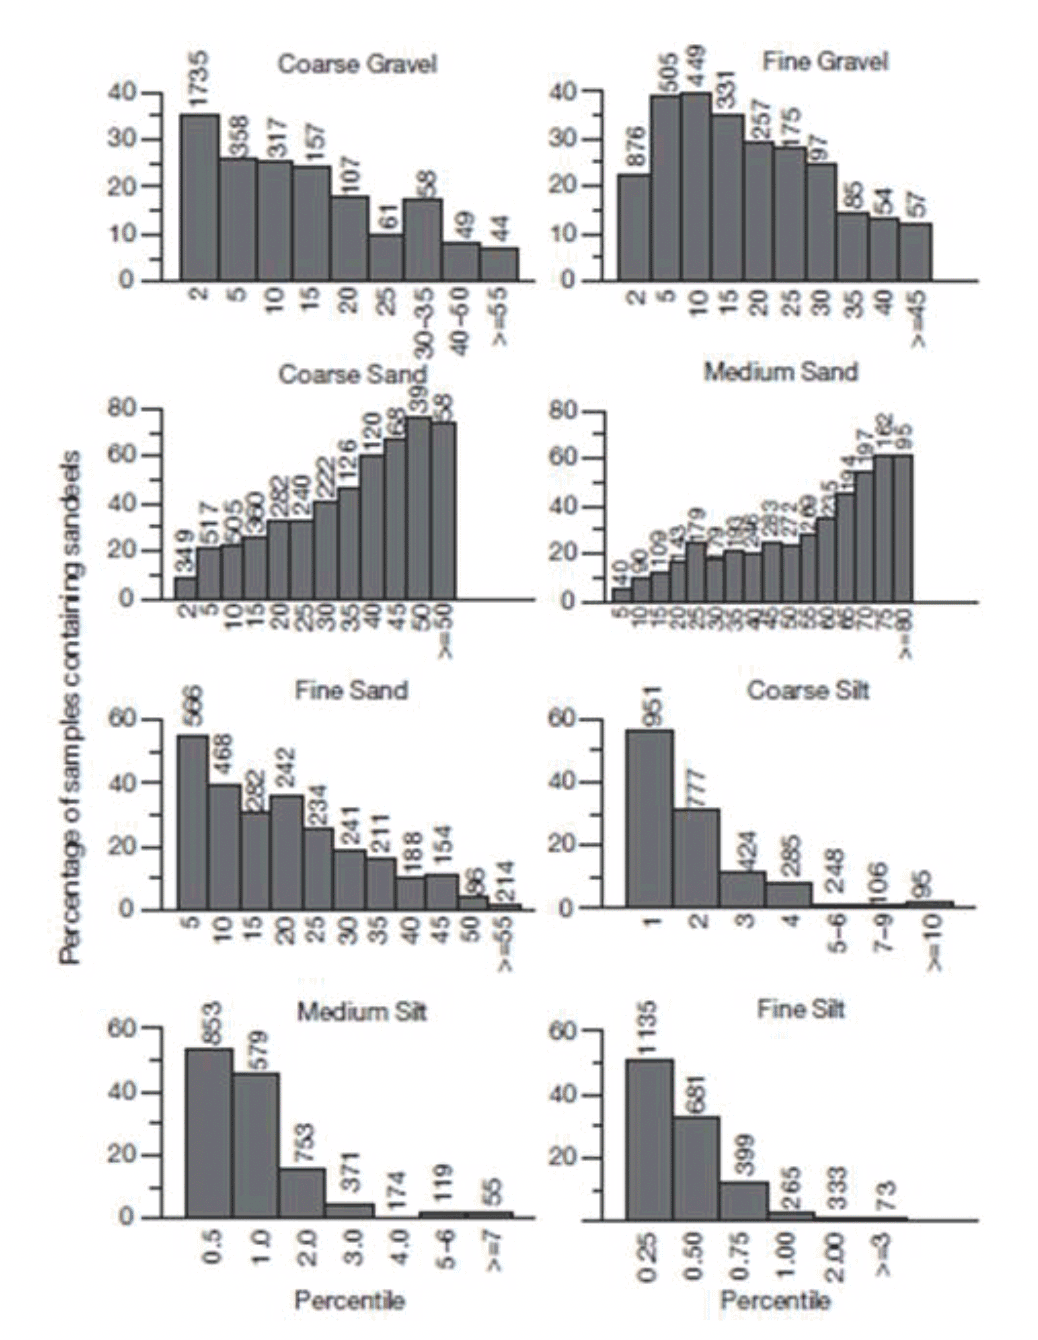
Sandeel demonstrate high habitat specificity and are highly reliant upon the availability of suitable sandy substrates (Wright et al. 2000, Holland et al. 2005, Tien et al. 2017, Langton et al. 2021). A study by the Scottish Government's Marine Directorate on sandeel distribution in sediment grab samples collected in the Firth of Forth found that sandeel preferred medium to coarse sand, presumably as this offers greater permeability and thus higher oxygen concentrations, and avoided fine sediment (Holland et al. 2005, Figure 1), confirming previous results of an experimental test of sediment preference conducted by the Marine Directorate (Wright et al. 2000). Sandeel were also found to prefer water depths of around 50 m (Wright et al. 2000).
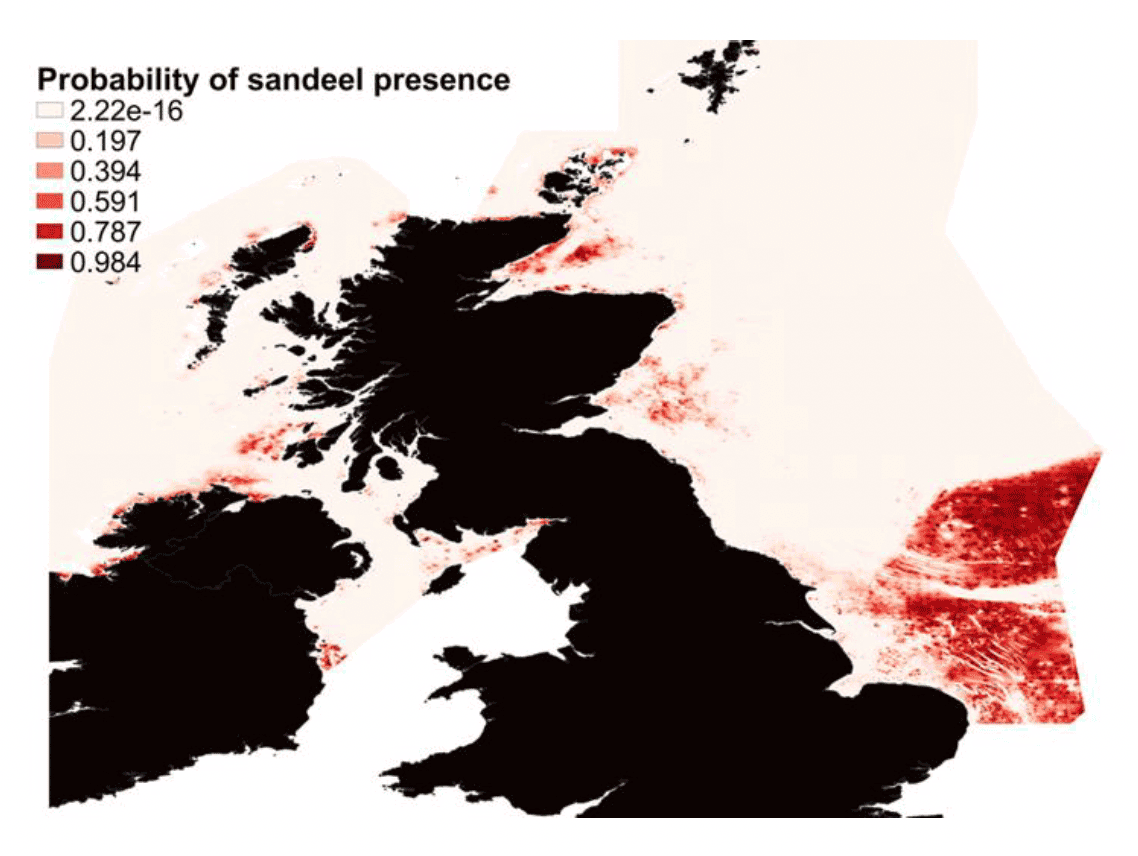
These sediment preferences, along with other environmental variables, have been used by the Marine Directorate to map sandeel habitat suitability and predict sandeel distributions around Scotland, eastern English waters and the Celtic Seas (Langton et al. 2021). The resultant Species Distribution Models (SDM) highlighted an avoidance of fine sediment, a preference of depths around 40 m and a high patchiness of suitable habitat (Langton et al. 2021). The key output of the model was a prediction of sandeel distribution within and beyond the limits of Scottish waters (Figure 2). The model predicts the highest probability of sandeel occurrence on Dogger Bank (North Sea, sandeel management area 1, eastern English waters) and also identifies sandeel grounds in the Firth of Forth (consistent with historic sandeel fishing grounds (Jensen et al. 2011)), the Moray Firth, the east coast of Orkney, east of Dublin, north east coast of Donegal, north and west of Islay, and to the north and west of Lewis. Model predictions were validated against the east coast sandeel dredge survey and both the North Sea and West of Scotland International Bottom Trawl Surveys (Langton et al. 2021).
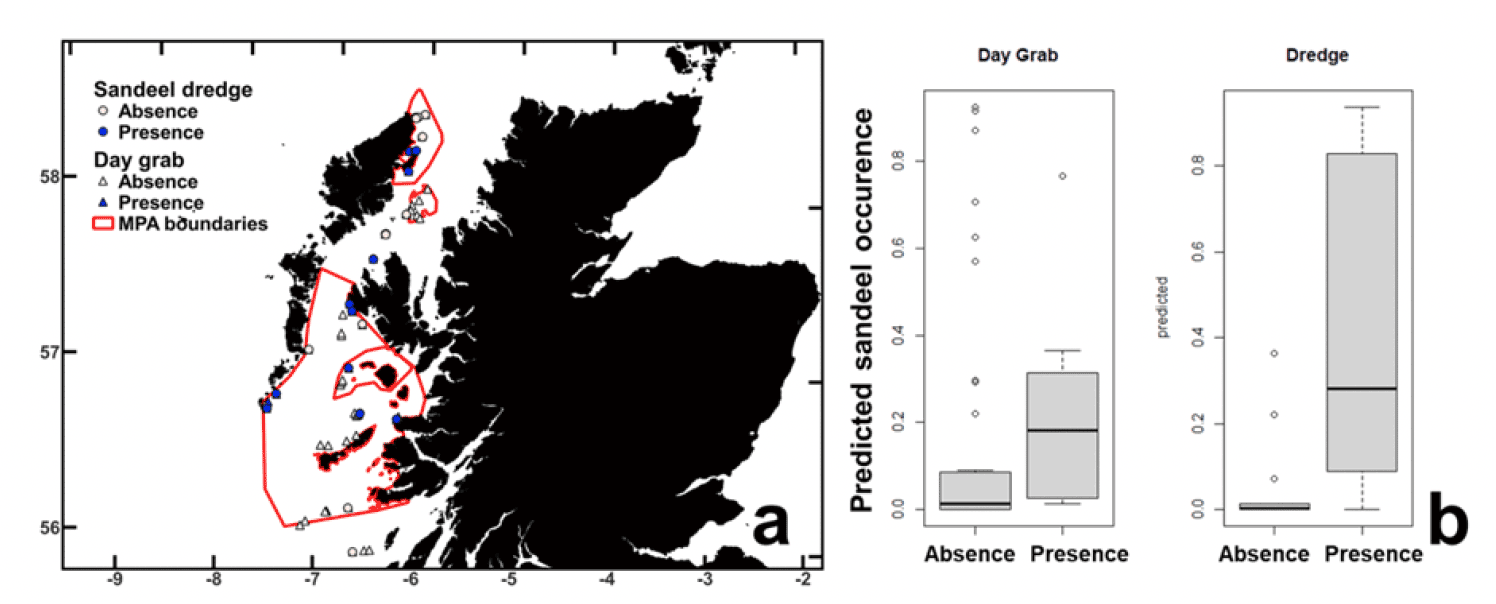
The lack of a sandeel assessment on the west coast of Scotland (there are no recent data on sandeel status in this area) and the designation of several Marine Protected Areas (MPAs) in these areas protecting sandeel directly or indirectly (e.g., sandeel reliant predators), resulted in the Marine Directorate conducting a sandeel survey to the west coast of Scotland in 2019. The observed occurrence of sandeel in grab and dredge samples at various sites on the west coast of Scotland was in good agreement with the Langton et al. (2021) predictions (Figure 3). The main conclusion of this work is that the Langton et al. (2021) SDM provides a good estimate of sandeel distribution in Scottish waters, however a relatively low threshold of probability of occurrence (in the region of 10%) needs to be adopted to capture suitable sandeel grounds to the west of Scotland.
A characteristic of the SDM described above is that it was fitted with sandeel occurrence in grab samples. This implies that model predictions are particularly suited for the stages of sandeel life cycle which take place in the substrate (i.e., at night and during the overwintering period), and deviations from these predictions may occur at times when sandeel form pelagic feeding schools during the feeding season (Spring/Summer, i.e., when sandeel are targeted by chick-feeding seabirds). However, since feeding schools remain closely associated with the substrate, the general patterns of distribution remain valid within the limits determined by the daily pattern of sandeel movement.
2.1.2 Sandeel movements and dispersal
2.1.2.1 Daily movements
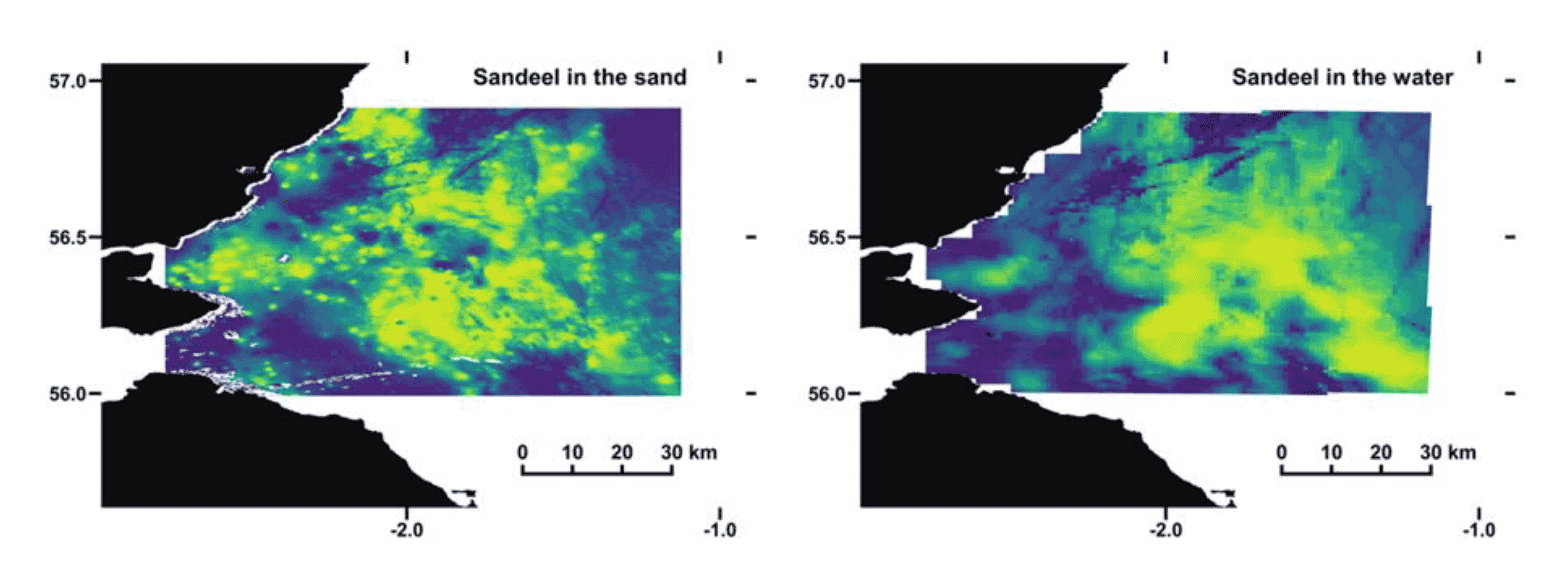
During the feeding season (spring/summer), sandeel form pelagic feeding schools during daylight hours, and tend to forage in the vicinity of the sandbanks in which they bury at night. However, feeding schools have been found to select a slightly different habitat marked by greater depths, often situated on the edge of sandbanks (van der Kooij et al. 2008, Englehard et al. 2008). These deeper waters to the edge of sandbanks offer different hydrodynamic conditions assumed to favour larger zooplankton abundances targeted by sandeel schools. Separate studies on the Dogger Bank area have reported different extents of diurnal movements in sandeel, varying from 1km to 15 km away from the substrate inhabited at night (van der Kooij et al. 2008, Englehard et al. 2008). However, sediment type is still a key explanatory variable in describing sandeel distribution in the water column, as highlighted in a previous study (van der Kooij et al. 2008) and in ongoing Marine Directorate work within the PrePARED (Predator and Prey Around Renewable Energy Developments) project. In fact, predicted distributions of sandeel occurrence in the sand (Langton et al. 2021) and in the water column (ongoing Marine Directorate work) in the Firth of Forth show substantial overlap (Figure 4).
2.1.2.2 Adult movements
After settlement to a particular sandbank (i.e., following the planktonic larval stage), juvenile and subsequent adult sandeel movements have been found to be limited. A study found that the scale of adult mixing was limited to < 30 km (Jensen et al. 2011), and that very little to no exchange was found between sandeel aggregations separated by distances > 28 km, even if these aggregations were connected by continuous stretches of suitable habitat. Early tagging studies revealed that most sandeel were recaptured at sandeel fishing grounds situated within 30 km from release (post marking) locations (Gauld 1990, Wright et al. 2019). Similarly, sandeel captured during the International Bottom Trawl Survey (IBTS) were caught within 30 km of known sandeel fishing grounds (Wright et al. 2019).
The combination of limited adult movements between sandbanks and the patchiness of available suitable habitat indicates that local conditions affecting adult mortality (fishing pressure, food availability and predator abundance) can lead to significant variation in sandeel age and length composition over a relatively fine spatial scale. Local depletion of sandeel aggregations is therefore unlikely to be compensated by the movement of adult sandeel from neighbouring sandbanks, with replenishment of a depleted area more likely dependent of the dispersal of sandeel larvae. As such, recovery may take several years to be achieved.
2.1.2.3 Larval dispersal
Connectivity between sandeel grounds results from the dispersal of sandeel during their planktonic larval stage. While direct tagging studies have been successful in adults, the application of such methods is not possible in larval sandeel due to their small body size. Instead, the investigation of sandeel larval movements relies on two indirect methods: (i) bio-physical modelling of prevailing hydrodynamic conditions to allow the backtracking of larval origins from capture locations (Proctor et al. 1998, Christensen et al. 2008a, b) and (ii) the use of otolith chemistry as natural tags to estimate larval dispersal (Gibb et al. 2017, Wright et al. 2019).
Bio-physical models suggest a high level of regional retention between the current North Sea management areas (these bio-physical model predictions were used to define the management areas) and that larval mixing is common between grounds situated < 67 km apart. However, the probability of mixing between grounds situated > 200 km apart was very low (Proctor et al. 1998, Christensen et al. 2008a, b, Wright et al. 2019). The theoretical predictions from these models, however, require validation from empirical evidence.
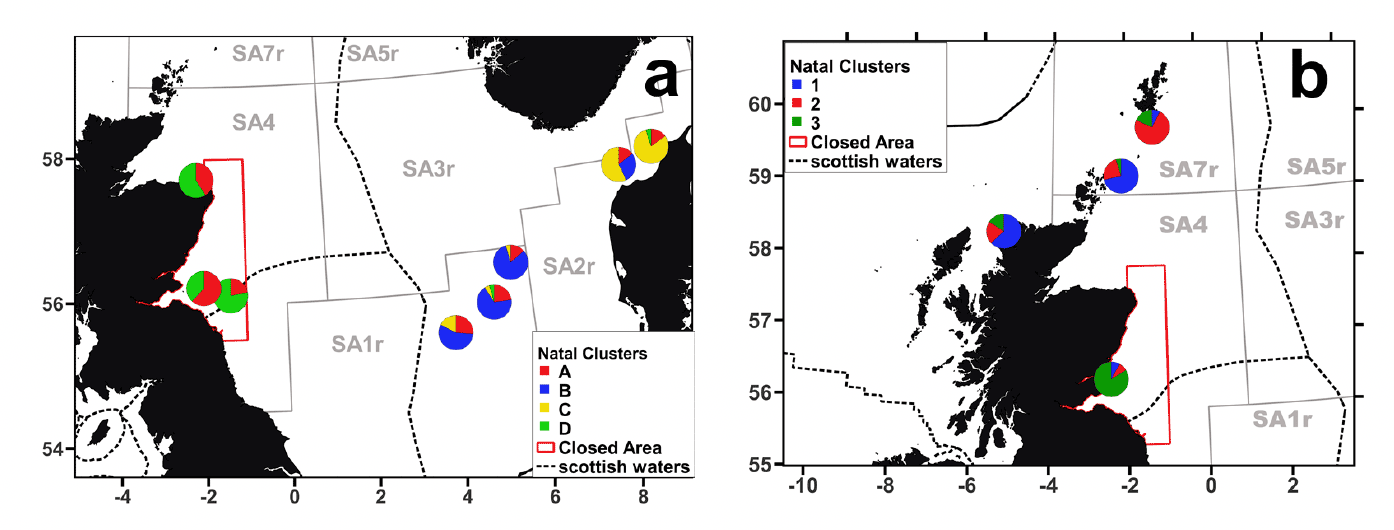
Otolith microchemistry studies rely on two key properties of otoliths (the calcified structures of the inner ear), which is that they grow continuously and are not subject to reabsorption. These studies record the chemical signatures of sequential habitats occupied throughout the life of a fish as the otolith continues to grow and differentially incorporate water elemental concentrations. By characterising the chemical signature of the larval region of the otolith, it is possible to infer the location of larval origin (provided the chemical signatures of larval habitats are known and characterised) or identify the number of unique larval sources contributing to different adult sandeel grounds. Using this method, the Marine Directorate studied larval dispersion at the North Sea scale (Wright et al. 2017, 2019) and within Scottish waters (Gibb et al. 2017). The results indicated that while neighbouring sandeel grounds relied on similar larval sources and that local larval mixing was evident, larval mixing across North Sea management areas was very limited (Figure 5a, Wright et al. 2017, 2019; SA4 was comprised primarily of natal clusters D and A, SA1r of natal cluster B and SA2r of natal cluster C), suggesting that population dynamics were dependent on local recruitment (larvae produced in the vicinity of the sampling area recruited to the juvenile and adult population). These results agreed with the bio-physical modelling, which indicated that oceanographic processes were the primary influence on the scale of inter-mixing of sandeel. Similarly, support for the bio-physical models is evident at the scale of Scottish waters. Larval mixing was found between grounds in the North Minch (NW Scotland) and near Orkney (Figure 5b, Gibb et al. 2017; primarily comprised of natal cluster 1), while sandeel grounds near Shetland and in the Firth of Forth relied on distinct (likely local) larval sources (Figure 5b, Gibb et al. 2017; where natal sources were primarily comprised of clusters 2 and 3 respectively).
These results indicate that larval dispersal occurs over a limited spatial range, mostly driven by oceanographic processes. Therefore, recovery of a depleted area will depend on the proximity of connected larval sources, the successful settlement of dispersing larvae and their survival to maturity - processes that are likely to take several years. Simulations of recovery after local depletion in an area of 50 km in diameter suggested that replenishment from neighbouring grounds may lead to recovery within 1 - 3 years (Wright et al. 2019), however, direct observation from commercial data revealed that some grounds had not recovered after periods > 8 years (Johannessen & Johnsen, 2015). However, delays in recovery can also result from environmental changes and the unsuccessful settlement and survival of dispersed larvae (Clausen et al. 2018).
2.1.3 Summary of Evidence on sandeel distributions and movements
The Marine Directorate SDM by Langton et al. (2021) provides useful predictions of sandeel distributions within Scottish waters. While it is directly applicable to sandeel distributions at night or during the overwintering period (based on sandeel collected in the sand), sediment preference is also a key variable in the estimation of sandeel distributions in the water column, at a time when chick-provisioning seabirds can rely heavily on this resource. Sandeel movement at the adult stage is limited and connectivity between sandeel grounds results from larval dispersal, mostly driven by oceanographic processes. The degree of connectivity is also limited and little to no exchange of larvae happen between sandeel management areas, and properties of oceanographic currents (e.g., retention in the Firth of Forth) leads to isolation between sandeel grounds situated within Scottish waters. Following local depletion (resulting from exploitation (e.g., fishing) and environmental change), with recovery driven by larval dispersal and oceanographic processes, it may take several years for full recovery to take place, a process that is uncertain as it is likely also affected by environmental conditions (e.g., climate change effects).
2.2 Effects of climate change
Climate change and changes in sea temperature, particularly, have the potential to affect sandeel abundance and their availability to marine predators through a variety of mechanisms. Fish being ectotherms (i.e., cold-blooded organisms), temperature can have a direct impact on sandeel numbers by influencing physiological parameters such as survival, growth, metabolic or maturation rates, and an indirect influence on fecundity through the availability of their resources. Understanding and accounting for these effects it is therefore necessary if the objective is to (i) adapt the management of sandeel stocks to sustain or improve sandeel resilience in a changing climate or (ii) set realistic conservation or management targets accounting for changes in environmental conditions.
2.2.1 Direct temperature effects on physiological rates
Two key characteristics of sandeel biology make them particularly sensitive to a temperature increase during winter: (i) the long overwintering period during which sandeel remain inactive and buried in the sand and (ii) the requirement to build up energy reserves at times when food is abundant due to investment in reproduction at a time of low prey availability (sandeel are capital breeders). As metabolic rate and maintenance costs increase with temperature (VanDeurs et al. 2011), higher winter temperatures are likely to impact the allocation of the limited energy stores to gonad development but will also constrain maintenance (i.e., the energy needed to maintain vital functions) and therefore survival over winter. It was estimated that increasing winter temperatures resulted in a larger threshold size necessary for sandeel to both survive winter and commit to maturation (Van Deurs et al. 2011). In agreement with the increased energy expenditures at warmer temperatures, experimental work by the Marine Directorate has shown that weight loss during the overwintering period increased under warmer temperatures (Wright et al. 2017a). A temperature increase during this period was found to delay ovarian development in sandeel (Wright et al. 2017b), with potential effects on spawning date impacting the early life-history and phenology (timing of key events such as hatching, first feeding and settlement) of the larvae and juveniles produced in these conditions.
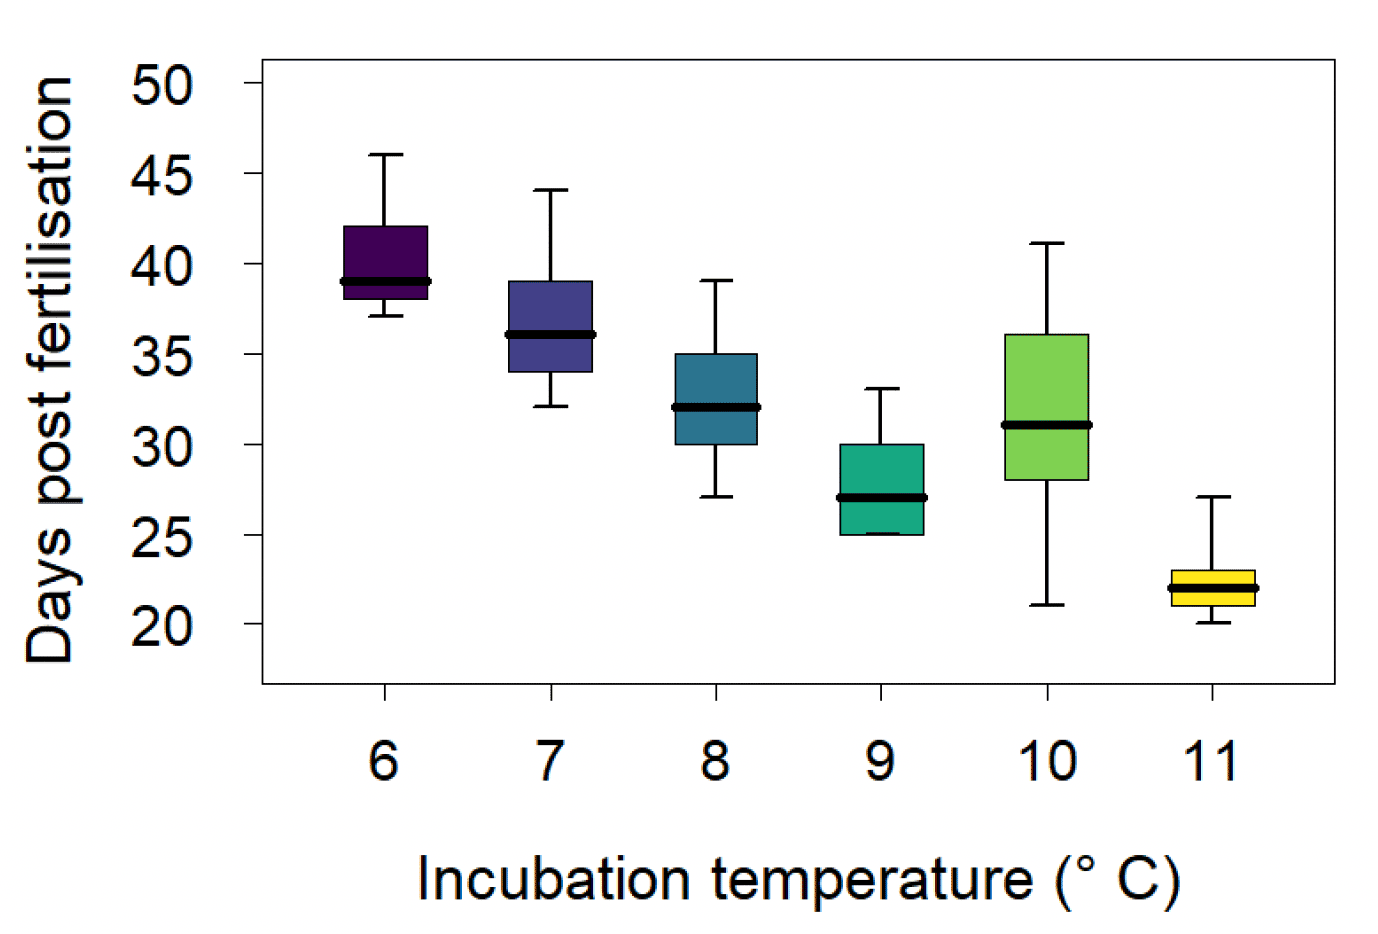
Temperature has also been found to affect egg development in sandeel, and experimental work carried out by the Marine Directorate showed that increasing temperature during the incubation period resulted in a shorter egg development period (Régnier et al. 2018, Figure 6). However, despite this direct temperature effect on egg development, most of the variation in sandeel hatching date in a subsequent empirical study was found to result from variation in spawning date associated with the intensity of the seasonal decrease in temperature during the overwintering period (Régnier et al. 2019). Strong seasonality and a rapid decrease of temperature during the overwintering period was found to be associated with delayed spawning and hatching dates (Régnier et al. 2019). Spawning date was also found to be influenced by adult size, with earlier oocyte (egg cell) maturation found in larger sandeel (Boulcott et al. 2017). Changes in adult size distributions, resulting from the size selective removal of adults from the population by the fishery, may affect the resilience of exploited sandeel population to climate change by promoting indirect selection for later spawning and hatching dates.
Therefore, warmer seas may impose greater pressure on sandeel, resulting in a decrease in overwinter survival and a delay in maturation which may affect the synchrony between the timing of key life-history events during early stage development in sandeel (hatching, first feeding) and the availability of their food resource in a highly seasonal environment such as the North Sea.
2.2.2 Indirect temperature effects on sandeel abundance
The match-mismatch hypothesis suggests that shifts in the relative seasonal timing of the energy-demanding stage of the predator life cycle (e.g., first feeding in sandeel) and peaks in prey availability (e.g., spring peak in zooplankton abundance) impacts predator abundance (Figure 7).
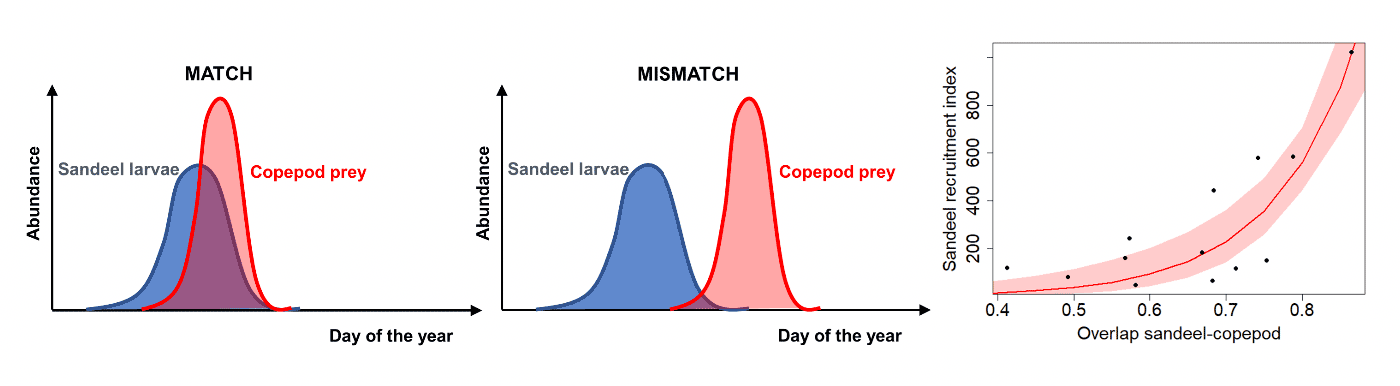
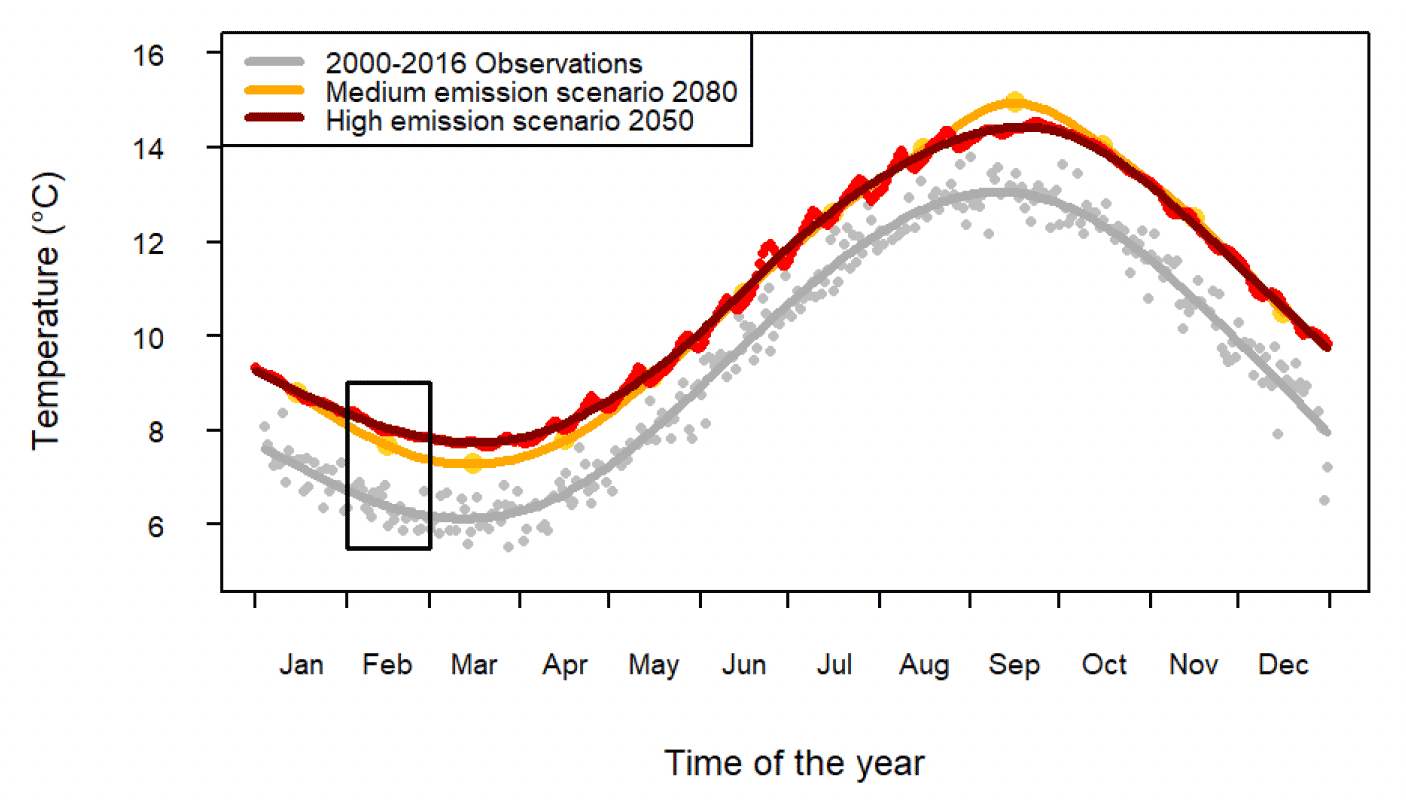
The Marine Directorate studies found evidence in support of the match-mismatch hypothesis as a key driver of sandeel recruitment (Wright & Bailey 1996, Régnier et al. 2017, 2019). Recruitment in sandeel was related to the degree of overlap between sandeel hatching and peak egg production in their copepod prey (Régnier et al. 2017, 2019). The peak of copepod egg production was also found to depend on temperature. However, while hatching date in sandeel varied with the rate of temperature decrease during the overwintering period, the peak of copepod egg production was found to be associated with February sea temperature (Régnier et al. 2019). The dependence of predator and prey key life stages to temperature over distinct periods of time (autumn-winter in sandeel, late winter in copepod) favours the development of asynchronies. Using climate predictions following medium and high greenhouse gas emission scenarios (IPCC 2007, Figure 8), the timing of key life-stages in sandeel and their copepod prey as well as the resulting trophic mismatch were predicted to significantly increase over the next 50 - 80 years (Régnier et al. 2019, Table 1).
| Climate change scenario | C. helgolandicus peak egg production | Sandeel spawning | Sandeel average incubation duration | Mismatch |
|---|---|---|---|---|
| Present data (2000-2016) | 55.5 (40.4-71.2) | 34.6 (17-50.2) | 40.6 (37.8-44.4) | 19.8 (-9-39.6) |
| Average GHG emissions 2080 | 37.3 (24.2-50.3) | 28.6 (24.9-32.2) | 34.4 (33.1-34.8) | 29.3 (14.5-44.1) |
| High GHG emissions 2050 | 31.7 (15-48.5) | 31.9 (28.9-35) | 32.1 (32.1-33) | 41.4 (22.2-60.5) |
2.2.3 Other Climate Change related effects on sandeel
Climate change is also predicted to affect the marine environment through an increase in ocean acidification resulting from increased CO2 levels as well as a decrease in dissolved oxygen (See Wright et al. 2020 for a review). While no empirical evidence of the effects of ocean acidification on sandeel is available, effects have been documented in other fish, with potential impacts on metabolic rate (Enzor et al. 2013) and respiratory performance (Couturier et al. 2013) which may ultimately impact survival and abundance. Ocean acidification may also impact sandeel through bottom-up processes as effects have been documented on both phyto and zooplankton communities (Dutkiewicz et al. 2015, Hammill et al. 2018).
Oxygen levels are predicted to decrease further with climate change (Townhill et al. 2017) and may impose further restrictions on fish distributions. Sandeel spend a considerable proportion of their life cycle buried in the sediment, in anoxic or near anoxic conditions. Experimental work revealed that decreasing oxygen affected the depth at which sandeel buried in the substrate and that they emerged at very low dissolved oxygen levels (Behrens et al. 2007). A decrease in oxygen levels may therefore indirectly impact sandeel survival and abundance through an increase in sandeel exposure to predators, in addition to potential direct effects on fish physiology. While most studies of the impacts of climate change on sandeel have focussed on temperature, other effects such as ocean acidification and low dissolved oxygen levels are likely to play an important role and their cumulative effects may result significant impacts on sandeel abundance and availability to marine predators.
2.2.4 Summary of Evidence on the effects of climate change on sandeel abundance
Climate change acting through an increase of sea temperature, ocean acidification, a decrease in oxygen levels and their cumulative effects can affect sandeel abundance through direct effects on survival and physiological rates, including phenology (the timing of key life-stages). Direct effects on the phenology of both sandeel and their copepod prey can lead to indirect effects of climate change on sandeel abundance through trophic mismatch. High fishing mortality is often associated with the selective removal of older and larger fish and evidence show that these fish tend to spawn earlier. Limiting or closing the sandeel fishery may therefore improve sandeel resilience to the seasonal variation in prey availability (i.e., no selective removal of early spawners). Similar to the mismatch between sandeel and their copepod prey, the abundance of marine top-predators may be impacted by climate change effects acting on the degree of synchrony between sandeel peak availability and the timing of the energy-demanding stage in marine top-predators (e.g., the chick-provisioning period in seabirds) and a fishery closure may promote the resilience of marine top predators as the resulting marginal increase in fish abundance may compensate for mild asynchronies between sandeel availability and predator demand.
2.3 Management and fishery
2.3.1 Sandeel management
Currently, sandeel fisheries are assessed and managed in the North Sea only. Due to the lack of data and the current absence of a fishery, sandeel on the west coast of Scotland are not assessed. Prior to 1995, sandeel in the North Sea were divided into two large units (Northern and Southern North Sea) and two small units (Shetland and Skagerrak-Kattegat areas) based on observed growth differences between these areas. Following a re-analysis of these apparent growth differences, and the lack of knowledge regarding sandeel movements, a decision to combine the Northern and Southern units as a single stock was made in 1995 (ICES 1995). New evidence suggesting limited sandeel movement and mixing as well as high uncertainty in sandeel assessment led ICES to review the North Sea sandeel stock structure in 2010 (ICES 2010). Seven management areas were proposed on the basis of the extent of larval exchange predicted by a biophysical model (Christensen et al. 2008a, b). The proposed structure was revised again at an ICES benchmark in 2016, to account for revision of the biophysical model and new evidence from otolith microchemistry studies (ICES 2017). At present, for assessment purposes the North Sea stock is divided into seven sub-populations or sandeel areas (SAs) (ICES 2023, Figure 9), and analytical stock assessments are currently carried out in SA1r–3r and 4, whereas SA6 is managed under the ICES approach for data-limited stocks. A recent Marine Directorate led review of evidence from biophysical modelling, tagging, otolith microchemistry, and spatial variations in recruitment studies provided support for the current divisions (Wright et al. 2019).
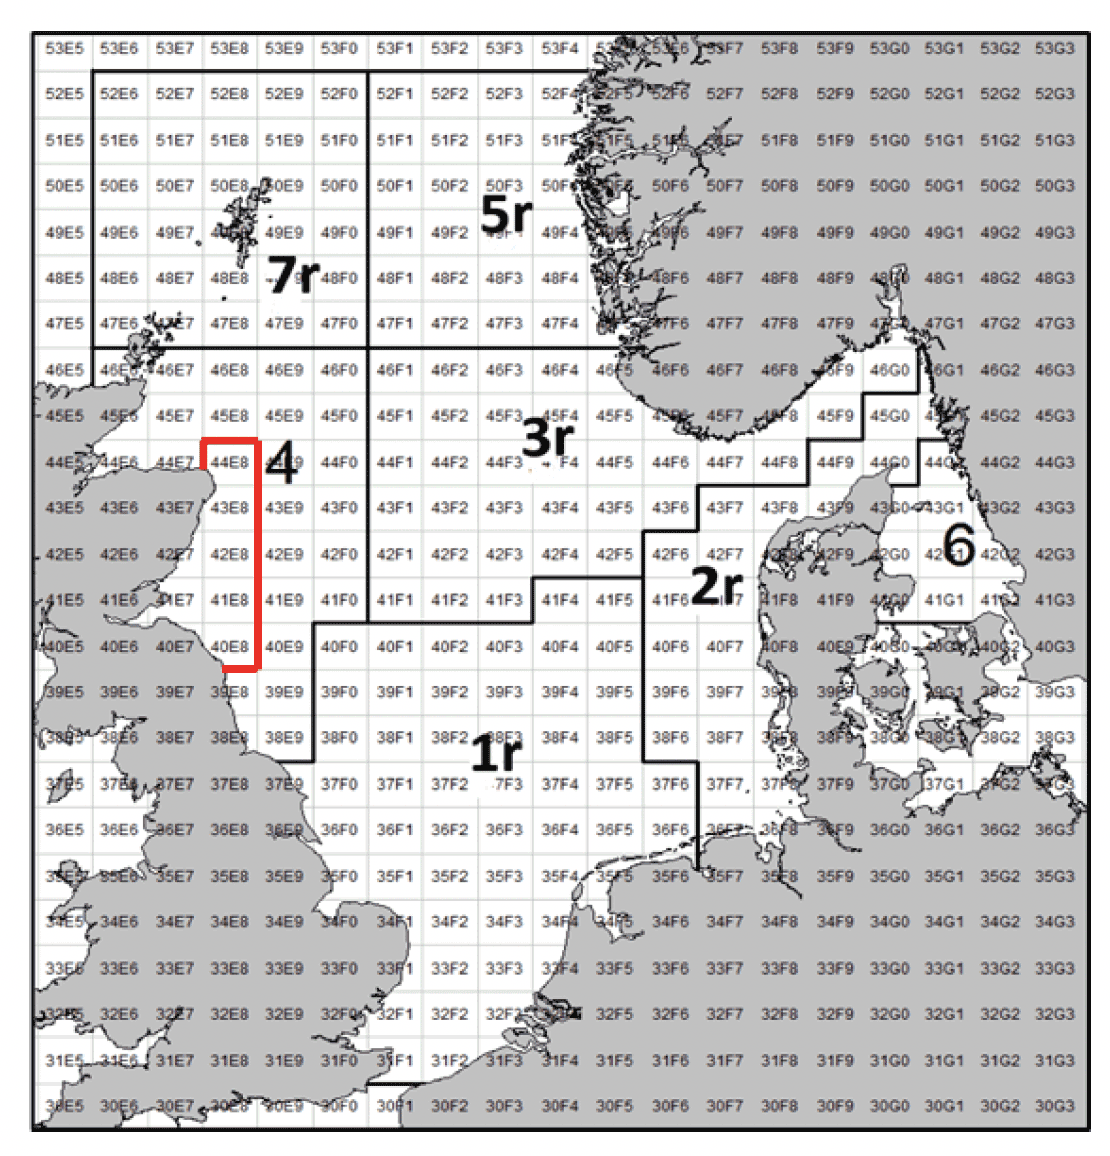
The largest of the sandeel stocks in Scottish waters is SA4, and this is the only one with an active fishery. The expansion of the fishery off the north-east UK coast and evidence of a decline in breeding success of sandeel-reliant seabirds (Rindorf et al. 2000, Daunt et al. 2008) led to the establishment of a precautionary fishing closure within part of SA4 (see Figure 9), corresponding to a reproductively isolated sandeel aggregation (Proctor et al. 1998; Wright et al. 1999).
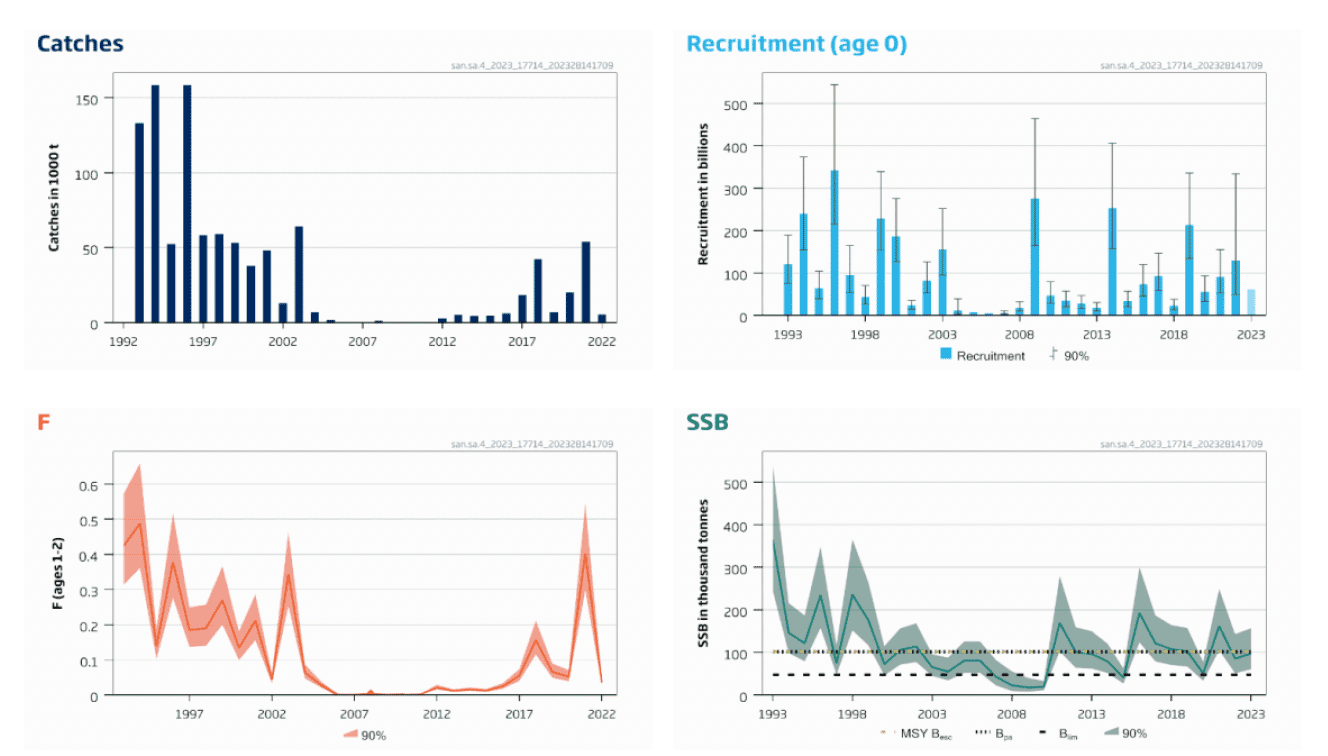
Since 2008, the Marine Directorate has conducted an annual winter dredge survey at grounds off the Firth of Forth and Turbot Bank in SA4. These surveys provide an index of sandeel abundance by age class (i.e., abundance of fish of a given age). The good correlation between the abundances of age classes belonging to the same cohort in consecutive years (e.g., age 0 abundance in year Y and age 1 abundance in year Y+1) of the Marine Directorate survey (ICES 2023) provides confidence in the survey estimates of sandeel abundance indices. This survey is used to fine tune an age- based assessment for the SA4 stock. While most of the stations sampled in the Marine Directorate survey are within the closed area (i.e., fishing mortality is assumed to be minimum), the combination of a interannual correlation and strong variation in recruitment (Figure 10) provides support to the conclusion that variation in sandeel abundance is mostly driven by recruitment in this area (see section 2.2 "Effects of climate change").
The analytical assessment in SA4 estimates the numbers for each age class and spawning stock biomass (SSB) using information on maturity and weight for each age class. While the assessment uses commercial catch data, the high variability in fisheries landings and the lack of age-0 (i.e., fish born the year of the survey) sandeel in the commercial catch means that the dredge survey index has a strong influence on the estimate of stock size and recruitment. ICES advises on a total allowable catch (TAC) based on an escapement strategy, whereby a fishery should only be allowed to operate if the stock assessment indicates that the spawning stock will be above a precautionary spawning biomass level (Bpa) the following year. Due to the uncertainty in forecasting future Bpa for short lived species like sandeel, a ceiling to the maximum fishing mortality (Fcap) is also set. Owing to the relatively low productivity of sandeel in SA4 (Boulcott et al. 2007, Boulcott & Wright 2011, Rindorf et al. 2016) this Fcap is much lower than that for other North Sea sandeel stocks.
An important caveat of this method is associated with the fishery closure on the east coast of Scotland as: (i) the representativeness of the recruitment estimated to the whole SA4 can be questioned when most of the stations sampled in the winter dredge survey are located within the closed area, (ii) inversely, commercial data used to estimate the abundance of older age classes originate mostly from the area open to fishing and (iii) the advised TAC for SA4 will be, in practice, harvested from only a fraction of SA4 (in the part open to fishing), raising concerns of local depletion in the part of SA4 open to the commercial fishery (ICES 2023).
2.3.2 2023 assessment of sandeel in SA4
Recruitment in 2014, 2016, 2017, 2019, 2021 and 2022 was above the geometric mean for the period 2012-2021, while the remaining years after 2010 were below (Figure 10). Fishing mortality (F) has been low since 2005, apart from 2018 and 2021 (Figure 10). The low level of F, together with high recruitment in 2014 and 2019, has resulted in Spawning Stock Biomass (SSB) above the precautionary spawning biomass level (Bpa) between 2016 and 2019 and in 2021. Spawning Stock Biomass (SSB) was between the Limit reference point for spawning stock biomass (Blim) and the precautionary spawning biomass level (Bpa) in 2020 and 2022 (Figure 10). As a result of the above average recruitment in 2022, a Total Allowable Catch (TAC) of 35,020 tonnes was advised by ICES for 2023 in SA4.
2.3.3 Sandeel fishery
Sandeel is the target of the largest single-species industrial fishery in the North Sea. Sandeel are processed for their oil and fish meal for use in many types of food for human and animal consumption. Denmark, Norway, Sweden, UK, and Germany participate in the sandeel fishery (though no quota has been allocated to UK vessels since 2021), with Denmark being the main contributor to the sandeel landings. The fishery is highly seasonal, taking place mostly in the spring and summer. The sandeel fishery developed during the 1970s, and landings peaked in 1999 at 1.2 million tonnes. There has been a significant reduction in landings since 2003, with average landings of 880,000 tonnes for the period 1994 to 2002 and average landings of 300,000 tonnes for the period 2003 to 2016. The vessel size distribution of the fleet has changed through time, with a clear tendency towards fewer larger vessels (ICES 2007).
Currently fishing takes place in five out of seven management areas (SAs 1r, 2r, 3r, 4 and 6; Figure 9). Technical measures for the sandeel fishery include a minimum percentage (95%) of the target species for meshes <16 mm, or a minimum of 90% target species and maximum 5% of the mixture of cod, haddock, and saithe for vessels fishing with meshes of 16-31 mm. Since 2011, the fishery has been regulated by an area-based TAC. From 2005, Danish vessels have not been allowed to fish sandeel before 31 March. The sandeel fishery takes a significant bycatch of small whiting and, to a lesser extent haddock, and this component is explicitly modelled in the assessments for these species.
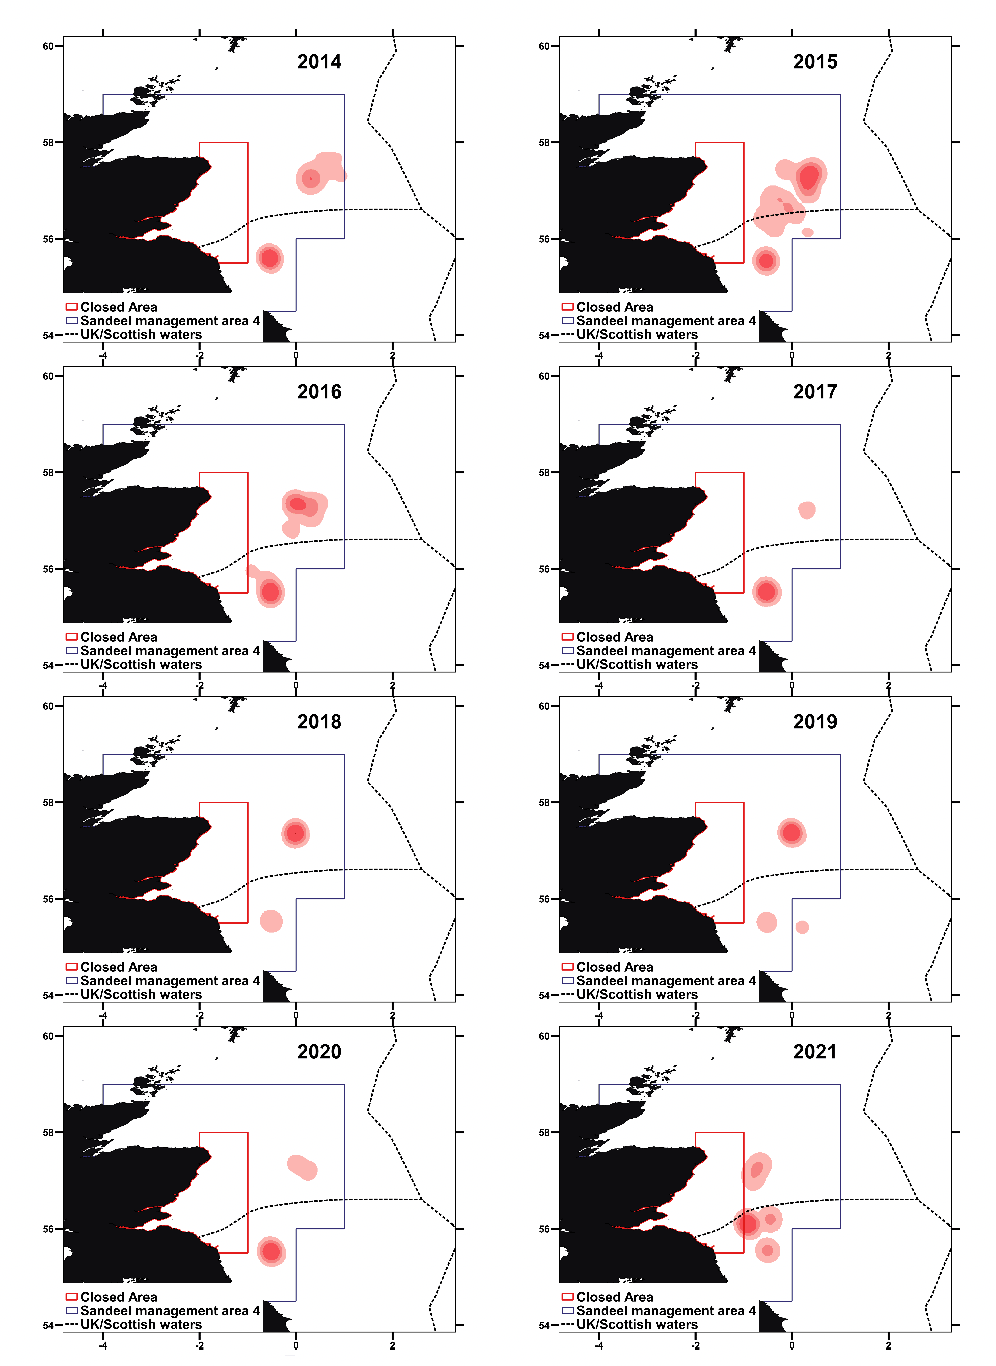
Figure 11 summarises the distribution of vessels fishing for sandeel in SA4 from 2014 to 2021. The data consist of two-hourly Vessel Monitoring System (VMS) location 'pings' from Danish and Swedish vessels, filtered for low speed (moving at ≤ 1 knot) to discount time spent moving between fishing areas or to/from ports. The information is presented as heat maps to avoid inference about specific vessel locations (as these data can be viewed as commercially confidential). Areas where the fleets were targeting Norway pout have not been included. The contouring algorithm used for the heat maps leads to some overlap into the closed area, but no such fishing occurred. Fishing was most widespread in these waters during 2015, but generally focussed on two areas during the years depicted: directly east of Aberdeen (Turbot Bank) and adjacent to the Scottish border with England. The fishing pattern was rather different in 2021, however, with a westward shift of both locations so that fishing was closer to the boundary of the closed area.
2.3.4 Spatial measures for sandeel within Scottish waters
2.3.4.1 Sandeel fishery closure
As a precautionary measure to safeguard marine top predators, particularly seabirds at internationally important colonies in and around the Firth of Forth, an area off the east coast of Scotland, from Rattray Head to St Abbs, was closed to industrial fishing for sandeel in 2000. The extent of the area is indicated in Figure 12 and covers about 27% of SA4 fishing grounds historically targeted by the fishery (Jensen et al. 2011).
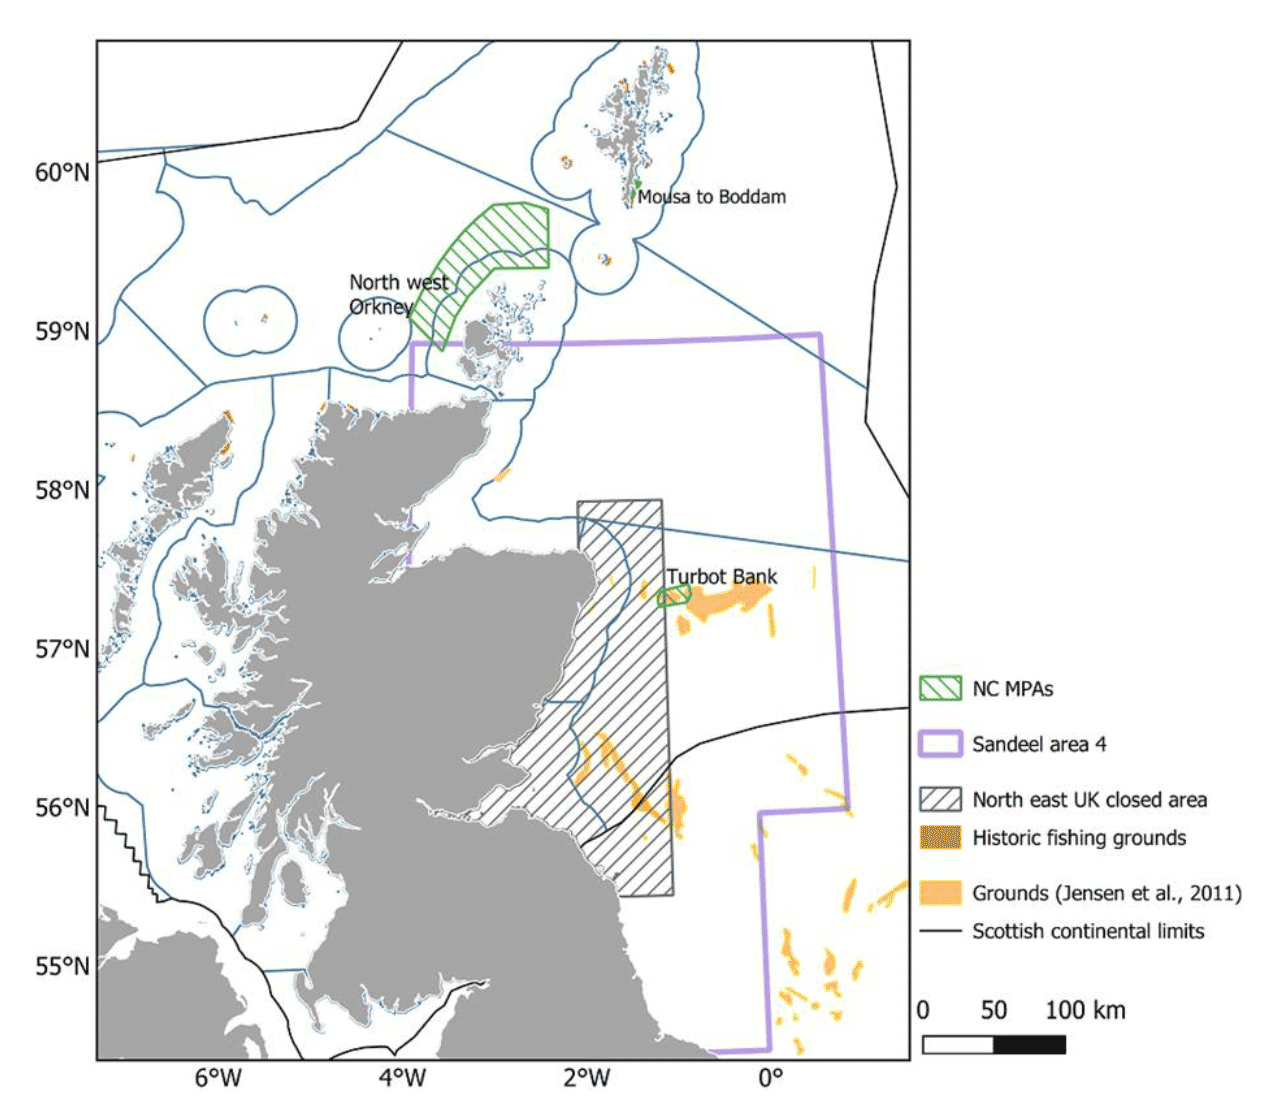
Nature Conservation Marine Protected Areas (NC MPAs)
Due to their ecosystem importance, sandeel were made a Scottish priority marine feature and given their limited movements, various Nature Conservation (NC) MPAs have been designated with sandeel as a key conservation target (Figure 12). In 2014, following two public consultation exercises, the North West Orkney, the Mousa to Boddam and the Turbot Bank NC MPAs were designated under the Marine (Scotland) Act 2010 and Marine and Coastal Access Act 2009 to protect sandeel. Designations were based primarily on assessment of peer-reviewed scientific evidence, using the process as set out in the Scottish MPA Selection Guidelines. These areas demonstrated a regular presence of sandeel and were particularly important to adult aggregations (Turbot Bank), recruitment (Shetland) and/or larval export (NW Orkney, Turbot Bank), and had geophysical attributes supportive to sandeel populations, based on evidence from historic trawl, dredge and continuous plankton recorder (CPR) surveys, particle size analysis (PSA) and oceanographic modelling.
2.3.4.2 Evidence of an effect of the sandeel fishery closure
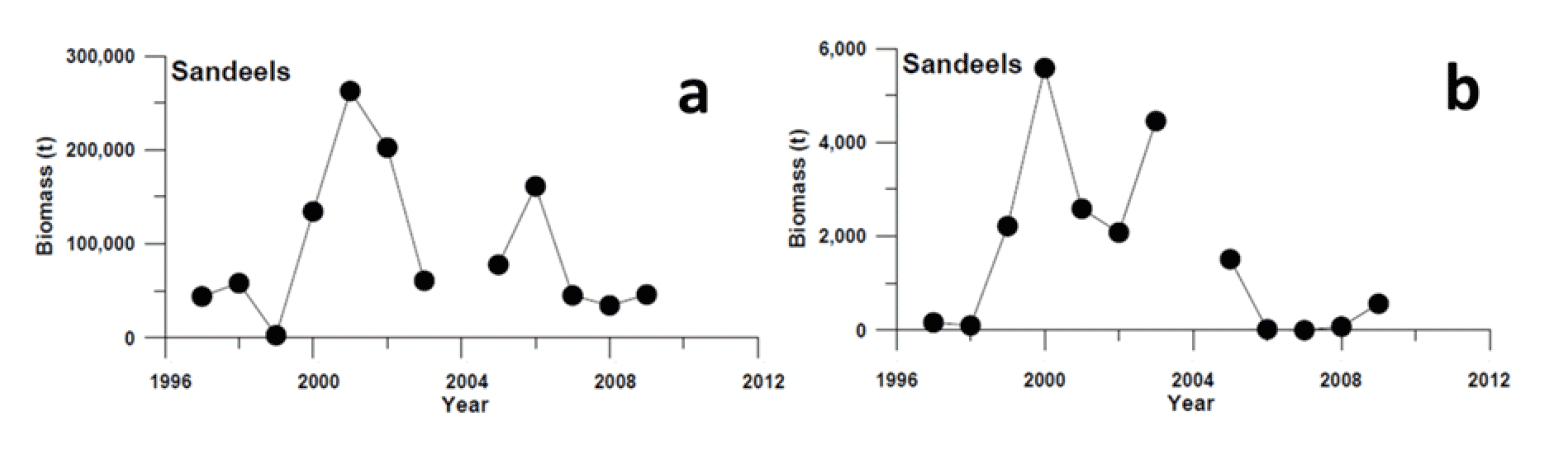
Evidence establishing the effect of the fishery closure is limited. The Marine Directorate led studies that compared measures of sandeel abundance before and during the closure (Greenstreet et al. 2006, 2010), relying on sandeel sampled during the summer months using a variety of gears (demersal trawls, pelagic trawls, acoustic surveys, dredges, and grabs). A substantial increase in sandeel biomass was observed in the Firth of Forth in 2000 and 2001 (i.e., the first years following the closure). This increase was found to be associated with high levels of recruitment in 1999 and 2000, combined with the lack of fishing pressure. However, the cause of the 2000 increase in sandeel biomass (high recruitment in 1999 and 2000) is unclear as it preceded any increase in the local spawning stock, so cannot be attributed to the closure. Since 2001, sandeel biomass has declined to reach levels in 2008-2009 that were similar to those observed in 1997 and 1998 when the sandeel fishery in the area was active (Figure 13, Greenstreet et al. 2010).
Sandeel abundance for each age class estimated from these surveys was then found to be positively related to the breeding success of kittiwake between 1997 and 2003 (Daunt et al. 2008). Together, the sandeel biomass increase in the first years following the fishery closure and the positive relationships between sandeel abundance and kittiwake breeding success were used as evidence to maintain the closure in a review of the effectiveness of the closure (STECF, 2007).
While the trend observed is valid (an overall decrease of sandeel biomass despite the fishery closure), and the estimated sandeel abundance in the water column likely reflects the sandeel available to seabirds at this time of year (as the surveys were designed to coincide with the chick-feeding period), it is important to be aware of the limitations of these studies, particularly due to the timing of the surveys and the gear used. The surveys took place in summer, when some components of the sandeel populations (i.e., particular sizes and age-classes) are in the sand and others are in the water column (some close to the seabed, others closer to the surface). Sandeel activity and location at this time of year depends on size, age (size-assortative schooling), body condition, and local environmental conditions (e.g., water turbidity, local zooplankton abundance, disturbances). The biomass estimated using different gear (targeting sandeel in the water column, near the seabed or in the sand) can therefore be quite different (Figure 13). For example, biomass estimated from acoustic surveys in 2005 is the 3rd highest in the time-series but one of the lowest estimated from demersal trawls (Figure 13). Due to gear-specific selectivity, a composite abundance index from abundances estimated using different gear is challenging and as a result, abundance for the different age classes estimated from these surveys quite unreliable. Often high age 1 abundances are estimated in years following estimated low recruitments (Greenstreet et al. 2006, Daunt et al. 2008), therefore a poor correlation between the abundances of age classes belonging to the same cohort in consecutive years is often found in these surveys, questioning their reliability.
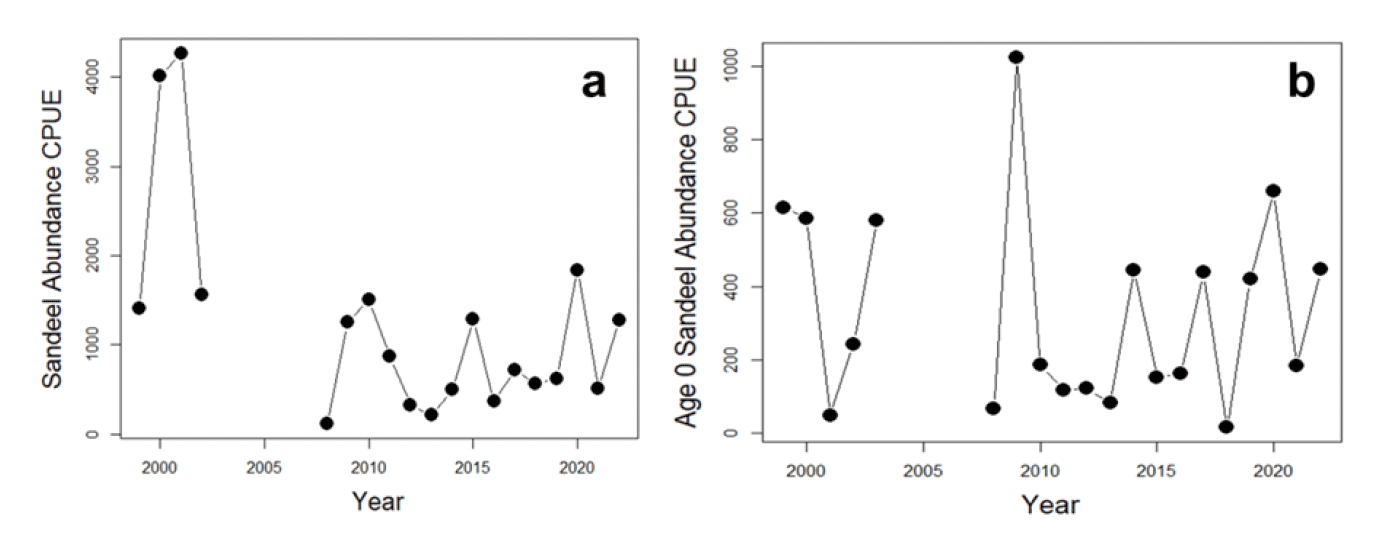
While sandeel catchability is low with a dredge, surveying sandeel in winter, when all sandeel are in the sand is accepted as the most reliable method to estimate abundance for each age class in sandeel (ICES 2010). Unfortunately, the Scottish dredge survey was discontinued between 2003 and 2008, creating a gap in the time-series in the period following the fishery closure. However, abundance indices from the Marine Directorate winter dredge survey are able to confirm the observations of high sandeel biomass in 2000 and 2001 (Figure 14a), resulting from strong recruitment in 1999 and 2000 (Figure 14b). Such high sandeel abundances have not been observed in the survey since 2001. The survey also shows that recruitment is highly variable without any trend, and that the strong recruitment observed in 1999 and 2000 has been exceeded in 2009 and 2020, without leading to sandeel abundance estimates greater than the ones observed in 2000-2001. This result indicates that other sources of mortality besides fishing mortality, possibly related to environmental change, played a greater role in shaping sandeel abundance in the area over the period considered.
Therefore, predicting the effect of further fishery closures on sandeel abundance and their availability to marine top-predators is difficult, as the effect of the closure could be concealed by other sources of mortality. This could be reflected in the data following 2000, as other factors such as environmental forcing or high natural mortality rates may influence sandeel abundances irrespective of anthropogenic pressures (Poloczanska et al. 2004).
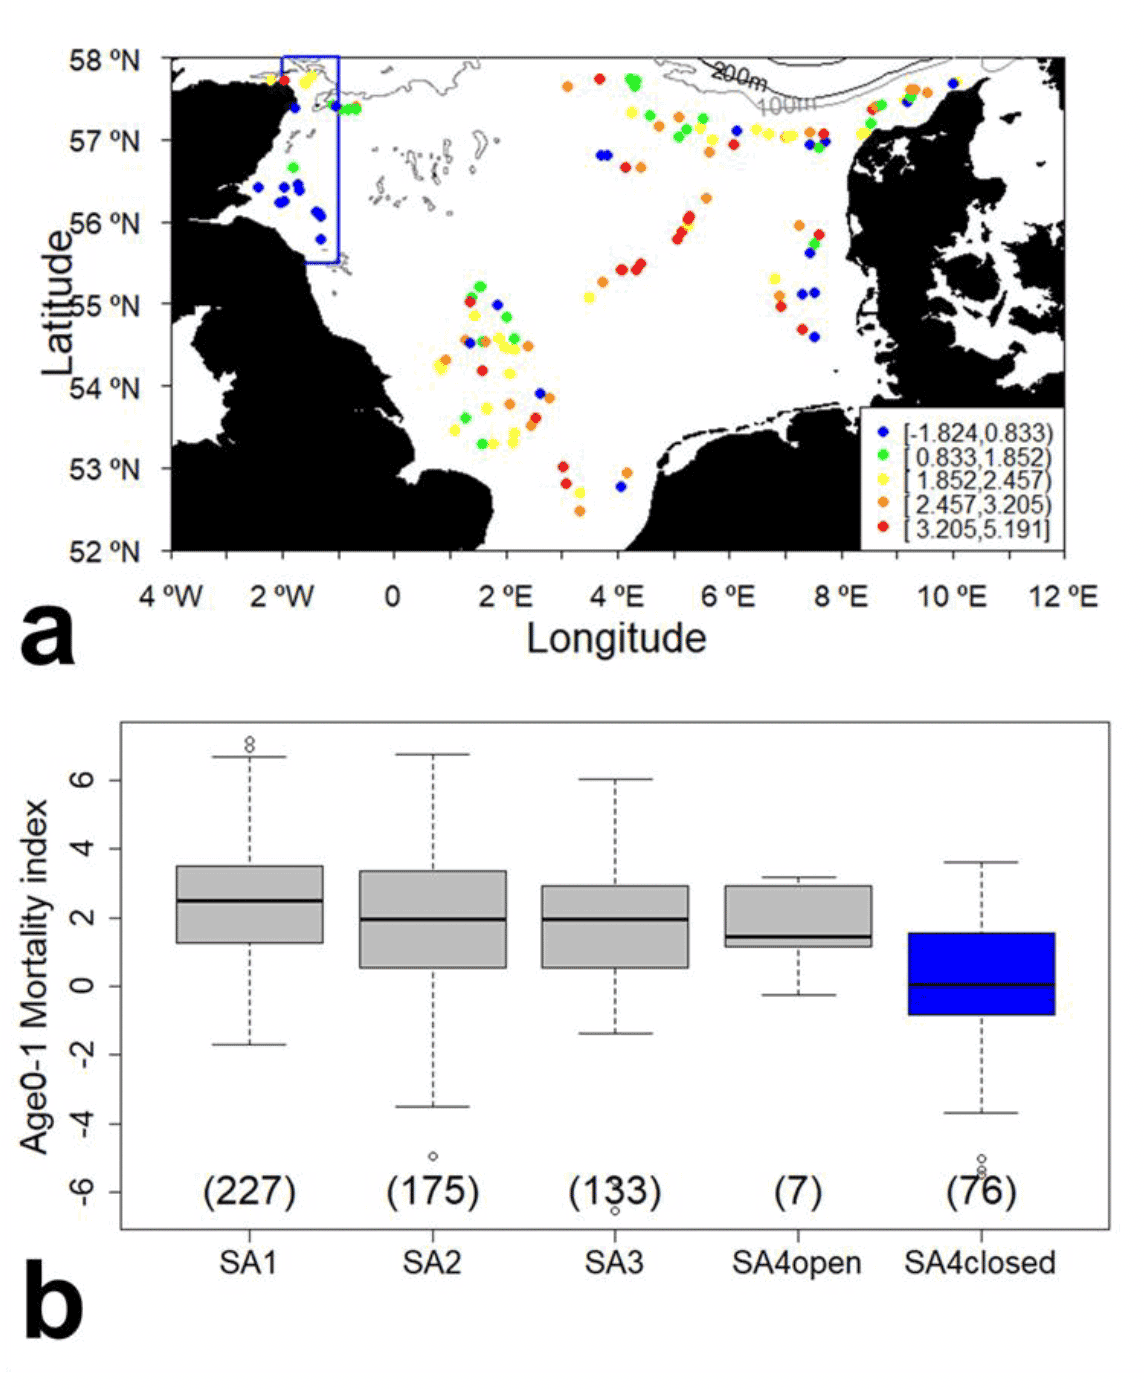
An alternative approach in estimating the future effects of any closure would be to examine mortality indices taken from fished and unfished areas. In the last year, the Marine Directorate winter dredge survey data, as well as the corresponding Danish survey data, have been made available online. These data (compiled between 2009 and 2021) were used to calculate a mortality index for age 1 fish (as age 1 sandeel are the main age class caught by the fishery) by tracking cohorts at stations across the North Sea and comparing spatial variation in the mortality index both within and between sandeel management areas. The results displayed in Figure 15 show that sites in the Firth of Forth and the closed area within SA4 have the lowest age-1 mortality indices compared to stations outside of the closed area or in other management areas where the fishery operates. It is also evident from Figure 15a that age 1 mortality is higher at the north end of the closed area and inshore in the Moray Firth. While this area is not targeted by the sandeel fishery, significant fishing activity does occur (Mapped Outputs - Scottish Marine and Freshwater Science Volume 5 Number 17: ScotMap Inshore Fisheries Mapping in Scotland: Recording Fishermen's use of the Sea - gov.scot (www.gov.scot)) and suitable spawning and nursery grounds of piscivorous fish have been identified in the area (González-Irusta & Wright 2016a, b, 2017), therefore higher mortality in the area may result from both bycatch from other fisheries and higher predation mortality.
While differences in mortality between closed and open areas in the North Sea may appear small in Figure 15b, because the mortality index is calculated on log transformed abundance indices, the reduced mortality rate in the closed area of SA4 translates into a larger proportion of age 1 sandeel surviving. However, these results should be treated with caution, as other sources of mortality may have differing impacts in the various management areas. For example, data from the other management area used in the comparison originates from the Danish survey which takes place in winter, but earlier than the Marine Directorate survey. These potential confounding factors are absent from the comparison of mortality indices between the closed and open area within SA4, however the very low sample size in the open area (N=7) is not sufficient to draw definitive conclusions. While these results seem to provide evidence supporting the effect of the fishery closure on age-1 sandeel mortality, translating into increased age 1 abundance, the lack of samples in the part of SA4 currently open to the fishery limit our ability to conclude decisively.
2.3.5 Summary of Evidence on the potential effects of fishery closure on sandeel
Causes of variation in sandeel abundance are numerous and are driven by fishing mortality and (principally) natural mortality, the latter being influenced by factors such as environmental change (temperature effects, regime shifts) and top-down processes (trophic regulation by marine predators). Evidence shows that causes of variation in natural mortality played a more prominent role than fishing mortality in shaping sandeel abundance in Scottish waters and as these causes of variation are rarely accounted for, an effect of fishing pressure on sandeel abundance is seldom observed. However, while results should be considered with caution, age 1 sandeel seem to have a higher survival rate in the current fishery closure.
While the effect of a fishery closure may be difficult to observe in a changing environment, sandeel are likely to benefit from spatial management measures aimed at reducing fishing mortality due to their life-long attachment to particular sand banks and limited dispersal and movements. As represented in Figure 16, variations in Spawning Stock Biomass (SSB) are mainly driven by variability in recruitment.
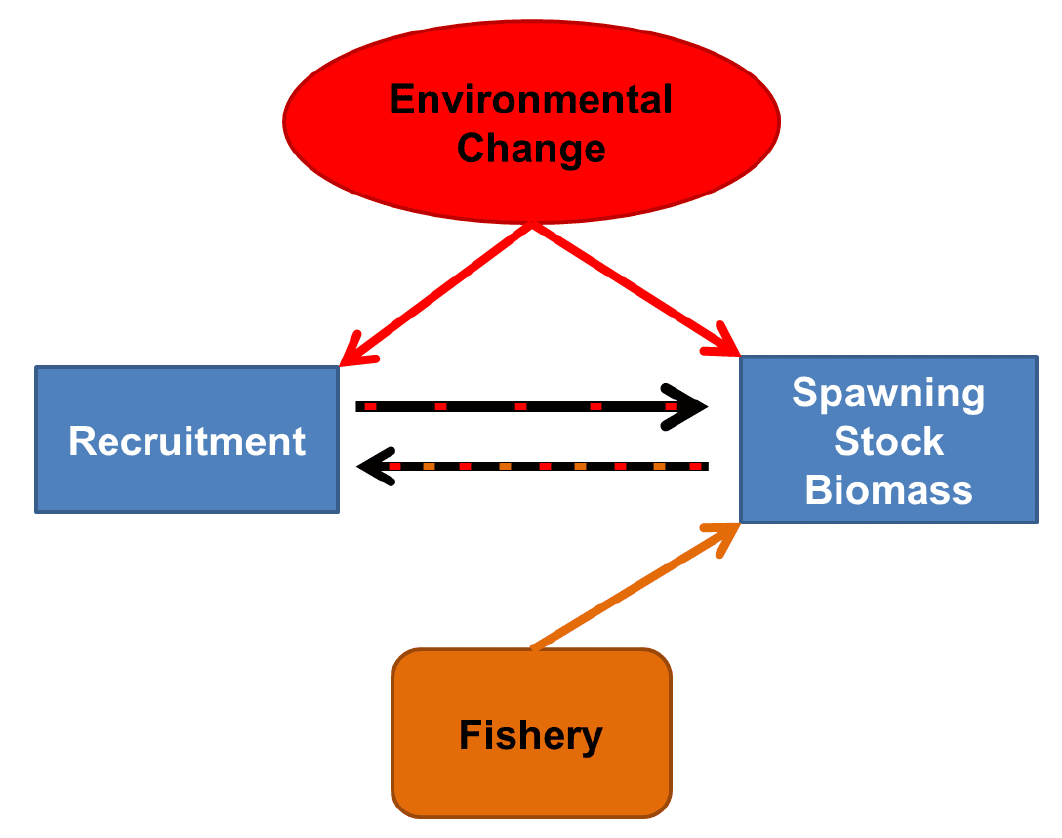
Here recruitment, to a certain extent, is contingent on the size of the reproductive population (SSB). Environmental change has a multitude of effects (direct and indirect) and can affect SSB through the maturation process (see section 3.2.1 Direct temperature effects on physiological rates); recruitment through the effects on phenology (spawning date, incubation time, hatching date); and trophic mismatch between sandeel hatching and the availability of their copepod prey. The fishery can directly affect SSB through fishing mortality and there is some evidence that it may also indirectly affect recruitment by decreasing SSB (through mortality) or by reducing the abundance of large individuals which have a higher fecundity and may spawn earlier (which in turn may affect trophic mismatch and interact with climate change effects). A fishery closure may therefore promote sandeel resilience to climate change by limiting variation in SSB that might affect recruitment and ensuring that sufficient large, early spawning individuals are present in the population. In accordance, a modelling study found that population collapse was more likely under exploitation (Poloczanska et al. 2004).
Contact
Email: sandeelconsultation@gov.scot