Electricity network constraints and the 2024 New Build Heat Standard: research
Research looking into the network constraints issues associated with the electrification of heat for domestic new build developments. The focus of the work was on connection costs for these developments, how the cost is defined, and apportioned to the relevant stakeholder.
A2 Case study report
A2.1 Context and overview
The aim of the technical modelling task within this Research into Electricity Network Constraints and the 2024 New Build Heat Standard project is to explore the connection costs for case study examples given a range of traditional low carbon heating options.
The case studies were selected to explore the breadth of applications and situations that are of most interest to the Scottish Government, including a range of development sizes, locations, and technologies (heating and EV charging). The aim was to define case studies based on real data where possible, using assumptions and estimated data to fill in gaps and to ensure the breadth of examples are explored. Further to this, case studies were designed to align with the scenarios developed by a separate project commissioned by the Scottish Government; Costs of Zero Carbon Heat Research carried out by Ramboll, which explores the operational costs and other implications of operating alternative heating technologies. It is hoped that aligning the case studies will allow the Scottish Government to gain increased value from each of the projects and their findings.
The following sections details the modelled case studies and development examples.
A2.2 Modelled case studies
The project includes three case studies that are formed from modelled developments (i.e. the developments are not real projects), using data and information about real projects and examples gained from stakeholders. This approach was used to ensure the full range of case study examples can be included.
The modelled developments include:
- Private housing development: 300 homes made up of a mixture of 3, 4 and 5-bedroom homes, and 20% affordable homes, in the North Glasgow area. This is a suburban location, with a strong local electrical network. The modelled network capacity is based on the Balmore B/ village substation, which was identified from SPEN's heat map [24].
- Social Housing Development: 60 homes made up of 30 semi-detached houses (3, 4 and 5-bedroom), and 30 flats (1 and 2 bedrooms, 3-storey), in the Dunfermline area. The network in this area is highly constrained, with very little remaining capacity before significant network upgrades are required
- Small Scale Rural Development: Small development of 10 detached homes in a remote rural area. The modelled network capacity is based on the Newcastleton substation near the Scottish border with England, which was identified from SPEN's heat map [24].
A2.2.1 Modelled case study definition and assumptions
The case study modelling for the development of electricity infrastructure is based on the following key concepts:
Technology assumptions: The case study modelling includes understanding the impact of different technology options, including heating technology options and the inclusion of EV charging, on the energy infrastructure and connection costs of the modelled developments.
Table 8‑1 shows the technology assumptions used for each technology and each size of house.
| Technology |
Assumption |
Source |
|---|---|---|
| Gas heating |
No electrical load. Gas load is assumed to be approximately 9kW per property. |
Example gas heated sites provided by project stakeholders |
| Storage heaters |
Assumes storage heating systems installed in each home, with the following electrical ratings:
It is assumed that hot water load is provided by a 3kW electrical emersion heater, managed to minimise peak load. |
SPEN ADMD calculator assumptions |
| Heat pumps |
Assumes that an air source heat pump is installed in each home, at the following electrical ratings.
It is assumed that hot water load is supported by an additional 3kW electrical emersion heater, which is managed to minimise peak load. |
SPEN ADMD calculator assumptions Note – heat pump sizes are quoted in kW for heat. The electrical load is lower than the heat |
| District heating |
Assumes that a district heating system will provide space and water heating across the development. This is fed by bore hole ground source heat pumps and a thermal store. Depending on design, an additional boiler (biofuel/hydrogen) may be needed to support heating load on rare extreme cold periods. Heating load is assumed to be 5kW for 1-2 bed homes, 8kW for 3-4 bed homes, and 16kW for 5+ bed homes. The electricity demand is adjusted for the efficiency of the ground source heat pump technology and the ability to leverage flexibility to reduce the load at peak times. |
Queens Quay case study information [10] DECC Assessment of UK Heat Network costs [28] |
| EV Charging |
A standard EV charge point draws ~7.4kW on full load. A smart charger will ensure that full load charging is avoided at peak times, therefore only adding ~3.7kW to the peak load of the home. |
SPEN ADMD calculator assumptions |
Peak load to be connected: This is the maximum demand that a development is expected to draw from the wider electricity network, and therefore drives the design of the connection.
The After Diversity Maximum Demand (ADMD) is the value used to size network assets and drive network design. This value takes into account 'diversity'; the assumption that customers will use their loads at different times throughout the day, and therefore the maximum demand experienced on the network is significantly less than a simple addition of all connected loads. Calculation of diversity is not consistent between stakeholders, and the impact that low carbon technologies (e.g. low carbon heating and EVs) have on this figure is being explored through innovative projects and initiatives. SPEN are producing a tool which calculates the ADMD of a group of properties given inputs including heating technology and the presence of standard or smart charging infrastructure. This tool was shared with Ricardo to support this project and has been used to drive the assumptions of the model.
| Modelled development |
Heating technology |
Peak load assumption for the development (kVA) |
||
|---|---|---|---|---|
| No EV |
EV charging |
Smart EV charging |
||
| Private housing development: 300 3, 4 and 5-bedroom homes |
Gas heating |
450 |
1,452 |
915 |
| Heat pumps |
1,074 |
2,076 |
1,539 |
|
| Storage heaters |
1,863 |
2,865 |
2,328 |
|
| District heating |
728 |
1,730 |
1,193 |
|
| Social Housing Development 60 homes including 30 3 to 5-bedroom houses and 30 1-2-bedroom flats |
Gas heating |
82 |
288 |
183 |
| Heat pumps |
204 |
410 |
305 |
|
| Storage heaters |
300 |
506 |
401 |
|
| District heating |
126 |
332 |
226 |
|
| Small Scale Rural Development Small development of 10 detached homes. |
Gas heating |
31 |
94 |
82 |
| Heat pumps |
80 |
143 |
130 |
|
| Storage heaters |
77 |
140 |
127 |
|
| District heating |
40 |
103 |
91 |
|
Table 8‑2: Peak load (ADMD) assumptions for the modelled case study developments
Electricity network connection costs: The costs of connecting additional load to the electricity network is dependent on: the status (available capacity) of the existing network around the point of connection; the distance and complexity of the route between the connection point and the development; and the equipment needed on the site of the development to connect each property.
The available capacity of the local network is variable from location to location; some locations might need substantial upgrades to connect even a small development, while the existing network in another location may be able to support a significant development without the need for upgrade.
The cost to install a cable or overhead line along the route between the connection point and the site of the housing development will depend on the distance and the terrain of the crossing. For example, it is more costly to install cables under a carriageway than in earth embankments. Other examples where costs may be high are crossing water and crossing privately owned land. The required equipment for the distribution network and service connections on the site of the development is largely dependent on the load being connected and is much less likely to be impacted by site-specific factors.
The cost assumptions for the required work to connect the modelled case study developments to the DNO network varies based on the calculated ADMD for the connection. The DNOs publish connection charging methodologies, which provide an indication of the likely cost to install electricity assets [6] [7]. There is significant uncertainty about these costs, which is illustrated by a range of costs provided in the connection charging methodology. For example, the connection charging methodology published by SPEN quotes the cost to install a low voltage substation up to 1000kVA at £54k to £148k. This reflects the site-specific nature of much of the work included. The cost assumptions for electricity infrastructure included in the technical model are driven by the published connection charging methodologies, and therefore reflect this range.
Table 8‑3 shows the assumed available network capacity for each of the modelled case study developments, and the network asset requirement assumptions for increasing connection loads.
| Peak Load |
Assumed cost range |
Notes |
|
|---|---|---|---|
| Private housing development: 300 homes in an unconstrained network |
The network available capacity is high, with no constraints at high voltage substations (primary substation remaining capacity is ~14MW). Connection is to a primary substation over a 30m cable route, beneath a combination of carriageway, footpath and unmade ground. |
||
| - |
£262k - £586k |
Onsite equipment includes one substation (<500kVA) and service connections to each property |
|
| > 500kVA |
£269k - £607k |
Onsite equipment includes one substation (>500kVA) and service connections to each property |
|
| > 1,00kVA |
£326k - £763k |
Onsite equipment includes two transformers and service connections. Additional planning standards for restoration of load (>1MW) |
|
| > 1,800kVA |
£381k - £913k |
Onsite equipment includes three transformers and service connections. Additional planning standards for restoration of load (>1MW) |
|
| > 2,800kVA |
£436k - £1,063k |
Onsite equipment includes four substations and service connections. Additional planning standards for restoration of load (>1MW) |
|
| Social Housing Development 60 homes in a constrained network |
The network capacity is highly constrained, with 100kVA of capacity remaining at the high voltage substation, beyond which an additional high voltage primary substation will be required. Primary substations are significant assets, with large costs associated with them compared to lower voltage assets. |
||
| - |
£49k - £105k |
Development is connected via the low voltage network, requiring no additional substations. A 100m connection route is assumed |
|
| > 100kVA |
£4,167k - £6,376k |
Development requires a primary substation, connected via a 500m cable route and low voltage substation (<500kVA) to supply the homes. |
|
| > 500kVA |
£4,237k - £6,536k |
Development requires a primary substation, connected via a 500m cable route and low voltage substation (>500kVA) to supply the homes. |
|
| Small Rural Development 10 homes on an unconstrained rural network |
The capacity at the high voltage substation is not likely to be affected by this scale of additional load. There is no existing low voltage capacity. Connection is to a primary substation 200m away from the development site, using overhead lines. |
||
| - |
£40k - £86k |
Development is connected via a new pole mounted transformer, which is lower cost than a full substation, but has a lower capacity. |
|
| >100kVA |
£44k - £92k |
Development is connected via a new pole mounted transformer, which is lower cost than a full substation, but has a lower capacity. |
|
| > 350kVA |
£78k - £205k |
Where the load is too large to be supported by a pole mounted transformer, a standard ground mounted substation is required. It is assumed that the service to each property is underground cable. |
|
Gas network connection costs: The counterfactual case for the technical modelling is individual gas boilers. The heat load and network connection cost assumptions are based on existing project examples provided by stakeholders of the project. The gas load is assumed to be approximately ~9kW per home. The costs per home will vary, with larger developments generally achieving lower per property costs (assumption for the private housing development is £300 to £500 per plot), while smaller developments generally have higher per property costs (assumption for the social housing development and the small scale rural development is £900 to £1200 per plot).
The estimated gas network connection costs are shown in Table 8‑4 below:
| Assumed gas capacity |
Assumed gas network connection costs |
|
|---|---|---|
| Private housing development 300 3, 4 and 5-bedroom homes |
2,400kW to 3,000kW |
£90k to £150k |
| Social Housing Development 60 homes between 1 and 5 bedrooms |
480kW to 600kW |
£54k to £72k |
| Small Scale Rural Development Small development of 10 detached homes. |
80kW to 100kW |
£9k to £12k |
It is assumed for each development, there is gas network in proximity to the development site, and that no significant extensions or reinforcement is required to connect to the network. It is recognised that this is not the case in all locations – in particular, many rural locations do not have access to the gas network. However, it is the counterfactual case that provides the greatest contrast and challenge to electric heating options.
Heat network costs: The district heating technology requires installation of a heating network, which carries hot fluid to the homes. This is a substantial undertaking, with considerable associated costs. While detailed modelling of these costs is not in scope of this project, it was felt that excluding it entirely would be misleading. Therefore, ballpark heat network infrastructure costs have been calculated, based the DECC Assessment of UK Heat Network costs [28].
Other costs associated with the heating technology: There are several key costs that are not included in the scope of this project, but are important to note:
- Cost of heating technology appliance: This is not included in the scope of this project. However, it is noted that there may be significant differences between the unit cost of a gas boiler, an air source heat pump, a storage heating system and a heat exchange for the district heating. This will impact which technology is considered the most appropriate and cost effective.
- Cost of heat networks: The district heating technology requires installation of a heating network, which carries hot fluid to the homes. This is a substantial undertaking, with considerable associated costs.
- Operational costs of the heating options: The choice of heating technology will impact the associated costs of heating the homes. This should be considered when selecting the technologies.
These costs are being considered as part of a separate project commissioned by the Scottish Government; Costs of Zero Carbon Heat Research carried out by Ramboll.
A2.2.2 Modelled case study results
Each of the case study developments were analysed to produce an indicative cost for the energy infrastructure given different technology options (each heating technology, with and without EV charging or smart charging). In each case, it is assumed that the technology option is adopted consistently across the development. For example, in the heat pump and EV charging case, it is assumed that heat pumps and EV charging is installed in every home in the development. In reality, many developments are designed with a mixture of technologies across the homes, however the chosen modelling approach simplifies the results, and tests the most extreme scenario in each case.
Private housing development of 300 homes: The results of the case study modelling for the private housing development case study is shown in Figure 8‑1. The chart shows a broad range of costs for each of the heating options, which reflects the uncertainty in the costs due to site-specific circumstances.
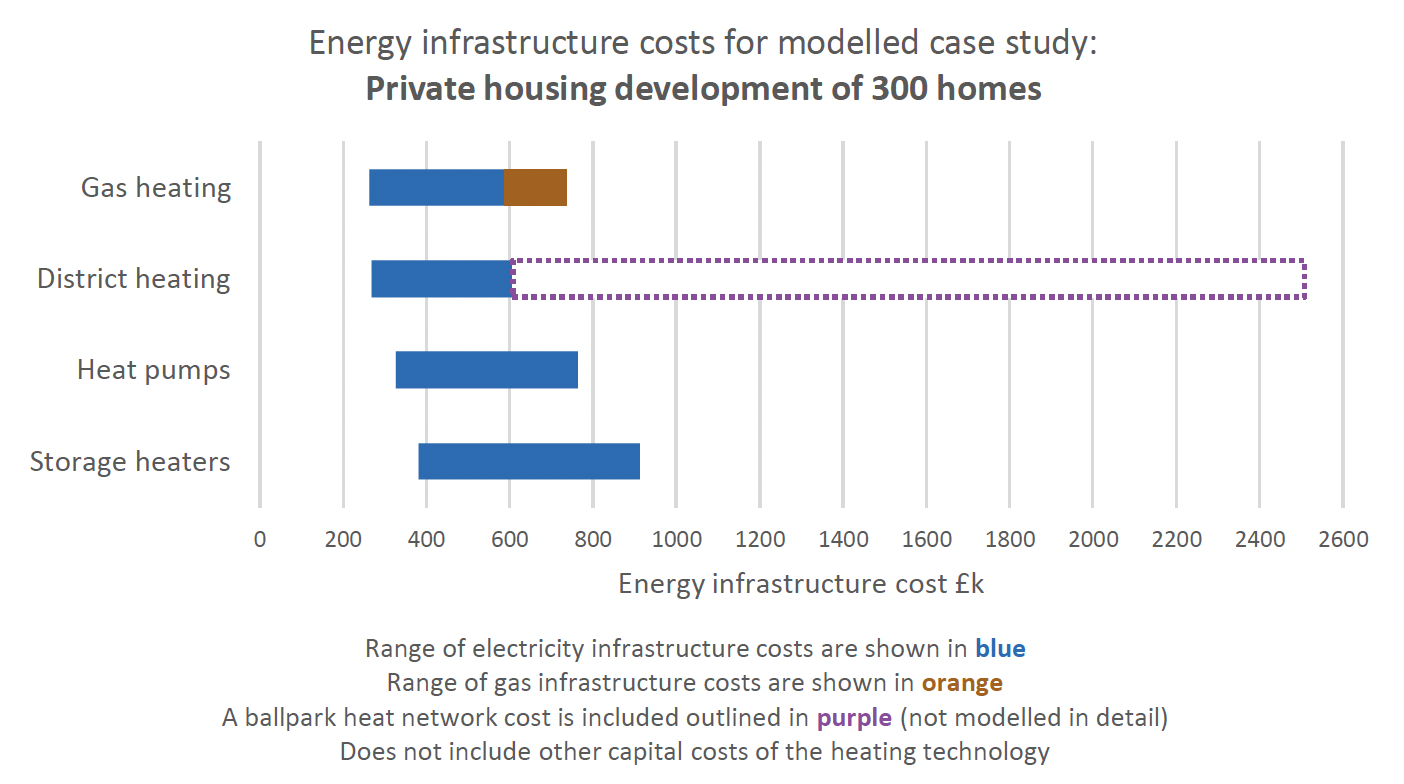
The costs shown in Figure 8‑1 reflect the following:
- Gas heating: This is the case with no electrical heating load. The 450kVA of ADMD electrical load requires a new substation, as well as the associated cables and network equipment. The gas load is 2,400kVA to 3,000kVA, but the gas network costs are modest compared to the electricity network costs.
- District heating: District heating enables the heat source to be shared and optimised across the whole development and optimised over time using the thermal storage built into the system. This allows the heating load to be optimised to minimise the impact on the electricity system. For this reason, it results in only a modest increase in the size of the required electricity network connection (ADMD of 662kVA). For this case study, this increase is low enough not to require additional electricity infrastructure.
- Heat pumps: The efficiency and flexibility of heat pumps means that the required increase in the size of connection is lower than that of storage heaters but is a significant increase above district heating (ADMD of 1,74kVA). In this case study model, this results in the need for an additional substation and additional cabling to support electricity network security resulting in an increased electricity network cost compared to the gas and district heating options. The electricity network cost for this case may be comparable to the combined cost of electricity and gas networks combined.
- Storage heaters: The storage heaters technology option represent the highest impact on the electricity infrastructure costs. Though they are capable of using flexibility to reduce the impact on peak load, they are less efficient than heat pumps and so result in a larger required electricity connection for the development (ADMD of 1,863kVA). With the assumptions used in this case study, this results in the need to install three substations in order to support the load on the development, leading to increased costs compared to the other heating options.
In each of these cases, these costs are payable by the developer. Much of the work is contestable; it may be installed by the DNO, or by an ICP, and the developer is able to review offers from multiple parties to find the lowest cost option. Where the network is being adopted by an IDNO (if installed by an ICP), then the IDNO may pay an 'asset value' to the developer to offset the costs of the installation.
Social Housing Development of 60 homes: The results of the case study modelling for the social housing development case study is shown in Figure 8‑2. This case study is located in a highly constrained network, which is capable of supporting up to only 100kVA of additional load without significant additional infrastructure needed. This reflects a real example network condition in the case study location. Connecting developments of over 100kVA will require a new high voltage substation to be installed. As a high voltage substation is a high cost asset, the impact on the costs is stark.
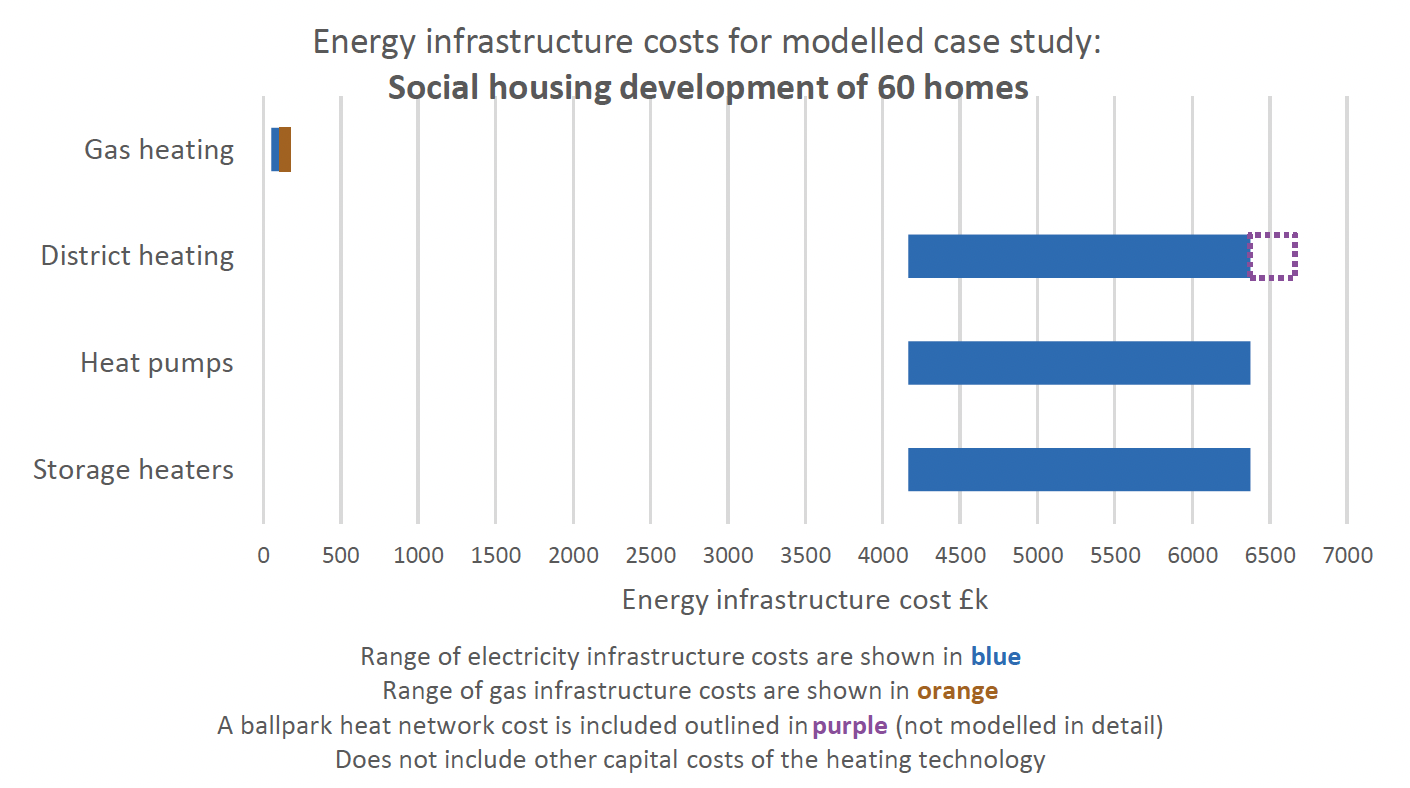
The costs shown in Figure 8‑2 are based on:
- Gas heating: The ADMD electrical load of this case study using gas heating (so not including any electrical heating load) is 82kVA. As this is below the 100kVA that can be supported on the network without major upgrade, the costs are modest. The gas load is 480kW to 600kW, and the gas network costs are a significant proportion of the overall energy infrastructure costs (electricity costs are £49k to £105k, and the gas network connection costs are £54k to £72k).
- Electrical heating technologies: All other heating technologies result in an overall development ADMD electrical load of greater than 100kVA. This results in the need for a new high voltage substation to be installed, at a cost between £4m and £6m. Where this is wholly payable by the developer, this scale of investment is likely to result in the unviability of any new development.
The installation of the new high voltage substation will release significantly more capacity than is needed by this development; a single high voltage substation can be large enough to support thousands of new homes. Therefore, by investing in this new asset, the network will be able to then support other developments as well as this case study.
This changes the context of this case study given the likelihood of other developments connecting to the same area of the network:
- High development area: Where the DNO recognises that there is considerable evidence of wider development in an area where the network is constrained, they can raise this with Ofgem. Developments that need access to capacity in this area may then only pay for the capacity they need, with the rest of the asset value being covered by other developments. A portion of the total asset value will also be socialised (shared amongst the DNO customers).
- Low development area: In an area where there is no evidence of significant additional development, as judged by the DNO, the cost of the additional assets is payable by the developer in the first instance. Any additional connections that do materialise may pay a 'second comer' charge to the first developer to offset costs, but there is no guarantee for the first developer that this will occur. In some cases, there may be an opportunity for developers to seek out other developers active in the area, allowing them to share costs and unlock development potential within an area. Alternatively, innovative approaches may be adopted by the developer or group of developers to reduce connection charges, for example by managing onsite generation.
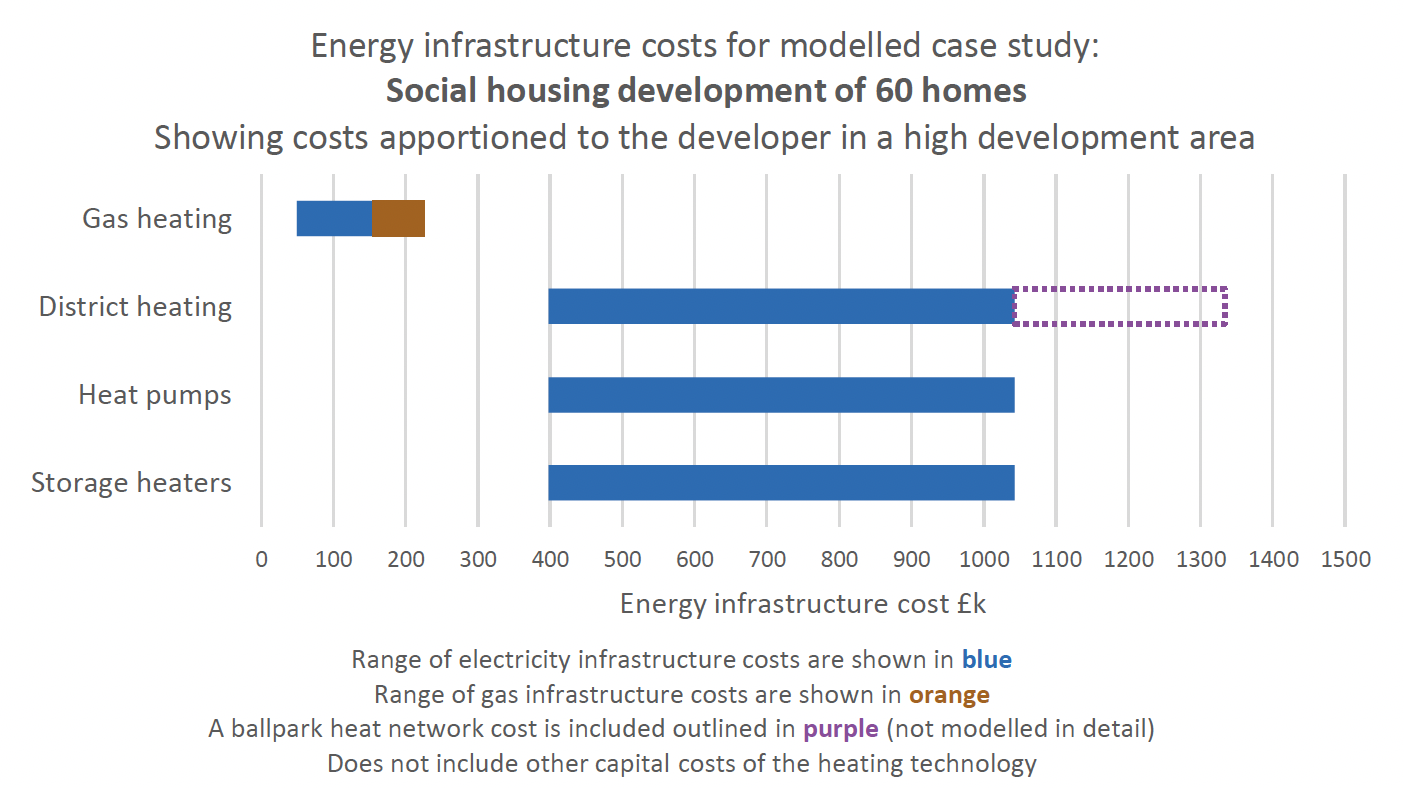
The social housing case study is based on a high development area. This means that from the developer perspective, the cost to establish electricity network connection for the electric heating options is reduced to approximately £400k to £650k.
Figure 8‑3 shows the energy infrastructure costs apportioned to the developer for the social housing development modelled case study.
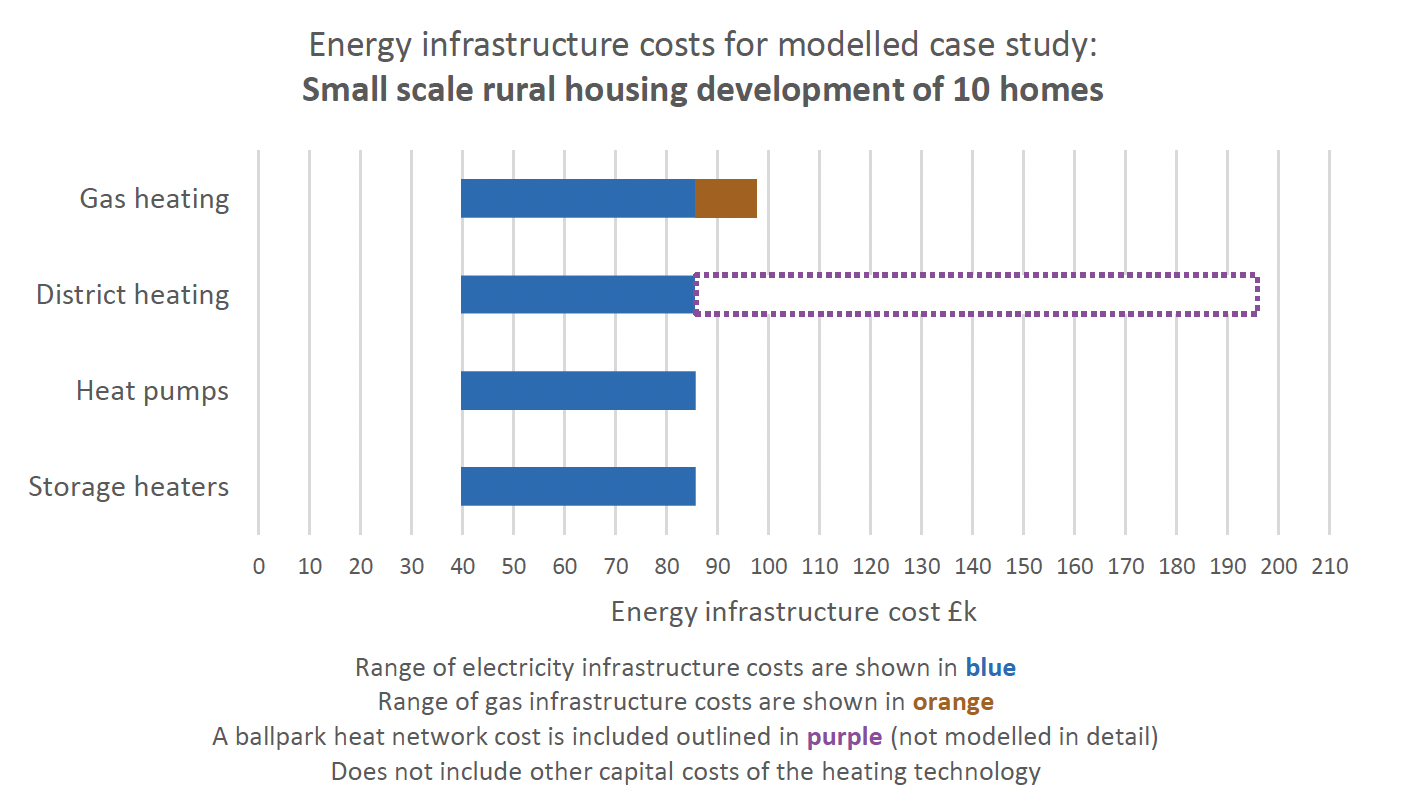
Small Scale Rural Development of 10 homes: The results of the case study modelling for the small scale rural housing development case study is shown in Figure 8‑4. This case study is located in a rural location, where there is a little distance between the site and the point of connection. There is often limited capacity in rural networks, but as this is a small development, capacity is available for the connection.
As with the other case studies, the selection of heating technology has an impact on the ADMD of the case study development. The ADMD of the development using gas heating is 31kVA, while selecting storage heaters increases this to 77kVA, and heat pumps results in an ADMD of 80kVA. The technology with the greatest impact on ADMD for the development in this case is heat pumps. This is because, while they are significantly more efficient than storage heaters, the flexibility assumptions for them reduce with a small development. However, it should be noted that the overall energy consumption of the heat pump-based heating system will be significantly less than storage heaters, which is likely to lead to reduced bills depending on tariff options.
However, this variation in demand is not enough to impact the requirements on the electricity infrastructure. In all cases, it is assumed that the development is connected to the nearest high voltage substation over an overhead line, and a pole mounted transformer (lower cost solution than a substation, appropriate for smaller connections and rural locations) is installed onsite to support the development. A pole mounted transformer can be capable of supporting up to 350kVA, which can comfortably support the development.
Impact of EV charging infrastructure: As with the installation of electric heating technologies, the impact of adding EV charging to the case study housing developments is to increase the maximum demand (ADMD) that the electricity network infrastructure will need to be designed to accommodate.
The inclusion of vehicle charging infrastructure in the private housing development of 300 homes impacts the required electricity network infrastructure required to connect, and therefore the cost of establishing the electricity infrastructure. Figure 8‑5 shows the electricity infrastructure costs for different heating technology and EV charging point assumptions.
In every heating technology case, including EV charging across the development increases the electricity infrastructure costs. In some cases (i.e. heat pumps and storage heaters), the increase in load associated with smart charging does not result in an increase in costs over no charging at all, suggesting that there are cases where smart charging can be used to reduce the impact of EV charging demands on the cost of infrastructure. However, this is not consistent for all cases.
| No electric vehicle |
With electric vehicle chargers |
With electric vehicle smart chargers |
|
|---|---|---|---|
| Gas heating |
£262k to £586k |
£326k to £763k |
£269k to £607k |
| Heat pumps |
£326k to £763k |
£381k to £913k |
£326k to £763k |
| Storage heaters |
£381k to £913k |
£436k to £1063k |
£381k to £913k |
| District heating |
£269k to £607k |
£326k to £763k |
£326k to £763k |
In the social housing development, the addition of EV charging to each property means that even if the development was to use gas heating, the maximum demand would be above the 100kVA for which there is capacity, and a high voltage substation would still be needed. This is the case for standard charging infrastructure (the ADMD of the case study development with gas heating and standard vehicle charging is 288kVA), and smart charging (where the ADMD is reduced to 183kVA).
Where storage heating and vehicle charging is installed, the maximum demand is 506kVA (401kVA with smart charging), which represents the highest maximum demand technology choice. This case will lead to slightly increased costs due to the requirements of a larger substation.
Figure 8‑6 shows the electricity infrastructure costs for the social housing development example case study with different heating technology and electric vehicle charging point assumptions.
| No electric vehicle |
With electric vehicle chargers |
With electric vehicle smart chargers |
|
|---|---|---|---|
| Gas heating |
£49k to £105k |
£4,167k to £6376k |
£4,167k to £6376k |
| Heat pumps |
£4,167k to £6376k |
£4,167k to £6376k |
£4,167k to £6376k |
| Storage heaters |
£4,167k to £6376k |
£4,237k to £6536k |
£4,167k to £6376k |
| District heating |
£4,167k to £6376k |
£4,167k to £6376k |
£4,167k to £6376k |
For the small scale development, where the heating technology is storage heaters or heat pumps, the additional of EV charging (standard or smart) means that a larger transformer is required, increasing the infrastructure costs. This is also the case for standard EV charging with district heating, though selecting smart EV charging means that the additional cost is avoided.
Figure 8‑7 shows the electricity infrastructure costs for the small scale rural development example case study with different heating technology and electric vehicle charging point assumptions.
| No electric vehicle |
With electric vehicle chargers |
With electric vehicle smart chargers |
|
|---|---|---|---|
| Gas heating |
£40k to £86k |
£40k to £86k |
£40k to £86k |
| Heat pumps |
£40k to £86k |
£44k to £92k |
£44k to £92k |
| Storage heaters |
£40k to £86k |
£44k to £92k |
£44k to £92k |
| District heating |
£40k to £86k |
£44k to £92k |
£40k to £86k |
A2.3 Development Examples
The project also identified real development examples that provide context and insight into the project.
A2.3.1 Maiden Hill Development
Maiden Hill, located south of Glasgow, is a development project where they are exploring the use of smart energy management in order to avoid considerable electricity network costs. The development is currently underway involving 3 developers (including CALA Homes, who provided information into the project), IDNO (Energy Assets), DNO (SPEN) and 2 innovation partners (including E.ON, who are providing smart technology).
The initial design of this development included only modest low carbon technologies covering approximately 10% of the homes, and the connection quote from the DNO required no major infrastructure. However, when the site was re-designed to include low carbon technologies in 30% of the planned properties, the DNO assessment and design process revealed a new high voltage substation would be required alongside complex high voltage cabling, costing approximately £7.5m.
In response, the developers, the DNO, the IDNO and technology providers are investigating using energy management technologies to manage the load to within the existing site capacity by maximising the use of electricity generated by solar panels within the development, and managing flexible loads such as hybrid heat pumps and EV charging infrastructure to avoid drawing power at peak times. The technology provider is providing the appliances and the energy management system, which will then be managed by the IDNO.
To date, it is intended that the development will include the installation of the intended low carbon technologies, and the energy management approach will be used to avoid the additional connection costs. In order to make this possible, the DNO needs to be confident that the technology will reliably manage the generation and load on the development site within the boundaries of the connection agreement. If this is not successfully maintained, the wider DNO network may be impacted and the operation may be outside of the statutory limits that all DNOs must adhere to. For this reason, the DNO must be fully on board with the project and work closely with the technology provider.
A2.3.2 Dunfermline congested network
Dunfermline is a high development area, with developments being built and connected frequently. The available capacity within the existing network has been used up; the most recently permitted development was carefully sized at 63 homes, in collaboration between the developer and the DNO (SPEN) to meet but not exceed the available capacity.
Through discussion with SPEN, it is understood that any additional developments will require reinforcements of approximately £5m to £7m. As Dunfermline is a high development area, this cost will not be chargeable entirely to the development that triggers its installation. The developer will be charged at £250k per MVA that they connect to the network. This charge will be payable by all additional connections until half of the infrastructure costs are covered. The reminder of the costs will be socialised through electricity customer bills.
Note – the modelled case study of the social housing development uses assumptions based on the Dunfermline network. This takes the case before the latest development was quoted.
A2.3.3 Insight provided on other real case studies
Several additional real case study examples were discussed by stakeholders, and in many cases, data and information was provided to bring context and insight to the project. The project for which the most complete data was available included:
- CALA Homes case studies: CALA Homes is exploring the additional costs and implications of decarbonised heating options through three case study projects; Craibstone, Ravelrig and Jelly Hill. The timing of this work is such that the major findings are expected after the finalisation of this report, but initial insight has been shared with and taken account of by this project.
- GTC case studies: The cost quotation and associated diagrams were shared for two case study projects. This included gas and electricity infrastructure costs for a project of 272 homes, all heated by gas, and a second project of 536 homes, 30 of which were gas heated, and the others had heat pump heating systems.
- SSEN charging point connection: SSEN provided an example connection quotation, including detailed itemisation of infrastructure and other costs associated with the installation. This provided valuable insight into the formation of these quotes and what can be included.
- West Lothian Council development with limited network capacity: West Lothian Council identified a case study project at Mossend in West Calder which is a site for 69 homes, where there is insufficient capacity at the substation to use air source heat pumps. Releasing the required capacity would require a new substation to be built, which is too costly for the Council to justify. This issue may also impact on the installation of electric charging points for cars.
Contact
Email: 2024heatstandard@gov.scot