Regulation of Legal Services (Scotland) Bill: equality impact assessment
Record of the equality impact assessment (EQIA) carried out in relation to the Regulation of Legal Services (Scotland) Bill.
Data and evidence gathering, involvement and consultation
Stage 2: Data and evidence gathering, involvement and consultation
Include here the results of your evidence gathering (including framing exercise), including qualitative and quantitative data and the source of that information, whether national statistics, surveys or consultations with relevant equality groups.
Characteristic[24]
Age
Legal Professionals
Legal Consumers (General population in Scotland)
Data gaps identified and action taken
While the Roberton report identified the absence of a comprehensive baseline survey of consumers of legal services in Scotland, information about the general population of Scotland has been used to illustrate legal services users.
The Scottish Crime and Justice Survey, number of criminal, civil and conveyancing proceedings provides an indication of the number of legal users.
Disability
Legal Professionals
Legal Consumers (General population in Scotland)
- 2011 census | Scotland's Census (scotlandscensus.gov.uk)
- The Scottish Household Survey 2020 (telephone survey key findings)
Data gaps identified and action taken
See above
Sex
Legal Professionals
Legal Consumers (General population in Scotland)
Data gaps identified and action taken
See above
Pregnancy and maternity
Legal Professionals
Legal Consumers (General population in Scotland)
Data gaps identified and action taken
See above
Gender reassignment
Legal Professionals
Legal Consumers (General population in Scotland)
- The Scottish Public Health Network Report on the Health Care Needs Assessment of Gender Identity Services
- Government Equalities Office, National LGBT Survey
Data gaps identified and action taken
See above
Sexual orientation
Legal Professionals
Legal Consumers (General population in Scotland)
Data gaps identified and action taken
See above
Race
Legal Professionals
- Profile of the Profession 2018
- Diversity Data from 2020/21 Practising Certificate (PC) Renewal
- The report of the Racial Inclusion (LSS)
Legal Consumers (General population in Scotland)
Data gaps identified and action taken
See above
Religion or belief
Legal Professionals
Legal Consumers (General population in Scotland)
Data gaps identified and action taken
See above
Age
General population
Data from the 2011 Census shows that, in the general population in Scotland, 16% were aged 0-14; 13% were aged 15-24; 7% are aged 25-29, 20% were ages 30-44, 21% were aged 45-59, 15% were aged 60-74, 7% were 75-89; and 0.6% were aged 90 and over.[25]
The Scottish Crime and Justice Survey estimates that 75% of adults were confident that the Scottish justice system makes sure everyone has access to it if they need it in 2019/20, increased from 70% in 2008/09 (but unchanged since 2018/19 - 76%).
Younger adults were more confident than older adults that everyone has access to the justice system[26] (84% of 16-24 and 76% of both 25-44 and 45-59 year olds and 70% of people aged 60 and over).
Solicitors
| Under 25 | 25-35 | 36-45 | 46-55 | 56-65 | 66-72 | 73 and older | Prefer not to say |
|---|---|---|---|---|---|---|---|
| 111 | 880 | 654 | 647 | 372 | 46 | 12 | 10 |
| 4% | 32% | 24% | 24% | 14% | 2% | 0.4% | 0.4% |
| Ethnic Group | % total solicitor population | % aged 30 and under |
|---|---|---|
| White Scottish / White British | 86.47% | 89% |
| Prefer not to say | 7.13% | 2.91% |
| Other | 1.48% | 1.57% |
| White Irish | 1.24% | 0.99% |
| Pakistani British, Pakistani Scottish or Pakistani | 0.95% | 1.40% |
| Mixed or multiple ethnic groups | 0.74% | 1.05% |
| Asian British, Asian Scottish or Asian | 0.43% | 0.70% |
| Polish | 0.30% | 0.81% |
| Jewish | 0.29% | 0.23% |
| Indian British, Indian Scottish or Indian | 0.29% | 0.35% |
| Chinese | 0.26% | 0.47% |
| Sikh | 0.16% | 0.17% |
| African British, African Scottish or African | 0.13% | - |
| Bangladeshi British, Bangladeshi Scottish or Bangladeshi | 0.06% | 0.17% |
| Arab British, Arab Scottish or Arab | 0.05% | 0.12% |
| African – not specified | 0.01% | - |
| Black British, Black Scottish or Black | 0.01% | 0.06% |
Legal traineeships[28]
The numbers accessing legal traineeships have been relatively stable for many years (with the exception of 2020). Prior to the pandemic, the "normal" was around 580 traineeships per annum. In 2021 these numbers had increased significantly to 744 and has risen again to a record number of 788 in 2022 (5.9% increase on 2021). The traineeships registered during the legal practice year – which runs from November to October- are spread between 274 organisations across Scotland, with roles in private practice and in-house organisations across a diverse range of employers.
It is worth noting that the Scottish Government is providing funding (from 2021 onwards for a 2 year full time / 4 year part time traineeship) for up to 40 trainee posts in the legal aid sector and these posts have boosted the numbers in 2021 and 2022 above.
| % women | |
|---|---|
| All traineeships across Scotland in 2020/21 | 67% |
| Applicants to legal aid traineeships | 64.50% |
| Profession as a whole | 56% |
| Solicitors on criminal legal aid register | 33% |
| All solicitor advocates | 31% |
| Solicitor advocates (criminal rights of audience | 23% |
One of the goals behind the Legal Aid Traineeship fund was to increase diversity in the legal aid sector.
Disability
General population
The Scottish Household Survey 2019 shows that 15% of adults who lived in social housing were permanently sick or disabled. The equivalent among private renters and owner occupiers was 3% and 1%, respectively[29]
Data from the 2011 Census shows that 19.6% of the population in Scotland have a long-term activity-limiting health problem or disability.[30]
Disabled people less confident that everyone has access to the justice system[31]
- The Scottish Crime and Justice Survey estimates that 75% of adults were confident that the Scottish Justice System makes sure everyone has access to the justice system if they need it in 2019/20, increased from 70% in 2008/09 (but unchanged since 2018/19 - 76%).
- Confidence was lower for disabled people than non-disabled people (71% compared to 76%).
Solicitors
The Law Society's Profile of the Profession 2018 reported that 5% of respondents considered themselves to have a disability.[32]
Of those who considered themselves to have a disability: 37% had a long-term illness, disease or condition, 21% had a physical disability, 13% had stress and anxiety, 13% had deafness or partial hearing loss, 10% had a learning difficulty, e.g. dyslexia, 9% had another mental health condition. Fewer than ten respondents identified themselves as having another condition or disability, blindness or partial sight loss, development disorder, learning disability or preferred not to say. It is not anticipated that the proposals in the Bill with have any negative impact on those solicitors.
Diversity Data from 2020/21 Practising Certificate (PC) Renewal Reported:[33]
Of the 9,387 Law Society members who answered the question on disability, 455 noted that they had an impairment (4.8%). This should be viewed as at least 4.8%, because nearly 8% of respondents selected 'Prefer not to say'. This aligns with the Law Society's general understanding of the profession garnered from the Profile of the Profession in 2018, where 5% of members noted a disability.
Sex
General population
The 2011 Census also showed that 48.5% of the Scottish population were male and 51.5% were female.
The Scottish Household Survey 2019 reported that there was a larger proportion of younger men than younger women, with 30% of men and 28% of women being aged 16 to 34. In the 35-59 age range these were 41% and 40% respectively. Those over 60 and over were reported as 29% male and 32% female.[34]
Men more confident than women that everyone has access to the justice system[35]
- The Scottish Crime and Justice Survey estimates that 75% of adults were confident that the Scottish justice system makes sure everyone has access to the justice system if they need it in 2019/20, increased from 70% in 2008/09 (but unchanged since 2018/19 - 76%).
- Confidence was higher for men than women (77% compared to 74%).
I can see how that reads, what are the other 42%, I've altered to better reflect the position.
Solicitors
The Law Society's Profile of the Profession 2018 also reported that 61% of respondents identified as female, 37% identified as male, 1% stated that they would prefer not to say their gender identity, and less than 1% identified as intersex, non-binary, or a different term.
The Law Society Diversity Data from 2020/21 Practising Certificate (PC) renewal reported that 45% of the Scottish solicitor profession were male and 55% were female[36]
| Women (overall population) | Men (overall population) | Women under 30 | Men under 30 | |
|---|---|---|---|---|
| BAME | 61.7% | 38.24% | 72% | 28% |
| White | 56.7% | 43.3% | 68% | 32% |
| Other | 60% | 40% | 62% | 38% |
| Prefer not to say | 31% | 69% | 38% | 62% |
| Total | 55% | 45% | 67% | 33% |
Legal Aid Traineeships Fund: Summary of Key Data
| Total unique applicants to traineeship fund roles | Percentage | Traineeships in 2020/21 (comparator) Source trainee statistics |
|
|---|---|---|---|
| Female | 290 | 64.58% | 67% |
| Male | 152 | 33.85% | 33% |
| Non-binary | 1 | 0.22% | NA |
| Prefer not to say | 6 | 1.33% | NA |
| Current | |||
|---|---|---|---|
| Type | Gender | Count | % |
| Non-Practising | Female | 78 | 28 |
| Non-Practising | Male | 201 | 72 |
| Total | 279 | ||
| Practising | Female | 123 | 28 |
| Practising | Male | 316 | 72 |
| Total | 439 | ||
| Retired Member | Female | 20 | |
| Retired Member | Male | 100 | |
| Type | Count | ||
| Non-Practising | 279 | ||
| Practising | 439 | ||
| Retired Member | 120 | ||
| Members KCs | |||
| Gender | Count | ||
| Female | 66 | ||
| Male | 352 | ||
| Practising Members KCs | |||
| Gender | Count | % | |
| Female | 32 | 26 | |
| Male | 93 | ||
| 125 | |||
| Women in criminal law | 36/97 | 37% | |
| Men in criminal law | 61/97 | 63% | |
Pregnancy and Maternity
General Population
There were 11,899 births registered in Scotland between 1 October and 31 December 2022.[38]
Solicitors[39]
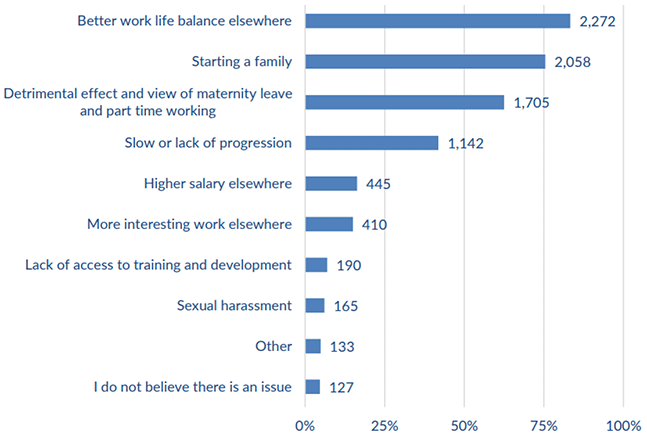
The Law Society's Profile of the Profession 2018 found that women now make up a majority of the solicitor profession. The gender distribution within the profession, though, is uneven. Those on the route to qualification – LLB, DPLP, traineeship – are now disproportionately female. At the higher end of the profession, this imbalance inverts. Women make up fewer than 30% of partners in the Scottish legal profession and fewer than 30% of solicitor advocates. We know from our own research that this issue occurs in other legal professions in Scotland (under 30% of advocates are female; under 30% of Senators of the College of Justice are female). Similar imbalances exist in other UK jurisdictions. 75% of respondents felt that fewer women reaching senior positions was due to it being difficult to reach senior levels and have a family (n=2,063). 8% did not believe that there was an issue with comparatively few women reaching senior positions (n=225). Respondents were asked why they felt so many women leave the legal profession in their 30s and 40s, with maternity leave and part time working being a significant factor:
Gender Reassignment
General population
As of May 2018, around 0.5% of the Scottish population (24,000 people) were estimated to be transgender. The Scottish Public Health Network Report on the Health Care Needs Assessment of Gender Identity Services suggests that 0.5% is the most often quoted likely prevalence of trans people.[40]
Of the 1,160 self-selected trans people from Scotland who responded to the UK National LGBT Survey in 2017, 3.7% said that they had a GRC.[41] However this proportion also includes non-binary respondents who may be less likely to apply for a GRC. The methodology used means respondents are drawn from non-representative sample of LGBT people across the UK, and therefore it is not possible to generalise these findings to the Scottish trans population as a whole.
Information held by NRS shows that around 30 people a year from Scotland obtain full GRCs.
Solicitors
The Law Society's Profile of the Profession 2018 found that eight respondents, fewer than 1%, identified as transgender.
Sexual Orientation
General Population
Although the 2011 Census does gather data of those in same-sex civil partnerships, it did not ask about sexual orientation.
| Heterosexual or straight | 95.4% |
|---|---|
| Gay or lesbian | 2.0% |
| Bisexual | 1.0% |
| Other | 0.6% |
Solicitors
The Law Society's Profile of the Profession 2018 reported 5% of respondents identified as Lesbian, gay, bisexual or other.[43]
| PC Renewal | Aged 30 and under | |
|---|---|---|
| Heterosexual/straight | 91% | 85.54% |
| Prefer not to say | 4% | 10.76% |
| Gay man | 5% | 1.83% |
| Gay woman/lesbian | 5% | 0.64% |
| Bisexual | 5% | 0.73% |
| Other | N/A | 0.49% |
| LGBTQ+ total | 5% | 3.20% |
| PC Renewal | Aged 30 and under | |
|---|---|---|
| Heterosexual/straight | 85.54% | 87.73% (+2.19) |
| Prefer not to say | 10.76% | 6.34% (-4.42) |
| Gay man | 1.83% | 2.73% (+0.9) |
| Gay woman/lesbian | 0.64% | 1.05% (+0.41) |
| Bisexual | 0.73% | 2.03% (+0.3) |
| Other | 0.49% | 0.12% (-0.37) |
Race
General Population
Data from the 2011 Census relating to ethnicity in the Scottish population found that 91.8% of people identified as 'White: Scottish' or 'White: Other British', 4.2% of people identified as 'Polish, Irish, Gypsy/Traveller' or 'White: Other'. 2.7% of Scotland's population identified as 'Asian, Asian Scottish' or 'Asian British'. 'African Caribbean or Black' groups made up just over 1% of Scotland's population.[45]
Solicitors
The Law Society's Profile of the Profession 2018 found 84.6% of respondents described their ethnic group as White – Scottish. 7.4% of survey respondents described their ethnic group as White – Other British. 1.7% of survey respondents described their ethnic group as Asian. Less than 1% of respondents identified their ethnic group as one of the remaining categories. This suggests there is an under-representation of BAME (Black, Asian and minority ethnic) groups in the legal profession. It is not anticipated that this proposal with have any negative impact on those solicitors.
| Ethnic Group | % total solicitor population | % aged 30 and under |
|---|---|---|
| White Scottish / White British | 86.47% | 89% |
| Prefer not to say | 7.13% | 2.91% |
| Other | 1.48% | 1.57% |
| White Irish | 1.24% | 0.99% |
| Pakistani British, Pakistani Scottish or Pakistani | 0.95% | 1.40% |
| Mixed or multiple ethnic groups | 0.74% | 1.05% |
| Asian British, Asian Scottish or Asian | 0.43% | 0.70% |
| Polish | 0.30% | 0.81% |
| Jewish | 0.29% | 0.23% |
| Indian British, Indian Scottish or Indian | 0.29% | 0.35% |
| Chinese | 0.26% | 0.47% |
| Sikh | 0.16% | 0.17% |
| African British, African Scottish or African | 0.13% | - |
| Bangladeshi British, Bangladeshi Scottish or Bangladeshi | 0.06% | 0.17% |
| Arab British, Arab Scottish or Arab | 0.05% | 0.12% |
| African – not specified | 0.01% | - |
| Black British, Black Scottish or Black | 0.01% | 0.06% |
| Women (overall population) | Men (overall population) | Women under 30 | Men under 30 | |
|---|---|---|---|---|
| BAME | 61.7% | 38.24% | 72% | 28% |
| White | 56.7% | 43.3% | 68% | 32% |
| Other | 60% | 40% | 62% | 38% |
| Prefer not to say | 31% | 69% | 38% | 62% |
| Total | 55% | 45% | 67% | 33% |
Religion or Belief
General Population
The analysis of religion in the 2011 Census shows that the proportion of the population identifying with various religions as: 32.4% Church of Scotland; 15.9% Roman Catholic; 5.5% Other Christian; 0.2% Buddhist; 0.3% Hindu; 0.1% Jewish; 1.4% Muslim; 0.2% Sikh; 0.3% Another Religion; 36.7% No Religion; 7.0% Not Answered.
Solicitors
The Law Society's Profile of the Profession 2018 of the legal profession showed that 49% consider they had no religion/faith; 45% reported themselves to be Christian (25% Church of Scotland, 14% Roman Catholic, 6% other Christian); 1% reported being Muslim, and less than 1% of respondents described themselves as Jewish, Sikh, Hindu or Buddhist.
This suggests that solicitors are more likely to consider they have no religion than the general population, and slightly less likely to consider themselves Christian. It is not anticipated that this proposal with have any negative impact on those solicitors.
Diversity Data from 2020/21 Practising Certificate (PC) Renewal Reported:
| Scottish census 2011 | % solicitor population | % aged 30 and under | |
|---|---|---|---|
| Christianity | 53.8% | 37.55% (-16.25%) | 33.7% |
| - Church of Scotland | 32.4% | 19.25% (-13.10%) | 11.22% |
| - Roman Catholic | 15.9% | 13.41% (-2.5%) | 15% |
| - Other Christian | 5.5% | 4.71% (-0.7%) | 3.7% |
| Islam | 1.4% | 1.33% (-0.01%) | 2.1% |
| Hinduism | 0.3% | 0.05% (-0.25%) | - |
| Buddhism | 0.2% | 0.13% (-0.07%) | - |
| Sikhism | 0.2% | 0.26% | 0.29% |
| Judaism | 0.1% | 0.42% (+0.3%) | 0.11% |
| No religion | 36.7% | 46.50% (+9.80%) | 59.98% |
| - None | - | 38.62% | 47.7% |
| - Atheist | - | 5.33% | 8.08% |
| - Agnostic | - | 2.81% | 4.2% |
| Other | 0.3% | 0.77% (+0.47%_) | 0.3% |
| Religion not stated/prefer not to say | 7% | 12.83% (5.8%) | 7.03% |