Alcohol - minimum unit pricing: public attitudes research
This report presents the findings from research into public attitudes to minimum unit pricing (MUP) of alcohol in Scotland in July 2023. The research found that respondents were slightly more likely to be in favour of MUP than against
Findings
The findings of the public attitudes research are set out in the following chapter, and differences between groups are only statistically significant where this is highlighted. Reported sample sizes are unweighted, please see Annex A for weighting targets.
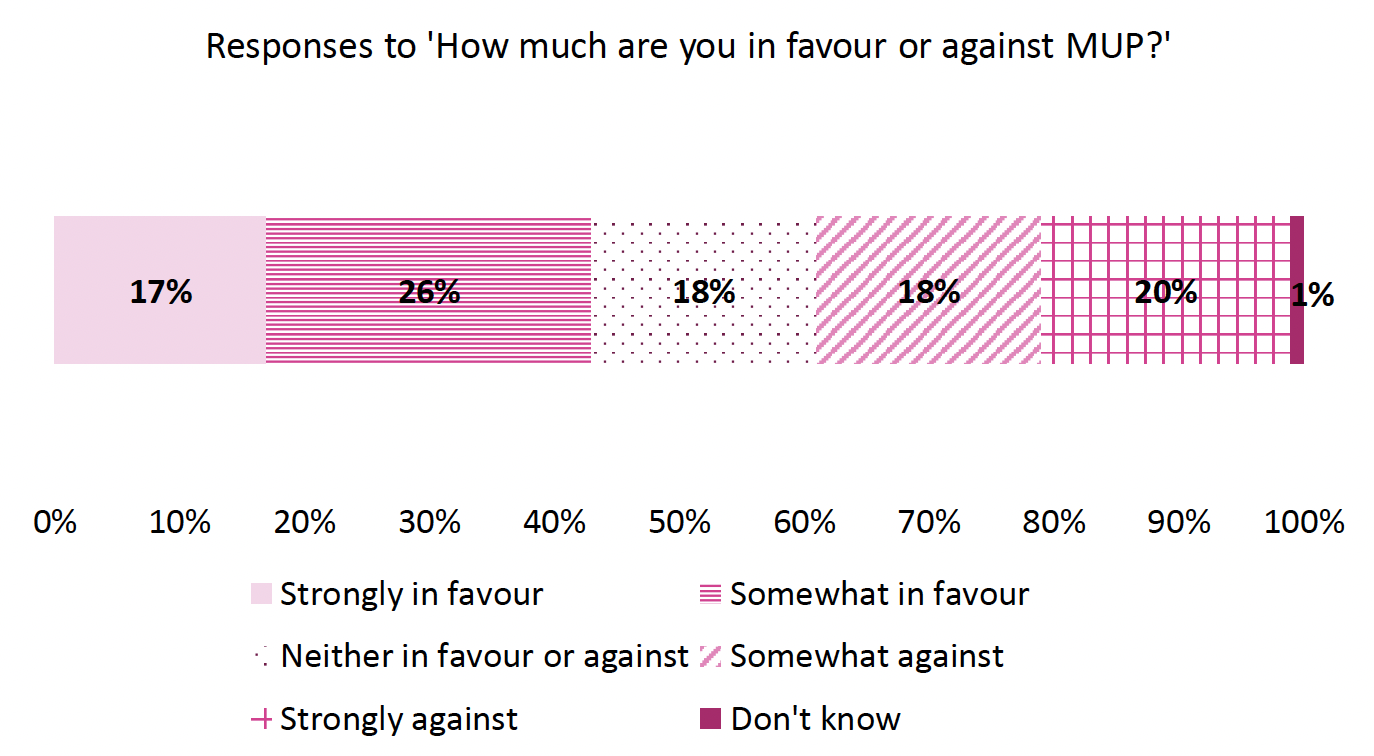
The first question respondents were asked was 'One way of trying to reduce problem drinking in Scotland is having a minimum price for different alcoholic drinks. The price is based on how much alcohol is in each drink. How much are you in favour or against minimum unit pricing of alcohol?'.
The survey found that people were overall slightly more likely to be supportive of MUP with 43% of respondents in favour of MUP while 38% were against (see figure 1). People were more likely to be somewhat in favour of MUP (26%) than strongly in favour (17%). Conversely, people were slightly more likely to be strongly against MUP (20%) than somewhat against it (18%).
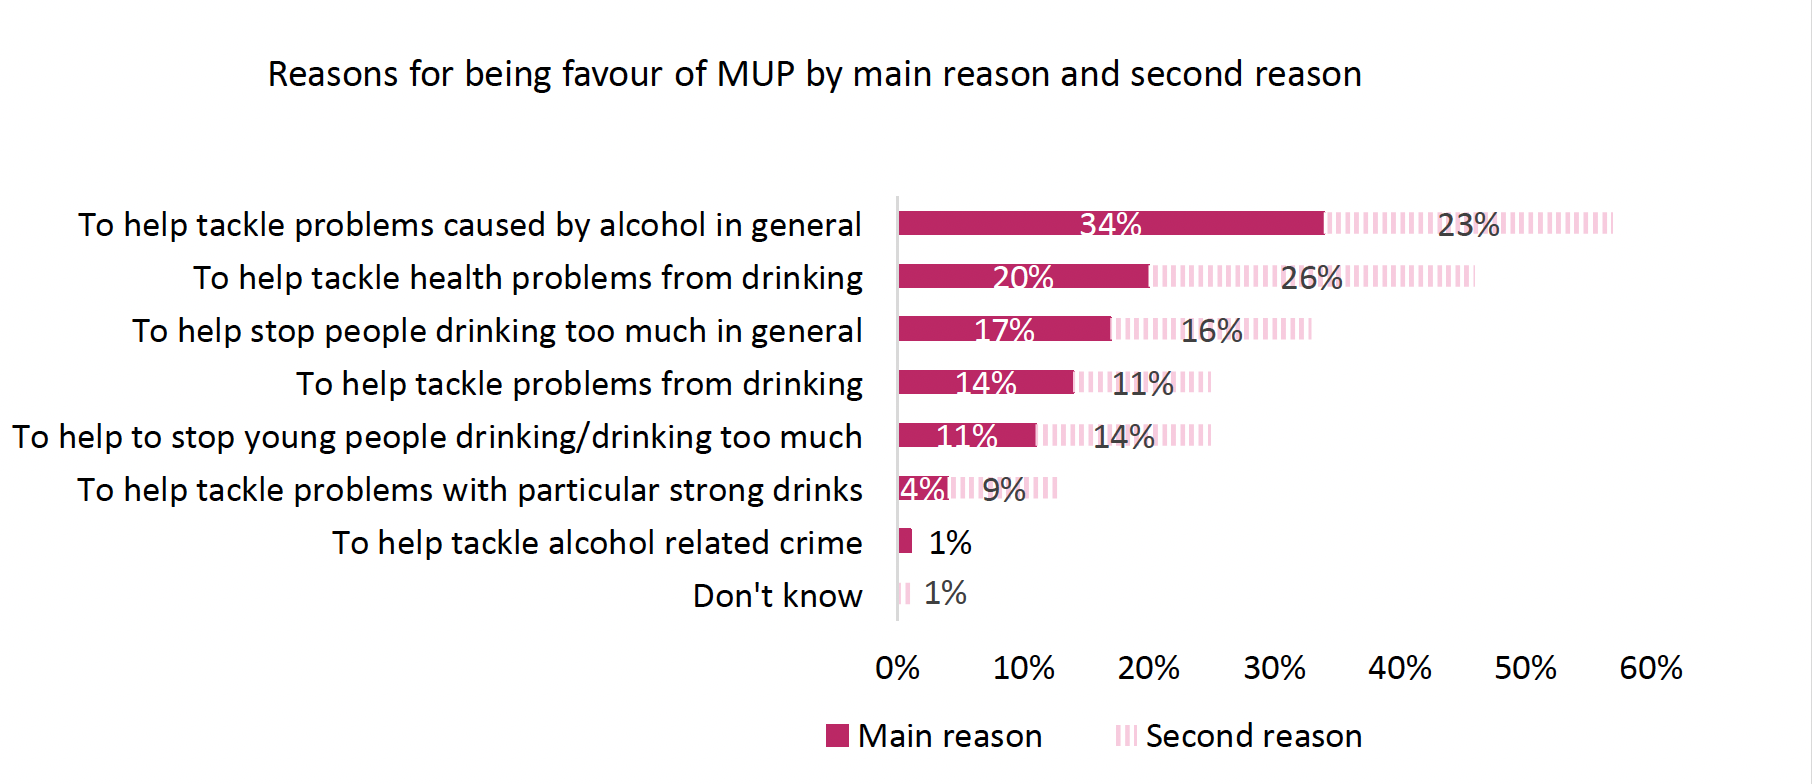
Respondents were asked what their main and second reasons for being in favour of or against MUP were. The most common main reason for being in favour of MUP was to help tackle problems caused by alcohol in general (34% of respondents in favour of MUP), followed by to help tackle health problems from drinking (20% of respondents in favour of MUP) and to help stop people drinking too much in general (17% of respondents in favour of MUP). This is presented in figure 2 below.
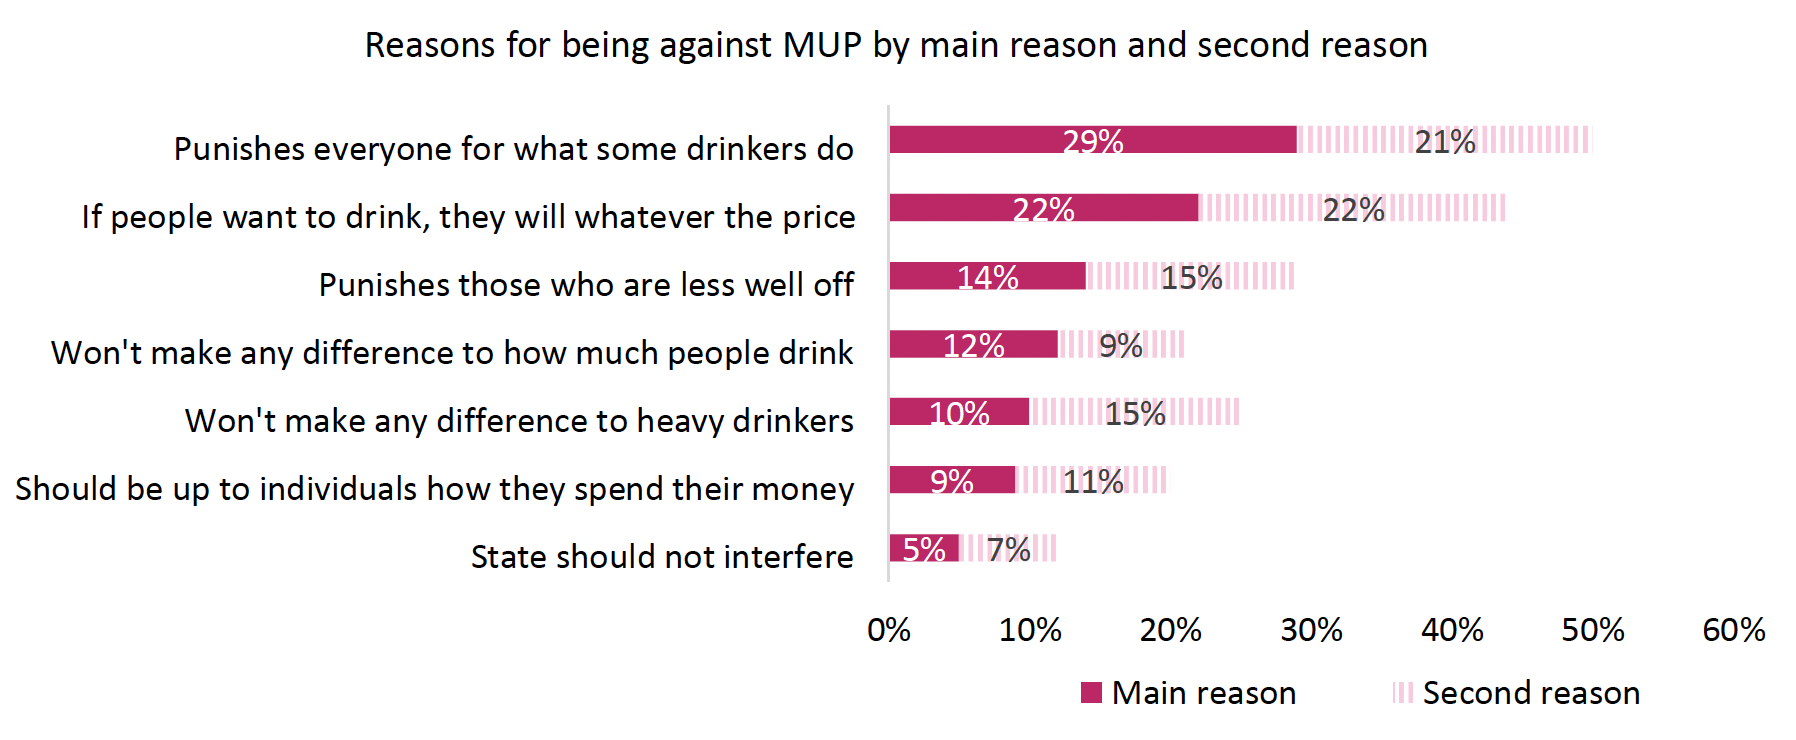
For the people who were against MUP (38%), the most common main reason was that they felt it punishes everyone for what some drinkers do (29% of respondents who were against MUP). This was followed by feeling that if people want to drink, they will whatever the price (22% of respondents who were against MUP) and that it punishes those who are less well off (14% of respondents who were against MUP). This is set out in figure 3 below.
Attitudes by gender
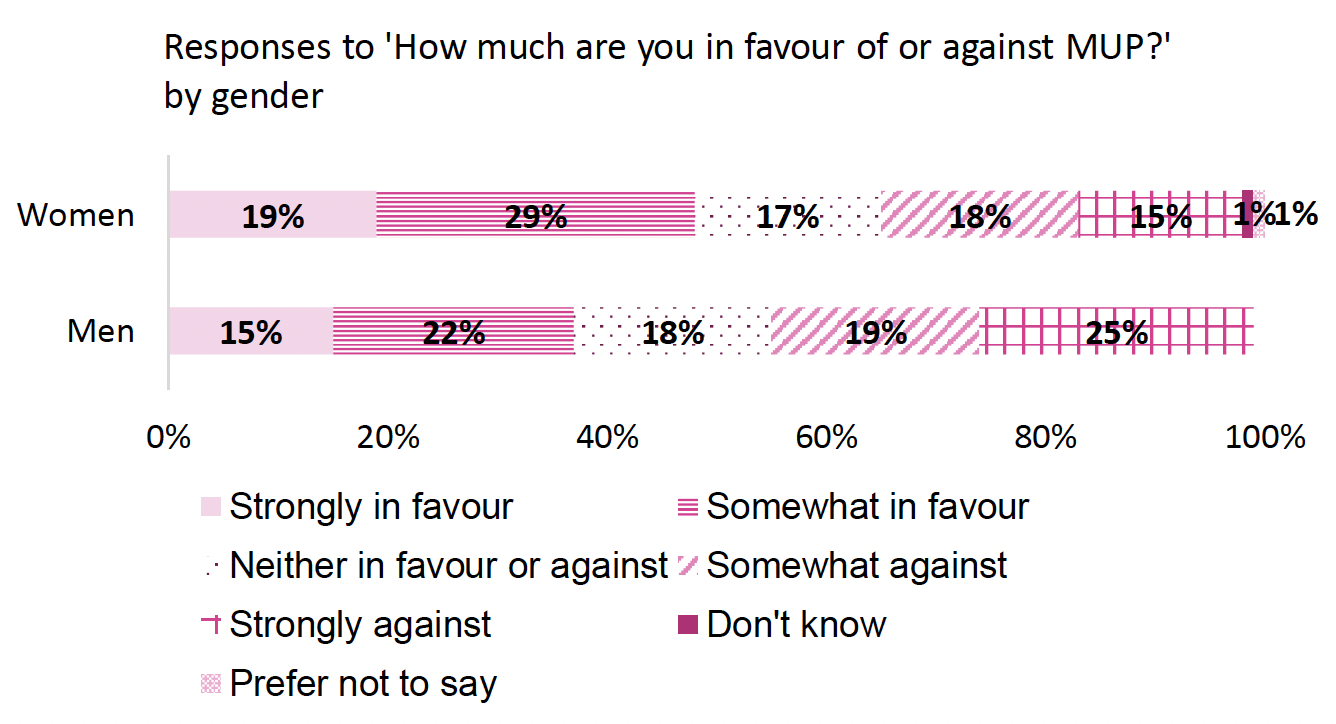
Women were significantly more likely to be in favour of MUP compared to men (48% compared to 37%), while men were significantly more likely to be against MUP compared to women (44% of men compared to 33% of women ). This is illustrated in the below figure 4.
Men were also significantly more likely to be strongly against MUP (25% of men) compared to women (15% of women).
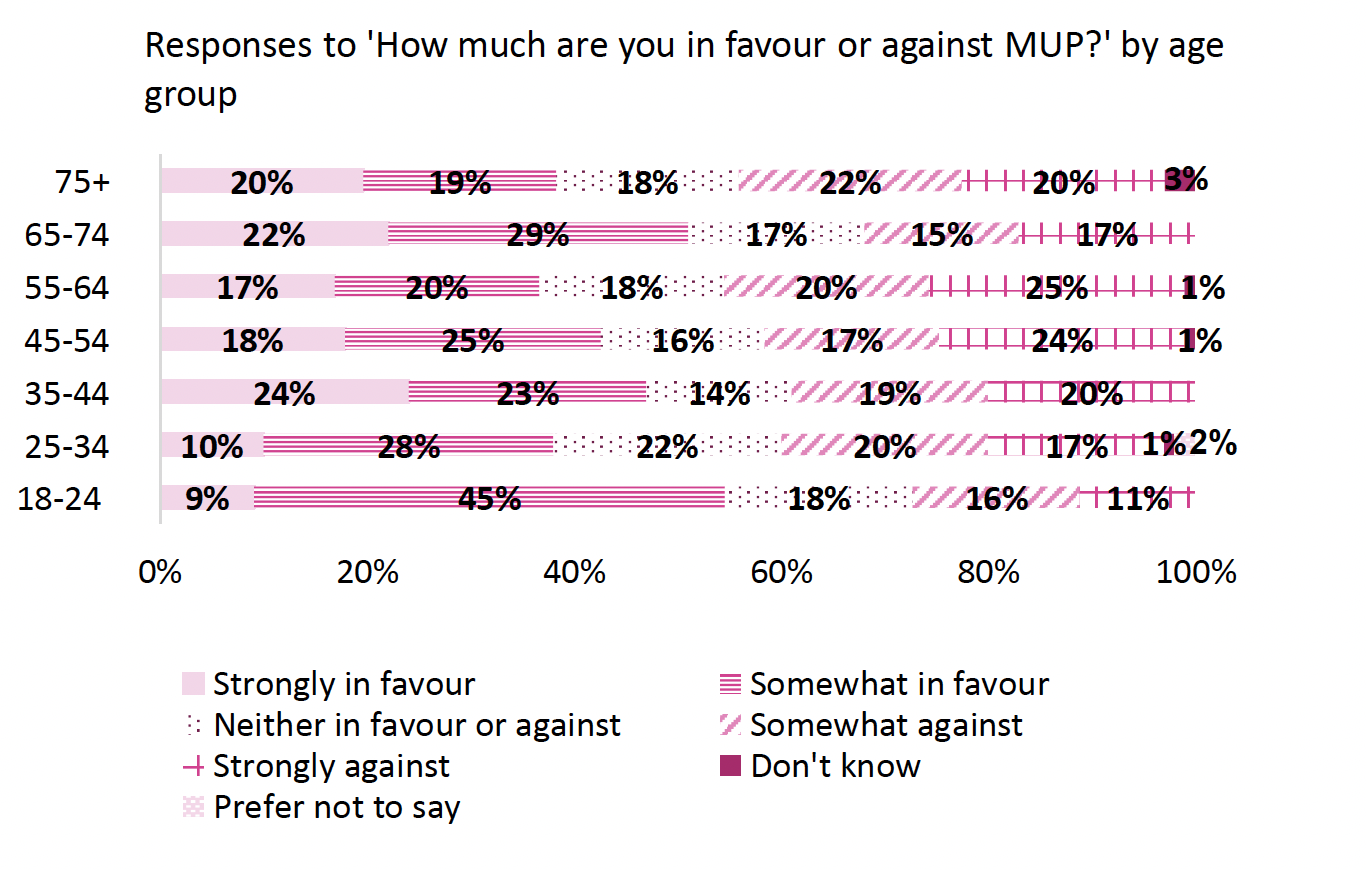
Attitudes by age
Most age groups were more likely to be in favour of MUP than against, as illustrated in figure 5 below which uses mostly ten-year age groupings. The groups 55-64 and 75+ were the only age groups that were more likely to be against MUP (44% and 42% respectively) than in favour (37% and 38% respectively).
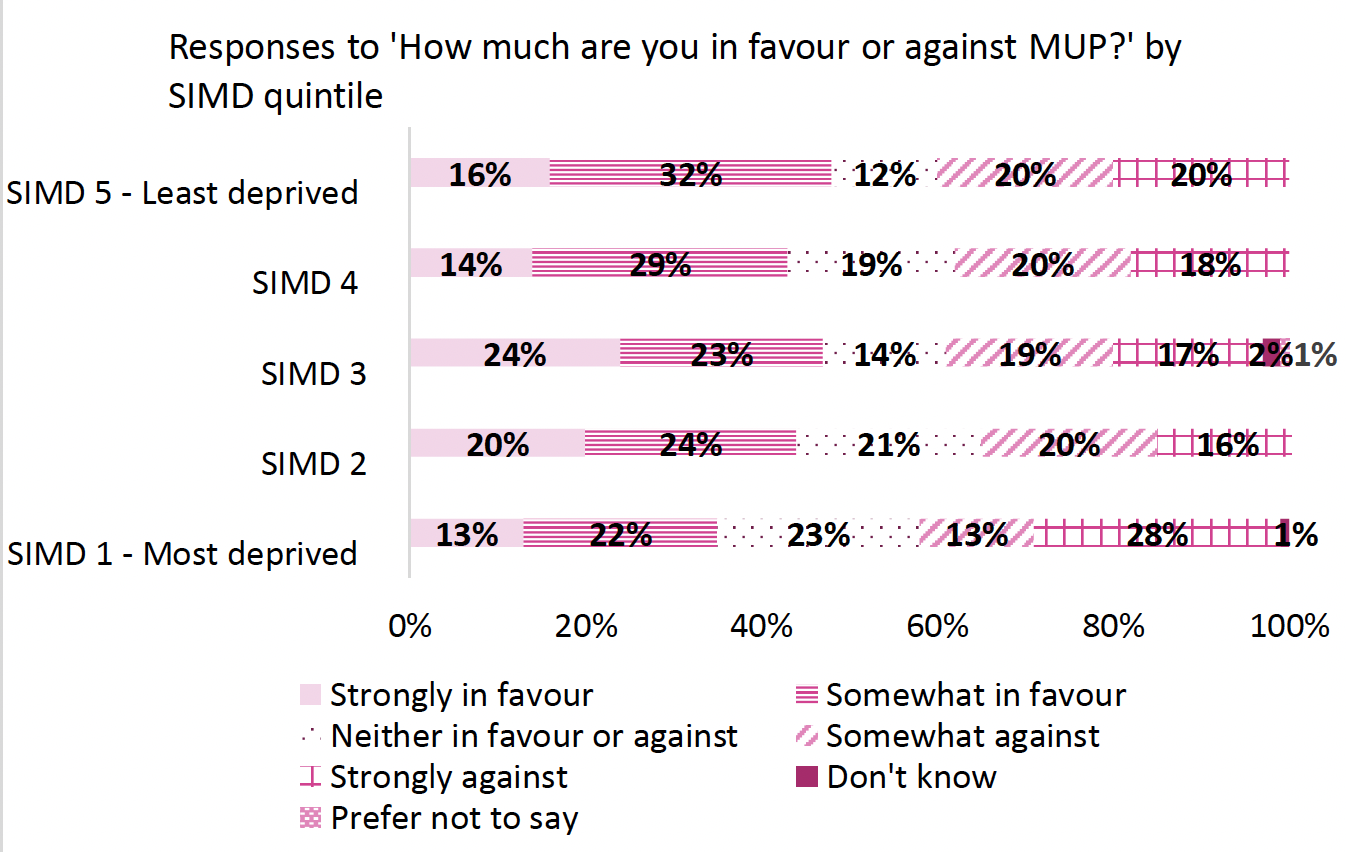
Attitudes by household income and SIMD
Figure 6 shows attitudes to MUP by household income. People in each income bracket were more likely to be in favour of MUP than against with the exception of those with the highest household income (£100,000+ per annum) (37% in favour vs 43% against)
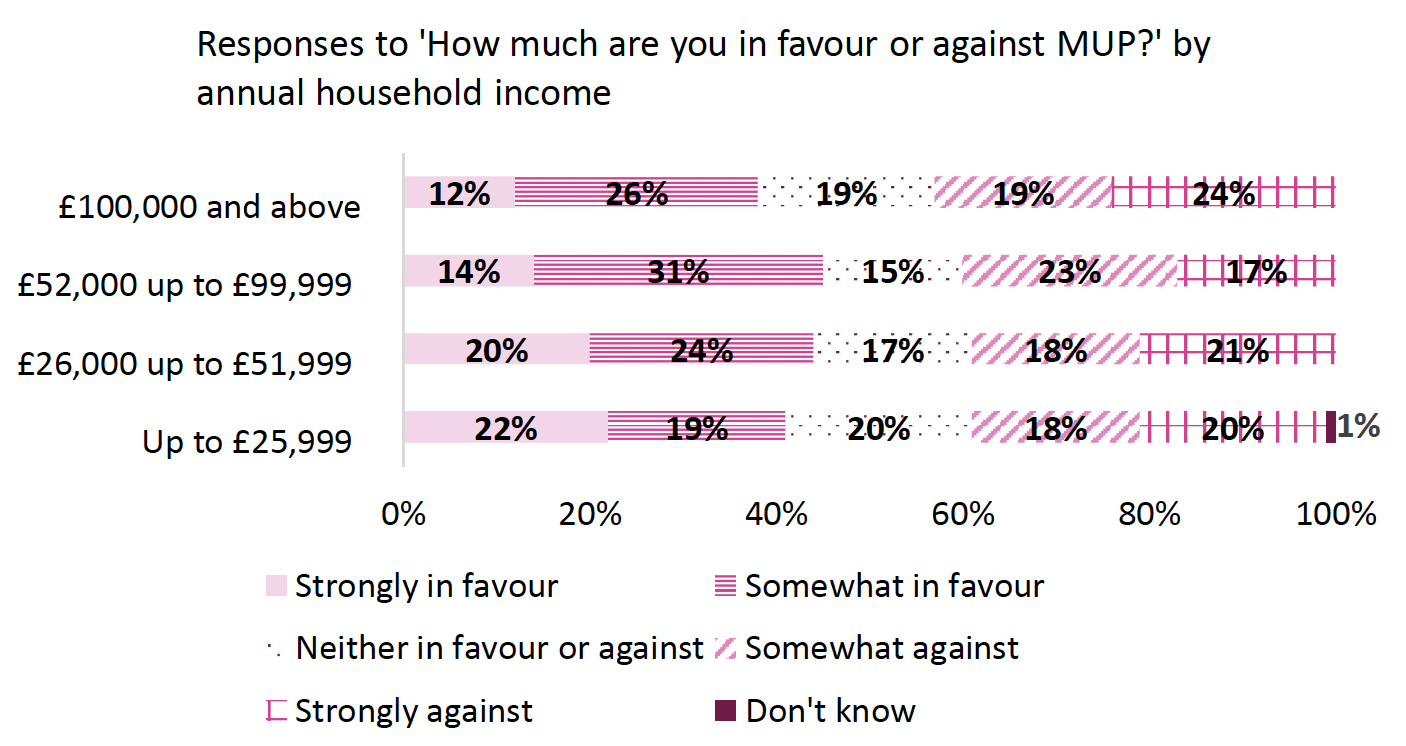
Figure 7 shows attitudes to MUP by Scottish Index of Multiple Deprivation. Those living in the least deprived areas were significantly more likely to be in favour of MUP than those living in the most deprived areas (47% vs 35%).
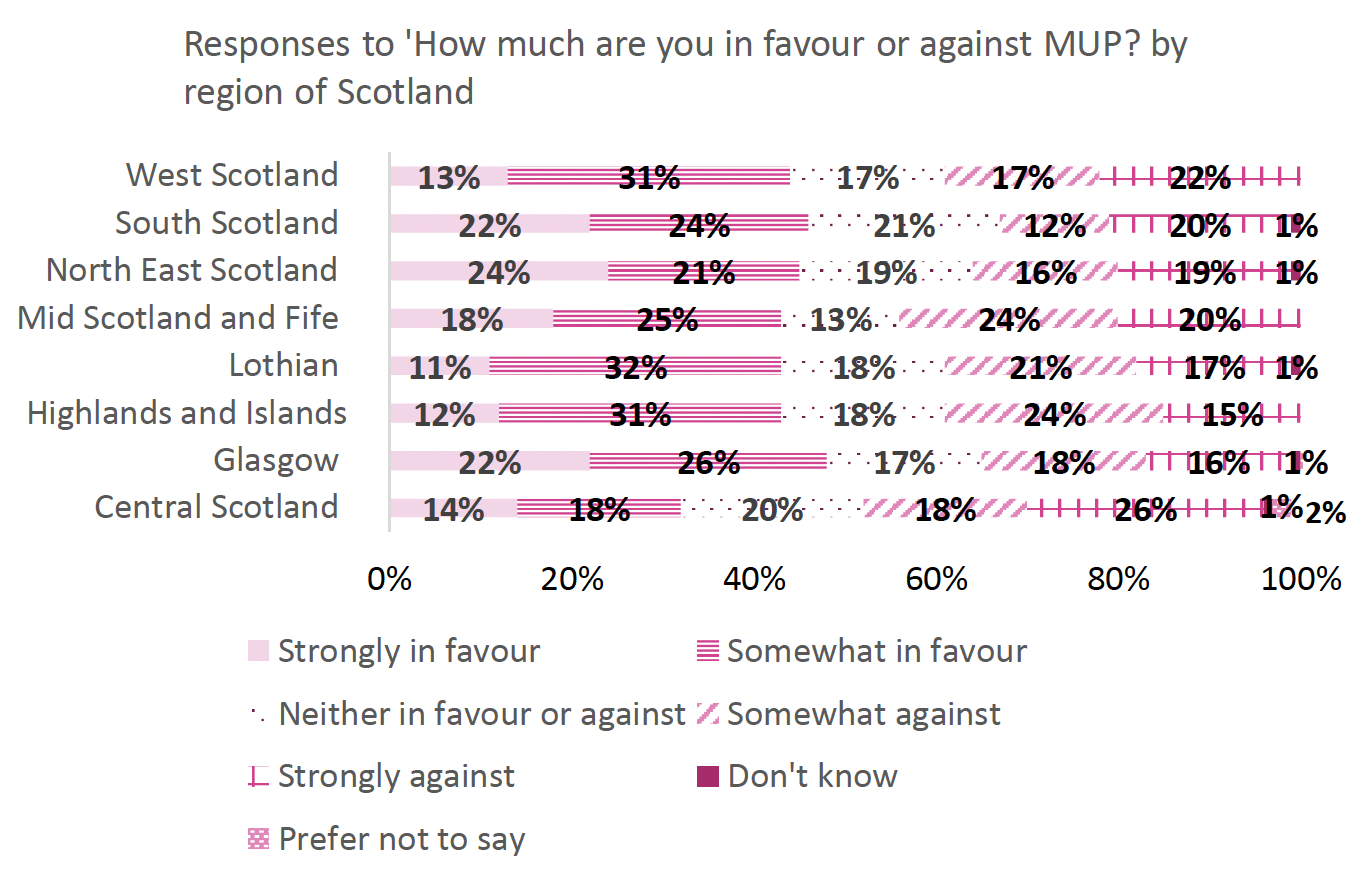
Attitudes by region of Scotland
Finally, there were no significant differences between regions looking at overall attitudes to MUP. Attitudes by region of Scotland are set out in figure 8 below.
Contact
Email: socialresearch@gov.scot